


题目 2:调频(FM)信号生成与解调
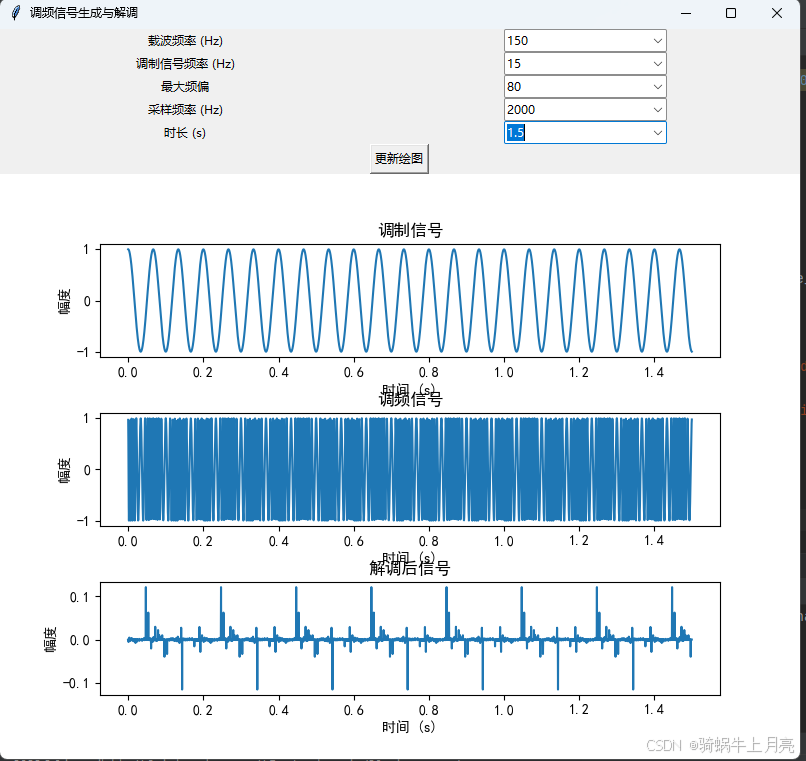
生成一个调频信号,载波频率为 200 Hz,调制信号频率为 20 Hz,最大频偏为 50 Hz,采样频率为 2000 Hz,时长为 2 秒。然后对该调频信号进行解调,恢复出原始的调制信号,并绘制出调制信号、调频信号和解调后信号的波形图。
import numpy as np
import matplotlib.pyplot as plt
from matplotlib.backends.backend_tkagg import FigureCanvasTkAgg
import tkinter as tk
from tkinter import ttk


def generate_fm_signal(fc, fm, kf, fs, duration):
    t = np.linspace(0, duration, int(fs * duration), endpoint=False)
    m_t = np.cos(2 * np.pi * fm * t)
    phase = 2 * np.pi * kf * np.cumsum(m_t) / fs
    s_t = np.cos(2 * np.pi * fc * t + phase)
    return t, m_t, s_t


def demodulate_fm_signal(s_t, fc, fs):
    d_s_t = np.gradient(s_t)
    demodulated_signal = -d_s_t / (2 * np.pi * fc * s_t)
    return demodulated_signal


def update_plot():
    try:
        fc = float(carrier_freq.get())
        fm = float(modulation_freq.get())
        kf = float(max_dev.get())
        fs = float(sampling_freq.get())
        duration = float(time_duration.get())

        t, m_t, s_t = generate_fm_signal(fc, fm, kf, fs, duration)
        demodulated_signal = demodulate_fm_signal(s_t, fc, fs)

        ax1.clear()
        ax2.clear()
        ax3.clear()

        ax1.plot(t, m_t)
        ax1.set_title('调制信号')
        ax1.set_xlabel('时间 (s)')
        ax1.set_ylabel('幅度')

        ax2.plot(t, s_t)
        ax2.set_title('调频信号')
        ax2.set_xlabel('时间 (s)')
        ax2.set_ylabel('幅度')

        ax3.plot(t, demodulated_signal)
        ax3.set_title('解调后信号')
        ax3.set_xlabel('时间 (s)')
        ax3.set_ylabel('幅度')

        # 调整子图间距
        fig.subplots_adjust(hspace=0.5)
        # 调整图形尺寸
        fig.set_figheight(9)
        fig.set_figwidth(8)
        canvas.draw()
    except ValueError:
        tk.messagebox.showerror("错误", "请输入有效的数值")


root = tk.Tk()
root.title('调频信号生成与解调')

# 使用grid_configure优化布局
root.grid_columnconfigure(0, weight=1)
root.grid_columnconfigure(1, weight=1)
root.grid_rowconfigure(6, weight=1)

tk.Label(root, text='载波频率 (Hz)').grid(row=0, column=0)
carrier_freq = ttk.Combobox(root, values=[50, 100, 150, 200])
carrier_freq.set(100)
carrier_freq.grid(row=0, column=1)

tk.Label(root, text='调制信号频率 (Hz)').grid(row=1, column=0)
modulation_freq = ttk.Combobox(root, values=[5, 10, 15, 20])
modulation_freq.set(10)
modulation_freq.grid(row=1, column=1)

tk.Label(root, text='最大频偏').grid(row=2, column=0)
max_dev = ttk.Combobox(root, values=[20, 50, 80, 100])
max_dev.set(50)
max_dev.grid(row=2, column=1)

tk.Label(root, text='采样频率 (Hz)').grid(row=3, column=0)
sampling_freq = ttk.Combobox(root, values=[500, 1000, 1500, 2000])
sampling_freq.set(1000)
sampling_freq.grid(row=3, column=1)

tk.Label(root, text='时长 (s)').grid(row=4, column=0)
time_duration = ttk.Combobox(root, values=[0.5, 1, 1.5, 2])
time_duration.set(1)
time_duration.grid(row=4, column=1)

update_button = tk.Button(root, text='更新绘图', command=update_plot)
update_button.grid(row=5, column=0, columnspan=2)

# 创建子图时设置高度比例
fig, (ax1, ax2, ax3) = plt.subplots(3, 1, figsize=(8, 9), gridspec_kw={'height_ratios': [1, 1, 1]})
canvas = FigureCanvasTkAgg(fig, master=root)
canvas.get_tk_widget().grid(row=6, column=0, columnspan=2, sticky='nsew')

plt.rcParams['font.family'] = 'SimHei'
plt.rcParams['axes.unicode_minus'] = False

root.mainloop()


 被折叠的 条评论
为什么被折叠?
被折叠的 条评论
为什么被折叠?
 到【灌水乐园】发言


