


波动干涉
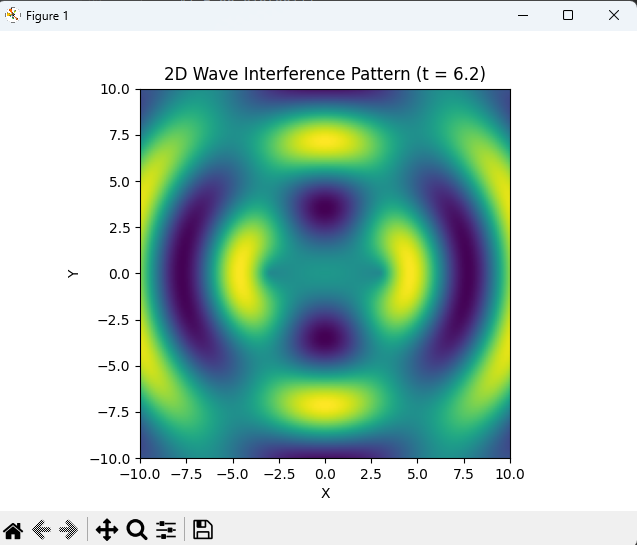
绘制两列水波相遇后的干涉条纹,展示波的叠加原理。
import numpy as np
import matplotlib.pyplot as plt
from matplotlib.animation import FuncAnimation

# 定义网格
x = np.linspace(-10, 10, 200)
y = np.linspace(-10, 10, 200)
X, Y = np.meshgrid(x, y)

# 定义两列波的参数
k = 1  # 波数
omega = 1  # 角频率

# 创建图形和坐标轴
fig, ax = plt.subplots()
im = None


def update(frame):
    global im
    t = frame * 0.1
    # 计算两列波的相位
    phi1 = k * np.sqrt((X - 3) ** 2 + Y ** 2) - omega * t
    phi2 = k * np.sqrt((X + 3) ** 2 + Y ** 2) - omega * t

    # 计算两列波的振幅
    A1 = np.sin(phi1)
    A2 = np.sin(phi2)

    # 计算叠加后的波
    A = A1 + A2

    if im:
        im.remove()
    im = ax.imshow(A, extent=[-10, 10, -10, 10], cmap='viridis', origin='lower')
    ax.set_xlabel('X')
    ax.set_ylabel('Y')
    ax.set_title(f'2D Wave Interference Pattern (t = {t:.1f})')
    return im,


# 创建动画
ani = FuncAnimation(fig, update, frames=100, interval=100, blit=False)

plt.show()


 332
332

 被折叠的 条评论
为什么被折叠?
被折叠的 条评论
为什么被折叠?
 到【灌水乐园】发言


