


echarts的基本使用
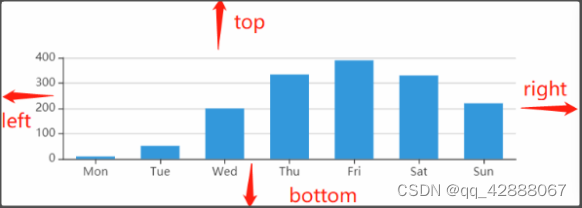
1.grid:调整的是图片的位置
grid:{
	top:0;
	right:0
	bottom:0;
	left:0
}
grid可以填具体的数值,也可以是百分比(占盛放容器大小的百分比),left代表的是与容器左侧的空隙,right代表与容器右侧的空隙,top和bottom分别代表与上下的空隙。
2. legend:图例
legend: {
        icon:"circle", //图标形状
        itemHeight:18, //图标高度
        itemGap:24,//图例之间的间距
        orient:'vertical', //图例的排列方式
        left:'50%', //图例的位置(左)
        y:'center', //图例在垂直方向上的位置,也可以使用top,bottom替代
        textStyle:{
          fontSize:18,  //图例文字大小
          color:'#999999' //图例文字颜色
        },
        formatter:function(name){   //修改图例展示内容
          let data=option.series[0].data;
          let sum=0;
          for(let i=0;i<data.length;i++){
            sum+=data[i].value
          }
          let tarValue;
          let tarPer;
          for(let i=0;i<data.length;i++){
            if(data[i].name===name){
              tarValue=data[i].value
              tarPer=((data[i].value/sum)*100).toFixed(2)

            }
          }
          return name+"    "+tarPer+"%" +"    "+tarValue;
        }
      },
3.xAxis,yAxis:坐标轴
xAxis: {
      show:true, //是否展示坐标轴
      type: 'category',
      axisLine:{
        show:true,//是否展示坐标轴线
        lineStyle:{
          color:'#F3F6FA '//坐标轴线颜色
        }
      },
      axisLabel:{
        color:'#67808E'//坐标轴文字颜色
      }
    },
4.图表自适应
var elementResizeDetectorMaker = require("element-resize-detector");
mounted() {
      this.energyWater()
      this.drawMoneyPie()
      this.drawMoneyCategory()
      this.drawCircle()
      this.drawCircle2()
      this.chartResize()
      window.addEventListener('resize',()=>{
        this.drawMoneyPie()
      })

},
methods: {
      chartResize(){
          let erd=elementResizeDetectorMaker()
          erd.listenTo(this.$el,(element)=>{
          this.chart.resize()
          this.pieChart.resize()
          this.barChart.resize()
          this.circleChart.resize()
          this.circleChart2.resize()
        })
      },
      drawCircle(){
        this.circleChart=echarts.init(this.$refs.fixedD)

        let option = { }
        this.circleChart.setOption(option)
      },
}
有一个问题是我在使用图表时若使用flex布局,在子元素中使用felx:1来表示元素大小时,图表自适应不生效,改为width:50%用百分比表示自适应生效。
5.图表文字自适应
changeFontSize(res){
      let clientWidth = window.innerWidth||document.documentElement.clientWidth||document.body.clientWidth;
       if (!clientWidth) return;
       let fontSize = 100 * (clientWidth / 1920);
       return res*fontSize;
 },
在设置文字或者icon大小时调用该函数,可以使得图表里文字随屏幕大小而变化


 7891
7891


 被折叠的 条评论
为什么被折叠?
被折叠的 条评论
为什么被折叠?
 到【灌水乐园】发言


