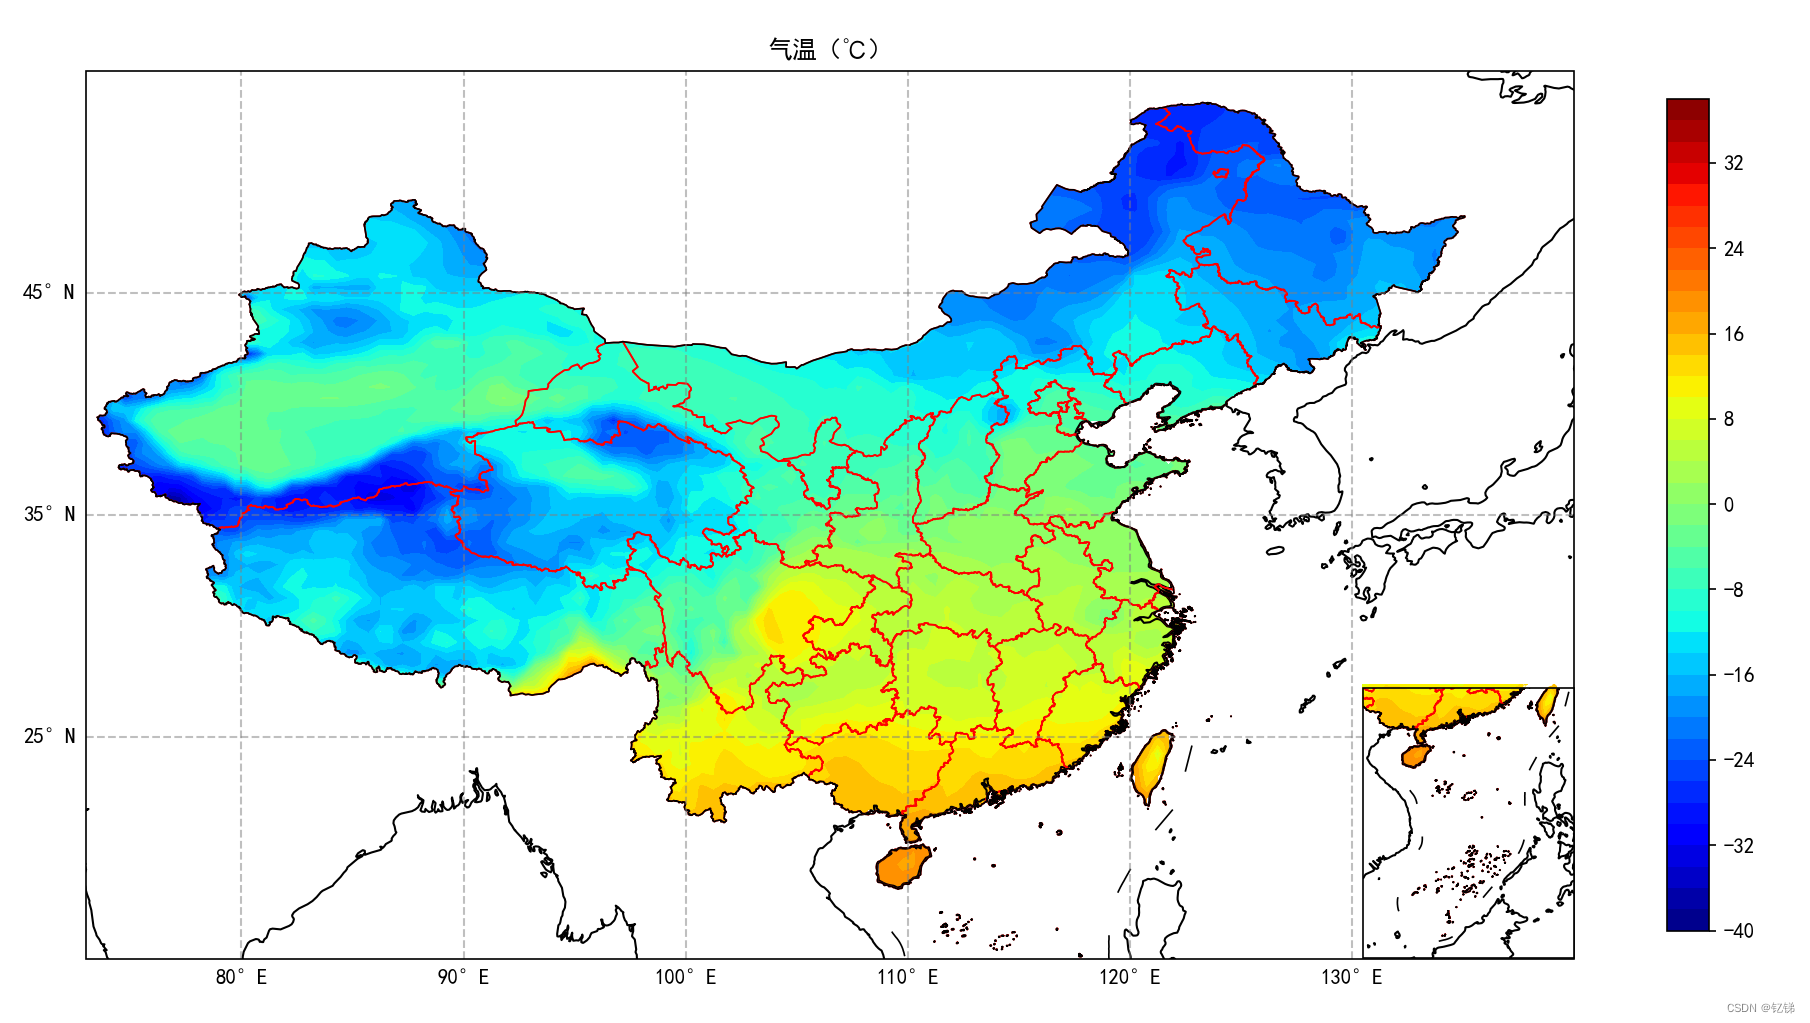
气象信息可视化(五)——全国气温分布图

import numpy as np
import matplotlib.pyplot as plt
import cartopy.feature as cfeature
import cartopy.crs as ccrs
from netCDF4 import Dataset
from cartopy.mpl.ticker import LongitudeFormatter,LatitudeFormatter
from cnmaps import get_adm_maps,clip_contours_by_map,draw_maps
from cartopy.io.shapereader import Reader


plt.rcParams['font.sans-serif'] = [u'SimHei']
plt.rcParams['axes.unicode_minus'] = False

f = Dataset('air.mon.mean.nc')

air = f.variables['air'][0,:,:]
lat = f.variables['lat'][:]
lon = f.variables['lon'][:]
lon2=lon[210:247]
lat2=lat[129:175]
air2=air[129:175,210:247]
fig=plt.figure(figsize=(16,9))
#001
ax = fig.add_subplot(111,projection=ccrs.PlateCarree())
ax.set_extent([73,140,15,55],crs=ccrs.PlateCarree())
ax.coastlines('50m')
map_polygon = get_adm_maps(country='中华人民共和国', record='first', only_polygon=True)
draw_maps(get_adm_maps(level='省'), linewidth=0.8, color='r')
gl = ax.gridlines(crs = ccrs.PlateCarree(),draw_labels = True,linewidth = 1,alpha = 0.5,color = 'grey',linestyle = '--')
gl.xlocator = plt.FixedLocator(np.arange(70, 140, 10))
gl.ylocator = plt.FixedLocator(np.arange(15, 55, 10))
gl.xlabel_style = {'size': 10}
gl.ylabel_style = {'size':10}
gl.right_labels = False
gl.top_labels = False

con=ax.contourf(lon,lat,air-273.15,levels=np.arange(-40,40,2),cmap='jet',transform=ccrs.PlateCarree())
draw_maps(get_adm_maps(country='中华人民共和国',level='国'), color='k',linewidth=0.8)
clip_contours_by_map(con, map_polygon)
fig.colorbar(con,ax=ax,shrink=0.8,pad=0.05)
ax.set_title('气温(℃)',fontsize=12)

#002
bx = fig.add_axes([0.601, 0.167, 0.2, 0.2], projection=ccrs.PlateCarree())
bx.set_extent([105.25, 123.25, 2, 25],ccrs.PlateCarree())
bx.add_feature(cfeature.COASTLINE)
con2=bx.contourf(lon2,lat2,air2-273.15,levels=np.arange(-40,40,2),cmap='jet',transform=ccrs.PlateCarree())
ac=clip_contours_by_map(con2, map_polygon)
draw_maps(get_adm_maps(level='省'), linewidth=0.8, color='r')
draw_maps(get_adm_maps(country='中华人民共和国',level='国'), color='k',linewidth=0.8)

plt.savefig('全国气温.jpg', bbox_inches='tight', dpi=300)
plt.show()


  • 10
    点赞
  • 7
    收藏
    觉得还不错? 一键收藏
  • 1
    评论

“相关推荐”对你有帮助么?

  • 非常没帮助
  • 没帮助
  • 一般
  • 有帮助
  • 非常有帮助
提交
评论 1
添加红包

请填写红包祝福语或标题

红包个数最小为10个

红包金额最低5元

当前余额3.43前往充值 >
需支付:10.00
成就一亿技术人!
领取后你会自动成为博主和红包主的粉丝 规则
hope_wisdom
发出的红包
实付
使用余额支付
点击重新获取
扫码支付
钱包余额 0

抵扣说明:

1.余额是钱包充值的虚拟货币,按照1:1的比例进行支付金额的抵扣。
2.余额无法直接购买下载,可以购买VIP、付费专栏及课程。

余额充值