


以下内容笔记出自‘跟着迪哥学python数据分析与机器学习实战’,外加个人整理添加,仅供个人复习使用。
对于数据X,分别选择两种预处理方案,在不同预处理方案中再建立不同模型,最终汇总所有模型结果。
import numpy as np
import pandas as pd
import matplotlib.pyplot as plt
%matplotlib inline
import os
#os.chdir('')
1. 导入数据
#设置随机种子
SEED=222
np.random.seed(SEED)

df=pd.read_csv(r'input.csv')
print(df.shape)
df.head(6)


2. 查看因变量分布
df.cand_pty_affiliation.value_counts(normalize=True).plot(
    kind='bar',title='Share or No. donations')
plt.show()

3. 分割数据集
'''
对cand_pty_affiliation是否为REP进行预测
'''
from sklearn.model_selection import train_test_split
from sklearn.metrics import roc_auc_score

def get_train_test(test_size=0.95):
    y=1*(df['cand_pty_affiliation']=='REP')  #因变量建立
    X=df.drop(['cand_pty_affiliation'],axis=1)
    X=pd.get_dummies(X,sparse=True)          #哑变量设置 为什么??
    X.drop(X.columns[X.std()==0],axis=1,inplace=True) #某列数值相同的删去
    return train_test_split(X,y,test_size=test_size,random_state=SEED)

X_train,X_test,y_train,y_test=get_train_test()
print(X_train.shape,X_test.shape)
(5000, 158) (95000, 158)
(其实这里个人有一个问题:现在的数据集有158个特征,是为了多特征而构造的吗?因为分类变量可以直接加入模型建模啊,为什么要进行哑变量设置?如果有小伙伴可以提点下,谢谢留言哈!)
4. 构建几个基础的决策树模型看看
import pydotplus
from IPython.display import Image
from sklearn.metrics import roc_auc_score
from sklearn.tree import DecisionTreeClassifier,export_graphviz

#定义决策树画图函数,因为待会通过图形看结果
def print_graph(clf,feature_names):
    graph=export_graphviz(
        clf,
        label='root',
        proportion=True,
        impurity=False,
        out_file=None,
        feature_names=feature_names,
        class_names={0:'D',1:'R'},
        filled=True,rounded=True)

    graph=pydotplus.graph_from_dot_data(graph)
    return Image(graph.create_png())
5. 建模
5.1 第1个模型
#建模
t1=DecisionTreeClassifier(max_depth=1,random_state=SEED)
t1.fit(X_train,y_train)

#auc值
p=t1.predict_proba(X_test)[:,1]
print('DecisionTree ROC_AUC score:%.3f' %roc_auc_score(y_test,p))
#决策树图形
print_graph(t1,X_train.columns)
DecisionTree ROC_AUC score:0.672

上面的决策树没有用处,因为所有的预测结果是一样的。
5.2 再看第2个
t2=DecisionTreeClassifier(max_depth=3,random_state=SEED)
t2.fit(X_train,y_train)
p=t2.predict_proba(X_test)[:,1]
print('Decision tree roc-auc score:%.3f' % roc_auc_score(y_test,p))
print_graph(t2,X_train.columns)
Decision tree roc-auc score:0.751

47.3%的样本落在了最左边,还有35.9%落在了基本最右边,看起来模型基本过拟合
调整下策略,去掉个对结果有着最大影响的因素看看!
5.3 第3个模型
drop=['transaction_amt']
X_train_slim=X_train.drop(drop,1)
X_test_slim=X_test.drop(drop,1)

t3=DecisionTreeClassifier(max_depth=3,random_state=SEED)
t3.fit(X_train_slim,y_train)
p=t3.predict_proba(X_test_slim)[:,1]
print('DT roc_auc: %.3f' % roc_auc_score(y_test,p))

print_graph(t3,X_train_slim.columns)
DT roc_auc: 0.740

5.4 将两个决策树模型结合
从以上两个树来看,模型评估结果差不多,但是树看起来很不一样,各自都有错误,可以综合利用
p1=t2.predict_proba(X_test)[:,1]
p2=t3.predict_proba(X_test_slim)[:,1]
p=np.mean([p1,p2],axis=0)
print('average of decision tree Roc_auc score:%.3f' % roc_auc_score(y_test,p))
average of decision tree Roc_auc score:0.783
果然预测的结果的得分比原来高许多!!
这么一来,应该是选择不同的特征会产生不同的结果,然后用不同的结果再进行组合得到一个提高!那我们多选几组不就是随机森林了嘛!
6. 随机森林
from sklearn.ensemble import RandomForestClassifier

rf=RandomForestClassifier(
    n_estimators=10,max_features=3,
    random_state=SEED)

rf.fit(X_train,y_train)
p=rf.predict_proba(X_test)[:,1]
print('rf roc_auc: %.3f' % roc_auc_score(y_test,p))
rf roc_auc: 0.844
显然比单棵决策树的auc值要高!!
7. 集成
from sklearn.svm import SVC,LinearSVC
from sklearn.naive_bayes import GaussianNB
from sklearn.ensemble import RandomForestClassifier,\
    GradientBoostingClassifier
from sklearn.linear_model import LogisticRegression
from sklearn.neighbors import KNeighborsClassifier
from sklearn.neural_network import MLPClassifier
from sklearn.kernel_approximation import Nystroem
from sklearn.kernel_approximation import RBFSampler
from sklearn.pipeline import make_pipeline
7.1 定义函数
#定义模型字典函数
def get_models():
    nb=GaussianNB()
    svc=SVC(C=100,probability=True)
    knn=KNeighborsClassifier(n_neighbors=3)
    lr=LogisticRegression(C=100,random_state=SEED)
    nn=MLPClassifier((80,10),early_stopping=False,random_state=SEED)
    gb=GradientBoostingClassifier(n_estimators=100,random_state=SEED)
    rf=RandomForestClassifier(n_estimators=100,max_features=3,
                             random_state=SEED)

    models={'svm':svc,  #支持向量机
           'knn':knn,   #K近邻估计
           'naive bayes':nb,  #朴素贝叶斯
           'mlp-nn':nn,
           'random forest':rf,    #随机森林
           'gbm':gb,              #梯度提升树
           'logistic':lr}         #逻辑回归
    return models
#定义预测函数
def train_predict(model_list):
    P=np.zeros((y_test.shape[0],len(model_list))) #数据框形状
    P=pd.DataFrame(P)

    print('Fitting models.')
    cols=list()
    for i,(name,m) in enumerate(models.items()):
        print('%s...'% name,end="",flush=False)  #flush=F 请求完毕后输出相应内容
        m.fit(X_train,y_train)
        P.iloc[:,i]=m.predict_proba(X_test)[:,1]  #填入预测值
        cols.append(name)        #收集名称
        print('done')
    print('Done.\n')
    P.colunms=cols              #数据框列名
    return P
#定义auc取值函数
def score_models(P,y_test):
    print('scoring models.')
    for m in P.columns:
        score=roc_auc_score(y_test,P.iloc[:,m])
        print('%-26s:%.3f' %(m,score))
    print('Done.\n')
cols=list()
for name in range(0,3):
    cols.append(name)
cols
[0, 1, 2]
7.2 建模
import warnings
warnings.filterwarnings('ignore')

models=get_models()
P=train_predict(models)
score_models(P,y_test)

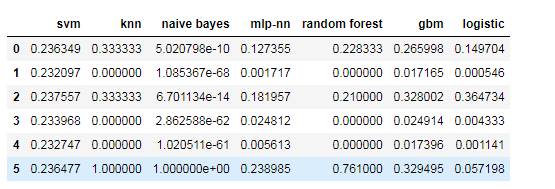
7.3 比较多个模型结果
cols=list()
for name in models.keys():
    cols.append(name)

P.columns=cols
P.head(6)
from mlens.visualization import corrmat
corrmat(P.corr(),inflate=False)
plt.show()

print('Ensemble roc_auc score: %.3f' % roc_auc_score(y_test,P.mean(axis=1)))
Ensemble roc_auc score: 0.884
显然总结果的得分比每一个模型都高!
8. 多个模型的roc_auc曲线
from sklearn.metrics import roc_curve
def plot_roc_curve(ytest, P_base_learners, P_ensemble, labels, ens_label):
    """Plot the roc curve for base learners and ensemble."""
    plt.figure(figsize=(10, 8))
    plt.plot([0, 1], [0, 1], 'k--')

    cm = [plt.cm.rainbow(i)
      for i in np.linspace(0, 1.0, P_base_learners.shape[1] + 1)]

    for i in range(P_base_learners.shape[1]):
        p = P_base_learners[:, i]
        fpr, tpr, _ = roc_curve(y_test, p)
        plt.plot(fpr, tpr, label=labels[i], c=cm[i + 1])

    fpr, tpr, _ = roc_curve(y_test, P_ensemble)
    plt.plot(fpr, tpr, label=ens_label, c=cm[0])

    plt.xlabel('False positive rate')
    plt.ylabel('True positive rate')
    plt.title('ROC curve')
    plt.legend(frameon=False)
    plt.show()


plot_roc_curve(y_test, P.values, P.mean(axis=1), list(P.columns), "ensemble")

roc曲线上每一个点对应一个threshold,对于一个分类器,每个threshold下会有一个TPR和FPR.随着阈值的减小,TP和FP都在减小,TPR和FPR也在减小,ROC点在向下移动。
可以看出,集成算法的曲线基本包含基础分类器的曲线
之前的集成是按照平均来算的,但是这样公平吗?有的拖后腿咋办?
p=P.apply(lambda x: 1*(x>=0.5).value_counts(normalize=True))
p.index=['DEM','REP']
p.loc['REP',:].sort_values().plot(kind='bar')
plt.axhline(0.25,color='k',linewidth=0.5)
plt.text(0,0.23,'True share republicans')
plt.show()

个别模型捕捉不到一些类别!将效果最差的剔除掉
include=[c for c in P.columns if c not in [['svm','mlp-nn']]]
print('New roc_auc score:%.3f' % roc_auc_score(y_test,P.loc[:,include].mean(axis=1)))
New roc_auc score:0.884
能否让机器自己选择怎么用基础模型的结果呢?
对于每一个训练模型,选择一个最合适的权重,但是权重如何定义,我们可以训练一个模型来定义这些权重。
需要考虑的是,第二个模型的输入应该是什么?
9. Stacking模型
9.1 定义模型
base_learners=get_models()
9.2 定义权重分配模型
meta_learner = GradientBoostingClassifier(
    n_estimators=1000,
    loss="exponential",
    max_features=4,
    max_depth=3,
    subsample=0.5,
    learning_rate=0.005,
    random_state=SEED
)
9.3 将基础模型分成两部分,主要供第二层使用
X_train_base,X_test_base,y_train_base,y_test_base=train_test_split(
    X_train,y_train,test_size=0.5,random_state=SEED)
9.4 训练基础模型
def train_base_learners(base_learners, inp, out, verbose=True):
    """Train all base learners in the library."""
    if verbose: print("Fitting models.")
    for i, (name, m) in enumerate(base_learners.items()):
        if verbose: print("%s..." % name, end=" ", flush=False)
        m.fit(inp, out)
        if verbose: print("done")

train_base_learners(base_learners, X_train_base, y_train_base)


 515
515


 被折叠的 条评论
为什么被折叠?
被折叠的 条评论
为什么被折叠?
 到【灌水乐园】发言


