


LiveCharts文档-3开始-7标签
Label就是Chart中表示数值的字符串,通常被放置在轴的位置和提示当中。
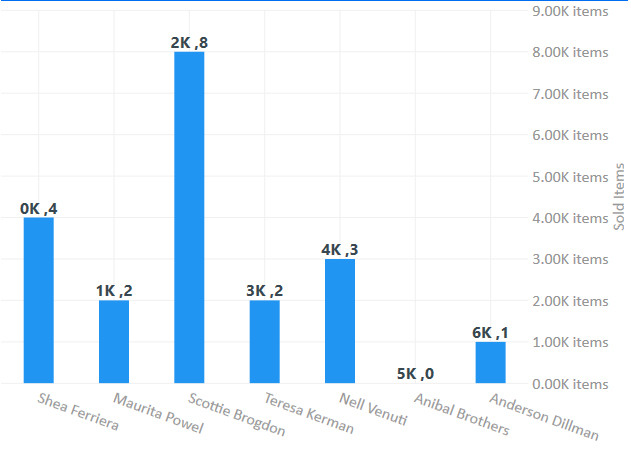
下图中的这些字符串显示的都是标签
using System;
 using System.Windows.Forms;
 using LiveCharts;
 using LiveCharts.Defaults;
 using LiveCharts.Wpf;
namespace Winforms.Cartesian.Labels
{
public partial class Labels : Form
{
public Labels()
{
InitializeComponent();
}
    private void Labels_Load(object sender, EventArgs e)
    {
        cartesianChart1.Series.Add(new ColumnSeries
        {
            Values = new ChartValues<ObservableValue>
            {
                new ObservableValue(4),
                new ObservableValue(2),
                new ObservableValue(8),
                new ObservableValue(2),
                new ObservableValue(3),
                new ObservableValue(0),
                new ObservableValue(1),
            },
            DataLabels = true,
            LabelPoint = point => point.Y + "K"
        });

        cartesianChart1.AxisX.Add(new Axis
        {
            Labels = new[]
            {
                "Shea Ferriera",
                "Maurita Powel",
                "Scottie Brogdon",
                "Teresa Kerman",
                "Nell Venuti",
                "Anibal Brothers",
                "Anderson Dillman"
            },
            Separator = new Separator // force the separator step to 1, so it always display all labels
            {
                Step = 1,
                IsEnabled = false //disable it to make it invisible.
            },
            LabelsRotation = 15
        });

        cartesianChart1.AxisY.Add(new Axis
        {
            LabelFormatter = value => value + ".00K items",
            Separator = new Separator()
        });

    }
}
}
LiveCharts有两种类型的Label,格式化类型和映射类型。
格式化类型
当Chart当中的值和label之间存在直接转换的时候,格式化类型的Label会很有用。比如,在下面的图片中,Y轴值的范围从8到26,但是因为现在的格式化器的作用,我们能够看到8被显示为8.00k。
Axis.LabelFormatter 可以使用double类型的值作为输入,返回一个string,LiveCharts每次在需要将表的值显示为字符串的时候,就会使用这个函数。
MyAxis.LabelFormatter = val => val.ToString(“C”); //as currency
 MyAxis.LabelFormatter = val => val + “°”; //as degrees
 MyAxis.LabelFormatter = val => val + “.00 items sold”; //or any other custom format
映射类型
当需要用一个名称映射位置的时候,映射类型会很有用,比如第一个点属于john,第二个属于susan,第三个属于charles。
cartesianChart1.AxisX.Add(new LiveCharts.Wpf.Axis
 {
 Labels = new[]
 {
 “Shea Ferriera”,
 “Maurita Powel”,
 “Scottie Brogdon”,
 “Teresa Kerman”,
 “Nell Venuti”,
 “Anibal Brothers”,
 “Anderson Dillman”
 }
 });
映射类型意味着,轴的值将会用Axis.Labels属性当中的字符串来表示,Axis.Labels类型是IList 所以当轴的值是0的时候,标签使用的就是Labels[0],以此类推。
请注意到轴的值大于Labels的总数的时候,会返回空字符串。
Axis.Labels隐藏了一个Axis.LabelFormatte,因此当Axis.Labels不是null,那么标签将会从Axis.Labels中找,如果Axis.Labels是null,那么Livecharts将会使用格式化器,如果都是null,那么原始值会被返回。
数据标签
当你需要你的series上的每个点都有一个标签的时候,设置Series.DataLabels属性为true即可。如果必要的话,可以自定义数据标签,使用Series.LabelPoint 属性
new ColumnSeries
 {
 Values = new ChartValues>double> { 4, 2, 8, 2, 3, 0, 1 },
 DataLabels = true,
 LabelPoint = point => point.Y + “K”
 }
旋转标签
有时候你的标签长度过长,你就需要权衡一下位置,这时候你就可以旋转标签,可以使用任何角度,甚至是负的角度(反方向旋转)。
cartesianChart1.AxisX.Add(new LiveCharts.Wpf.Axis
 {
 Labels = new[]
 {
 “Shea Ferriera”,
 “Maurita Powel”,
 “Scottie Brogdon”,
 “Teresa Kerman”,
 “Nell Venuti”,
 “Anibal Brothers”,
 “Anderson Dillman”
 },
 LabelsRotation = 13,
 Separator = new Separator // force the separator step to 1, so it always display all labels
 {
 Step = 1, // if you don’t force the separator, it will be calculated automatically, and could skip some labels
 IsEnabled = false //disable it to make it invisible.
 }
 });


 1398
1398

 被折叠的 条评论
为什么被折叠?
被折叠的 条评论
为什么被折叠?
 到【灌水乐园】发言


