


参考链接
安装原文:https://blog.csdn.net/huangli0/article/details/80144544
vue2-leaflet官网
部署瓦片参考地址:https://blog.csdn.net/qq_39430927/article/details/117952511
安装
// npm 安装
npm install leaflet vue2-leaflet --save

// yarn 安装
yarn add leaflet vue2-leaflet
main.js引入css样式
import 'leaflet/dist/leaflet.css';

/* leaflet icon */
delete L.Icon.Default.prototype._getIconUrl;
L.Icon.Default.mergeOptions({
  iconRetinaUrl: require('leaflet/dist/images/marker-icon-2x.png'),
  iconUrl: require('leaflet/dist/images/marker-icon.png'),
  shadowUrl: require('leaflet/dist/images/marker-shadow.png'),
});
demo示例代码
<template>
<div class="vue-leaflet">
<l-map style="width: 100%; height: 600px;" :zoom="zoom" :center="center">
<l-tile-layer :url="url" :attribution="attribution"></l-tile-layer>
<l-marker :lat-lng="marker">
<l-popup :content="text"></l-popup>
</l-marker>
</l-map>
</div>
</template>
<script>
import { LMap, LTileLayer, LMarker, LPopup } from 'vue2-leaflet';
export default {
name: 'VueLeaflet',
components: {
LMap,
LTileLayer,
LMarker,
LPopup
},
data () {
return {
zoom: 13,
center: L.latLng(18.212516, 109.482965),
url: 'http://8.130.161.105:7104/1447870524/{z}/{x}/{y}.png',
attribution: '© <a href="http://osm.org/copyright">OpenStreetMap</a> contributors',
marker: L.latLng(18.212516, 109.482965),
text: 'this is a marker'
}
}
}
</script>
<style scoped>
</style>
使用小技巧
学习方法
首先明确自己需要的组件,然后在vue2-leaflet中找到对应的组件引入到代码中;
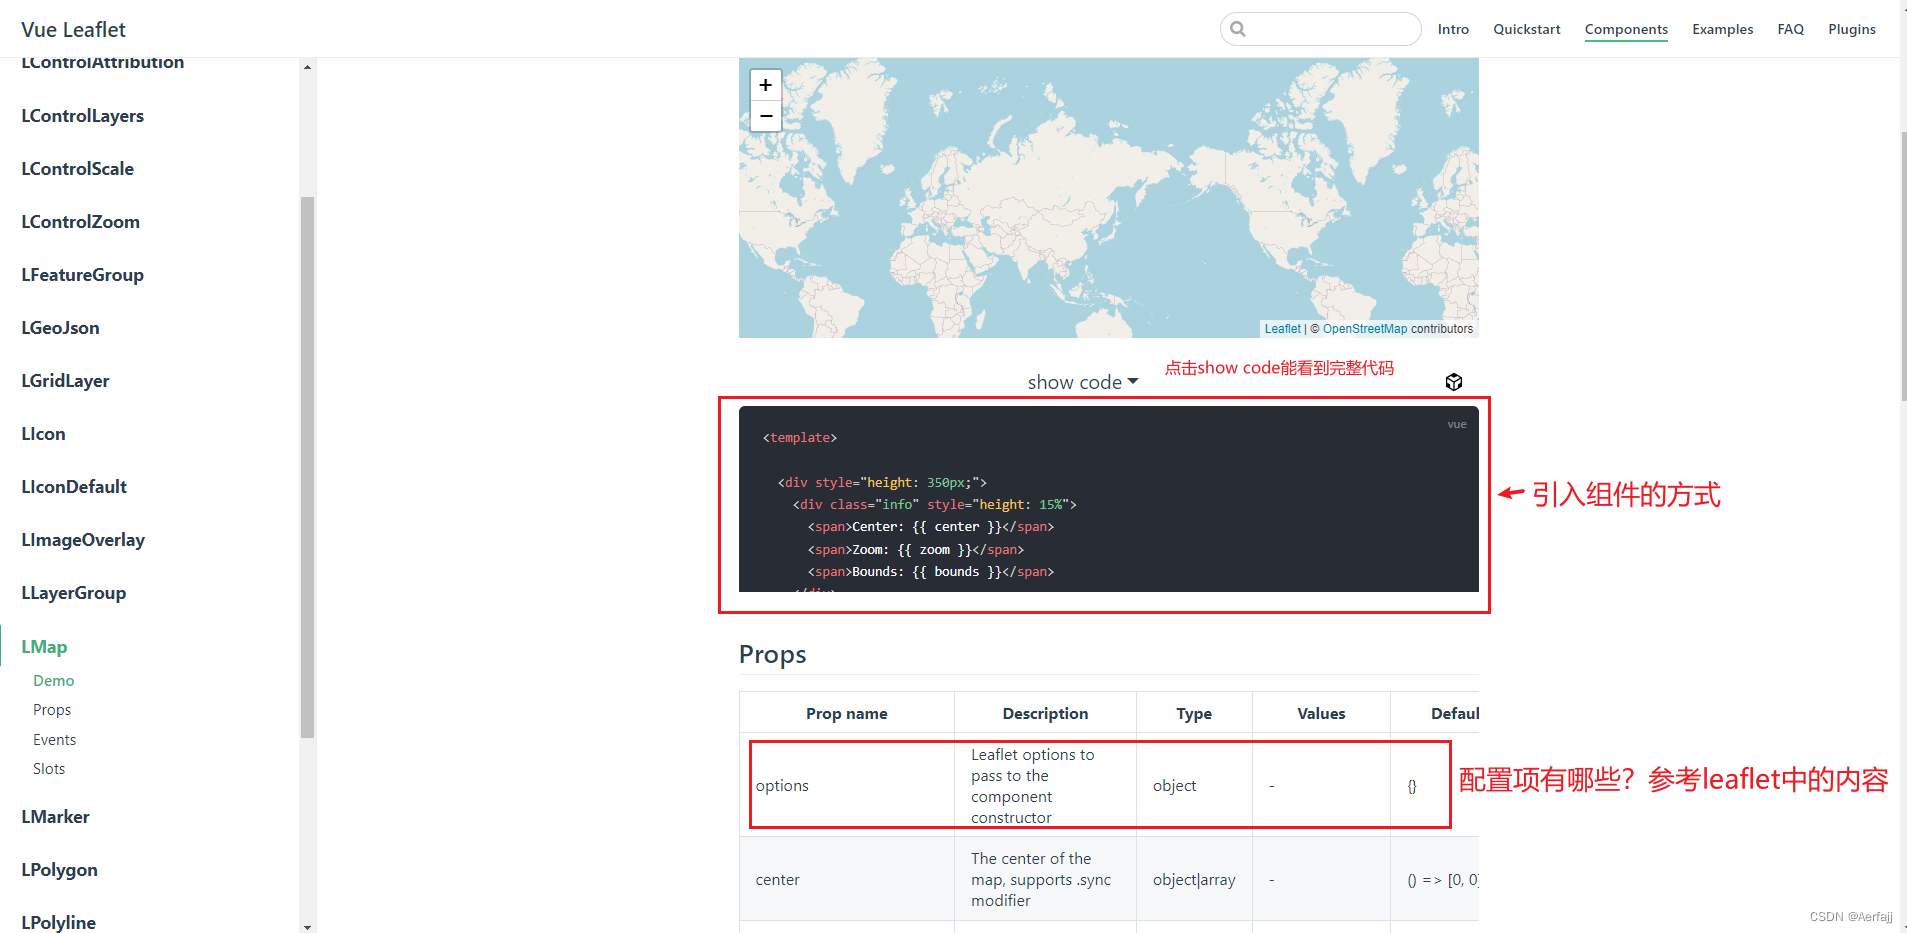
对于组件需要的options等不太明白的属性,参考leaflet中对应的文档说明;
按照leaflet设置组件的值即可。
// 组件

<l-map
	style="width: 100%; height: 800px; z-index: 1;"
	:zoom="zoom"
	:min-zoom="minZoom"
	:max-zoom="maxZoom"
	:center="center"
	:options="options"
	@click="clickMap">
    <l-tile-layer :url="url"></l-tile-layer>
</l-map>

// 配置参数
data() {
	return {
	  options: {
        attributionControl: false, // 设置版权信息不显示
        dragging: false, // 设置禁止拖动
        zoomControl: false // 不显示缩放组件
      },
	}
}
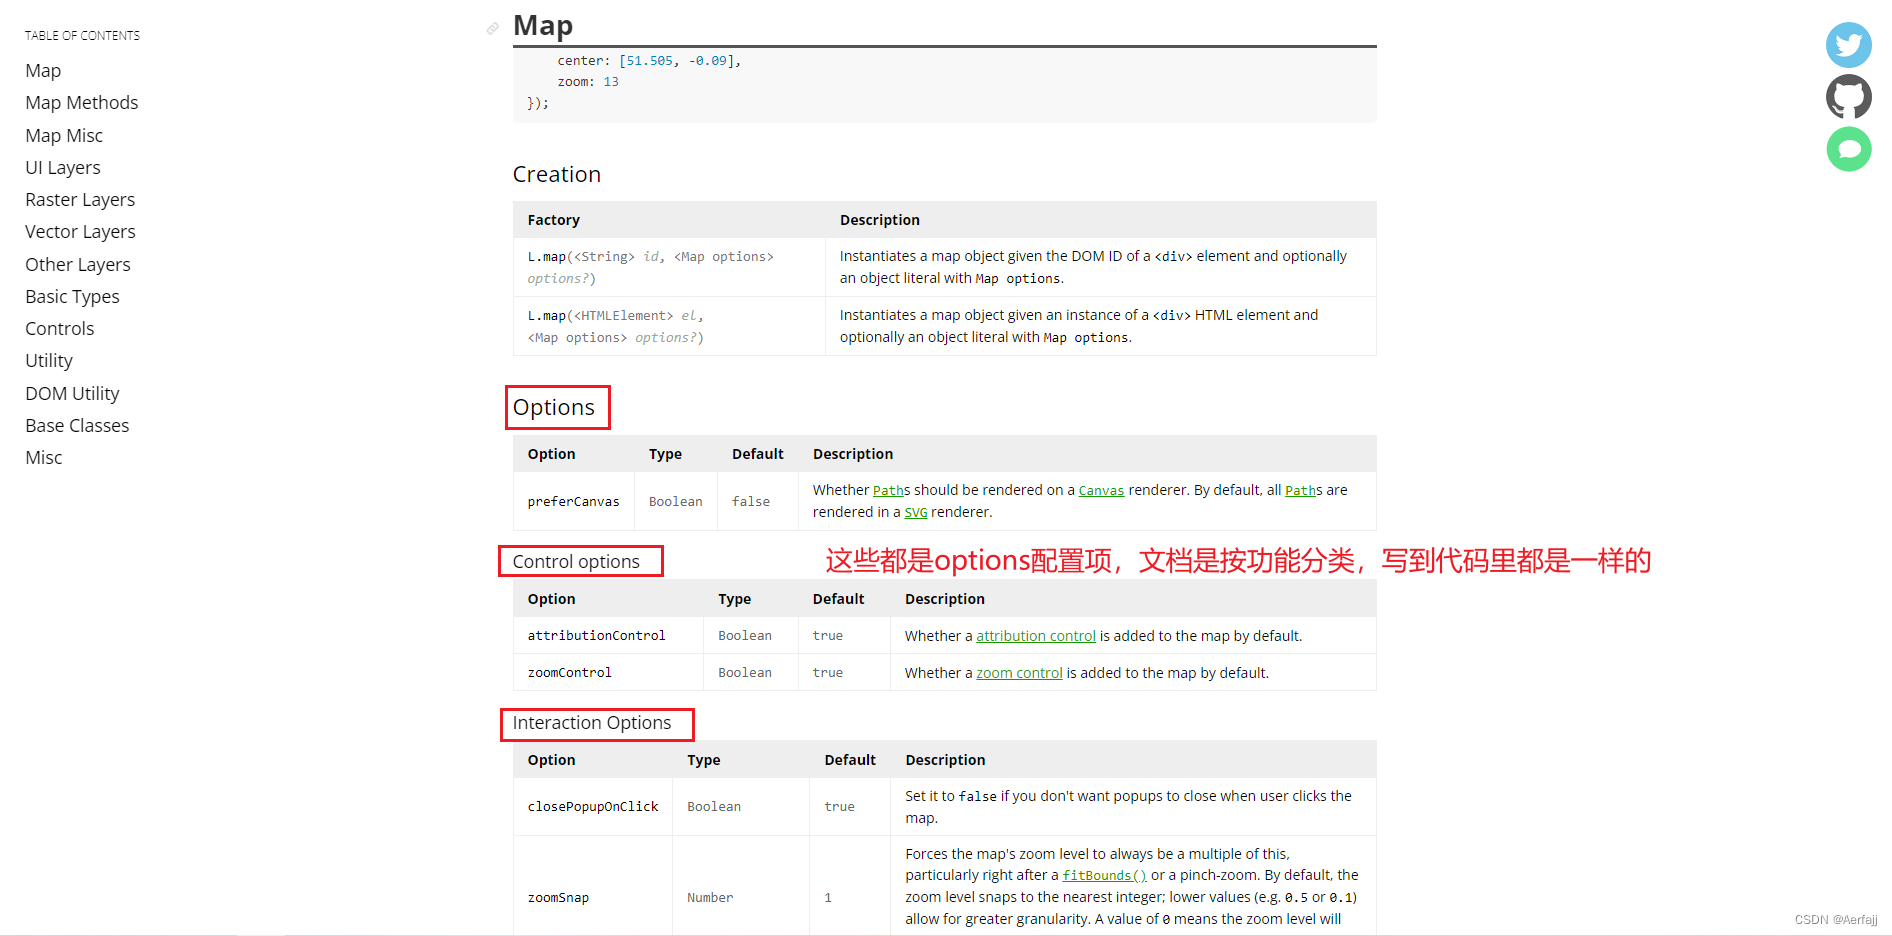
隐藏版权信息
参考地址:
官网:map
vue2-leaflet组件:L-Map
方式一:采用map实例的配置项实现
// 1. 引入地图实例
import L from 'leaflet'

// 2. 设置属性
L.map.attributionControl = false

// 3. 实例(当前是vue项目),设置写在了生命周期函数中
mounted () {
    L.map.attributionControl = false
}
方式二:配置map组件的配置项
// 组件 (options是map的配置项)
<l-map
	style="width: 100%; height: 800px; z-index: 1;"
	:zoom="zoom"
	:min-zoom="minZoom"
	:max-zoom="maxZoom"
	:center="center"
	:options="options"
	@click="clickMap">
    <l-tile-layer :url="url"></l-tile-layer>
</l-map>

// 配置参数
components: {
    LMap
},
data() {
	return {
	  options: {
        attributionControl: false, // 设置版权信息不显示
        dragging: false, // 设置禁止拖动
        zoomControl: false // 不显示缩放组件
      },
	}
}
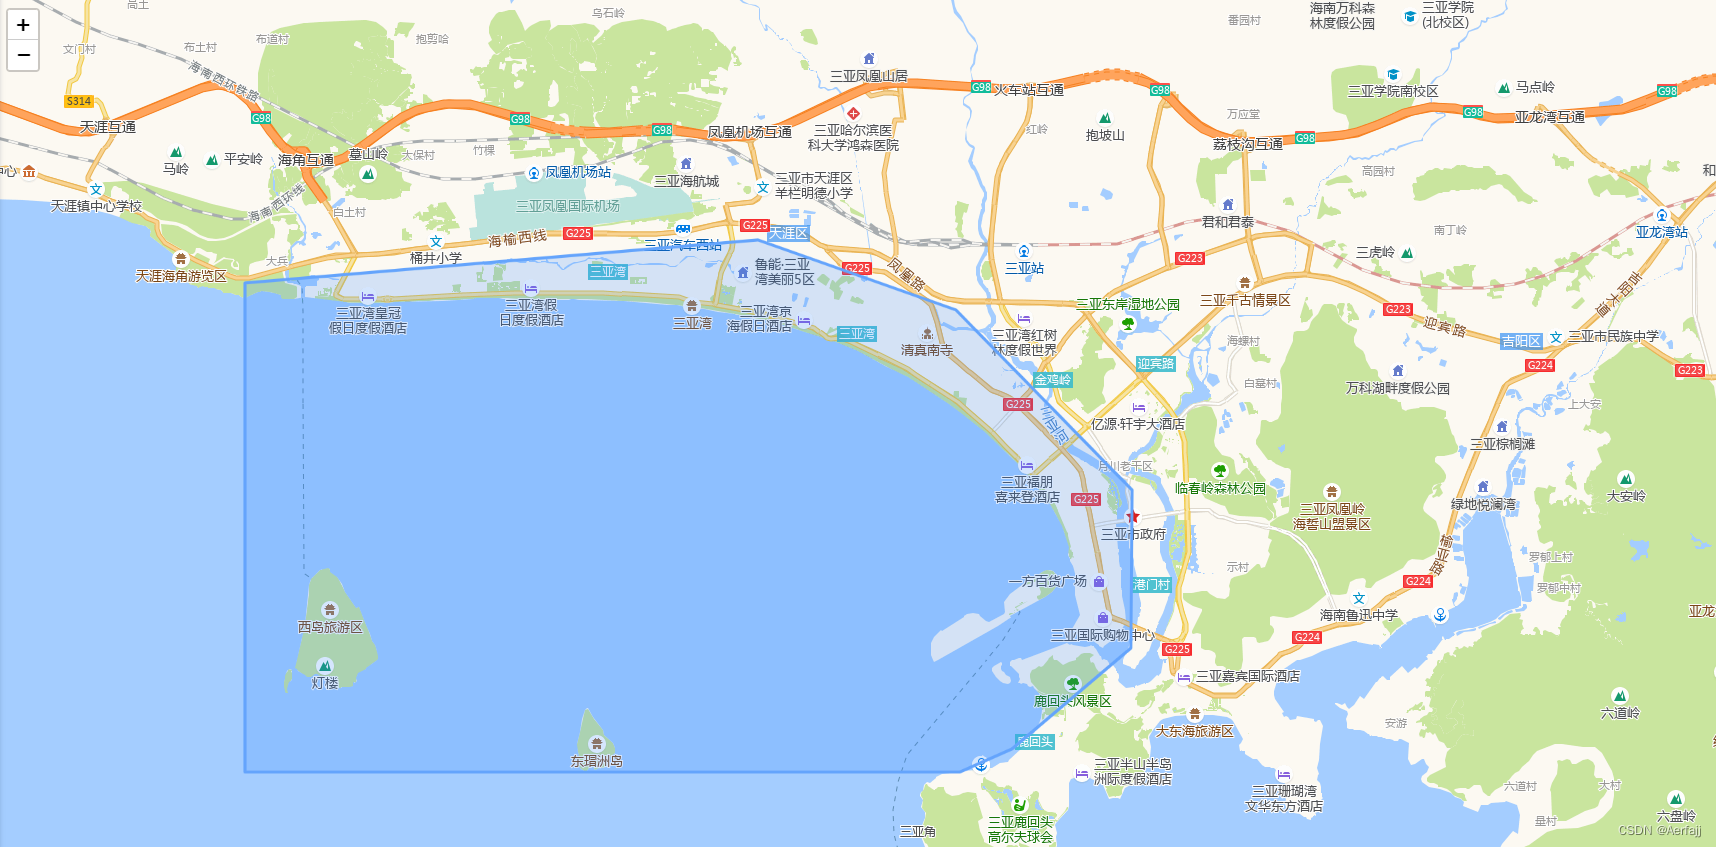
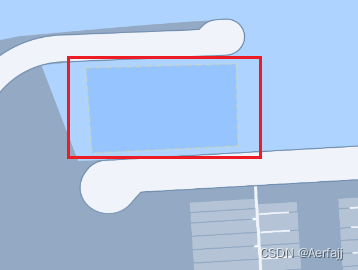
设置多边形区域
官方文档:polygon
vue2-leaflet组件:LPolygon
// 组件
<l-polygon :lat-lngs="polygon.latlngs" :color="polygon.color">
</l-polygon>

// 配置
components: {
	...,
    LPolygon
},
data() {
	return {
		polygon: {
		  // 区域点坐标
	      latlngs: [
	        [18.2142129, 109.4822949],
	        [18.2142332, 109.4830995],
	        [18.2138154, 109.4831103],
	        [18.2137797, 109.4823271]
	      ],
	      color: '#64a4fc', // 设置线条颜色
      },
	}
}
效果图:
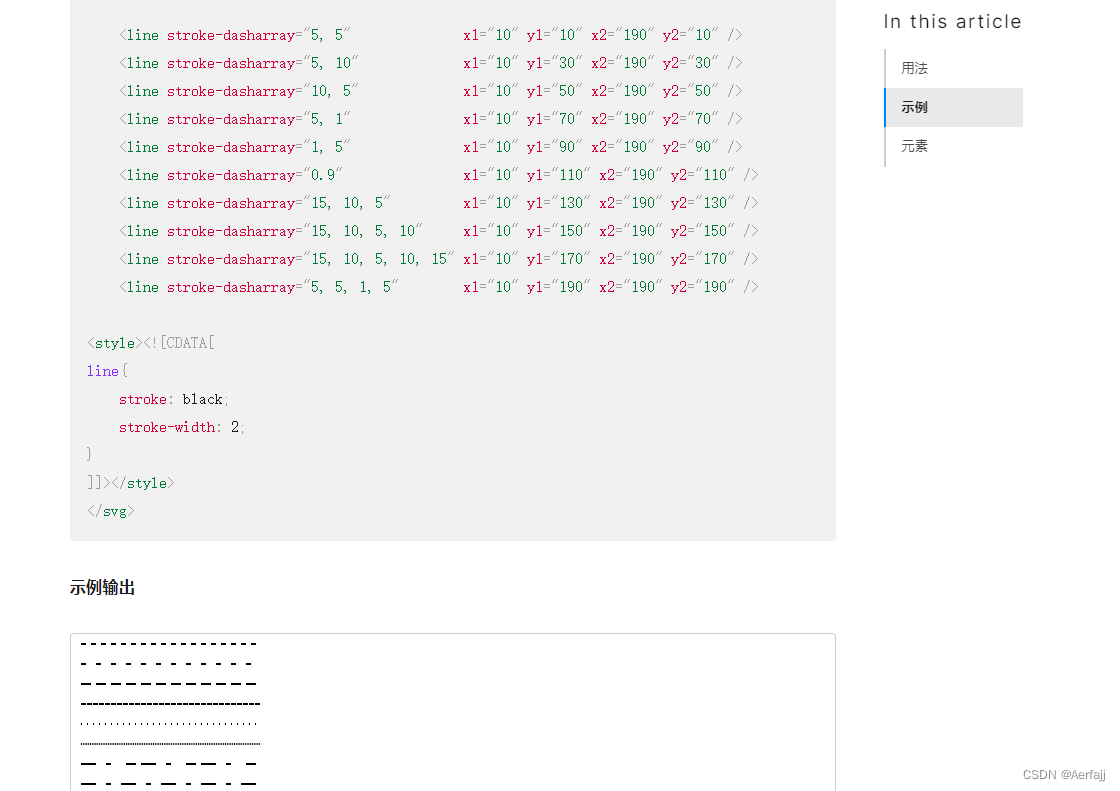
设置虚线
dasharray的设置:dasharray属性值
这里需要注意的是如何设置线条为虚线
dasharray, 它是一个<length>和<percentage>数列,数与数之间用逗号或者空白隔开,指定短划线和缺口的长度。如果提供了奇数个值,则这个值的数列重复一次,从而变成偶数个值。因此,5,3,2等同于5,3,2,5,3,2。
实例中使用:
// 组件
<l-polygon
	:lat-lngs="polygon.latlngs"
	:color="polygon.color"
	:opacity="polygon.opacity"
	:weight="polygon.weight"
	:dashArray="polygon.dashArray"
	>
</l-polygon>

// 配置
polygon: {
	// 多边形的经纬度
   latlngs: [
     [18.2142129, 109.4822949],
     [18.2142332, 109.4830995],
     [18.2138154, 109.4831103],
     [18.2137797, 109.4823271]
   ],

   color: 'rgb(235, 218, 124)', // 线条颜色
   opacity: 0.3, // 线条透明度
   weight: 2, // 线条宽度
   dashArray: "5,5" // 虚线间隔
 },


 2543
2543


 被折叠的 条评论
为什么被折叠?
被折叠的 条评论
为什么被折叠?
 到【灌水乐园】发言


