


Hystrix_Dashboard
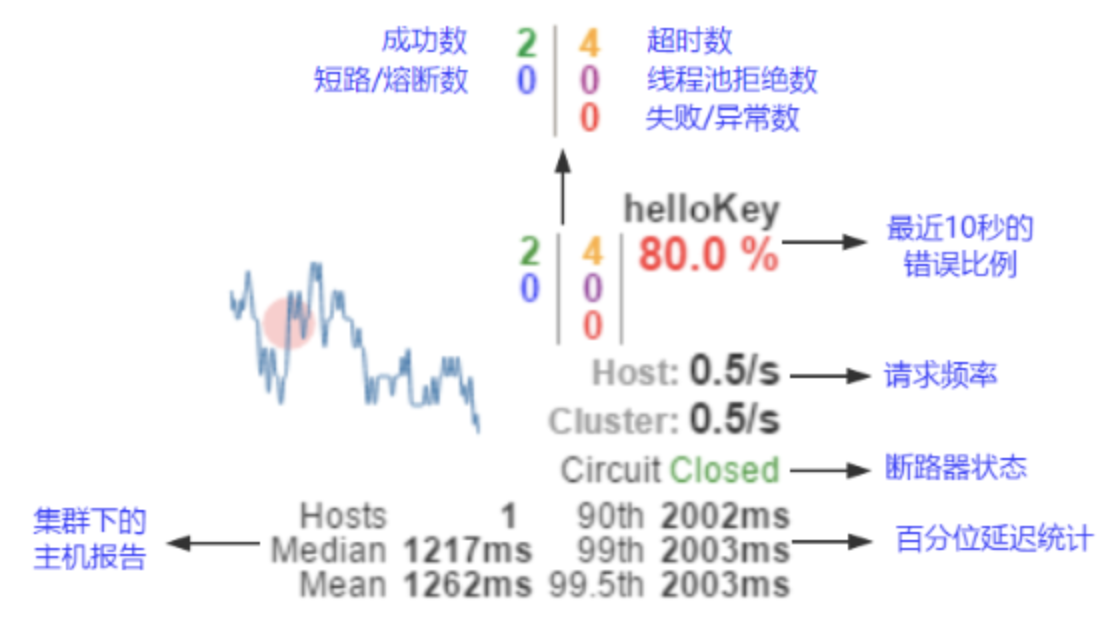
Dashboard 仪表盘,一个服务熔断的实时监控工具,可直观的看到hystrix Command的请求响应,请求成功率
主要操作:
-
一个HystrixDashboard客户端
-
设置端口为9001
-
添加依赖文本
-
hystrix-dashboard
-
<dependency>
			<groupId>org.springframework.cloud</groupId>
			<artifactId>spring-cloud-starter-netflix-hystrix-dashboard</artifactId>
		</dependency>
-
-
在启动类开启服务
- @EnableHystrixDashboard
-
-
被监控的服务端
-
设置端口8001
-
添加依赖文本actuator
-
<dependency> <groupId>org.springframework.boot</groupId> <artifactId>spring-boot-starter-actuator</artifactId> </dependency> -
如果使用的是2.x比较新的版本,需要在hystrix的消费端配置监控,在启动类添加bean
-
@Bean
   public ServletRegistrationBean hystrixMetricsStreamServlet() {
       ServletRegistrationBean registrationBean = new ServletRegistrationBean(new HystrixMetricsStreamServlet());
       registrationBean.addUrlMappings("/actuator/hystrix.stream");//访问该页面就是监控页面
       return registrationBean;
   }
-
-
测试
- 开启界面
- Localhost:9001/hystrix
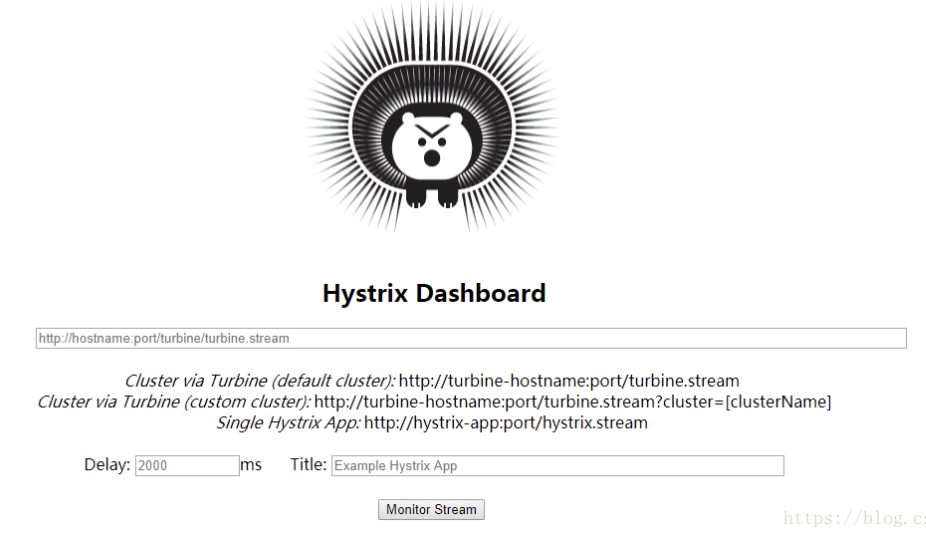
- 有三种不同的监控方式
- 单体Hystrix消费者
- 通过http://hystrix-app:port/hystrix.stream开启,实现对具体某个服务实例的监控
- 默认集群监控
- 通过 http://turbine-hostname:port/turbine.stream开启,实现对默认集群的监控
- 自定集群监控
- http://turbine-hostname:port/turbine.stream?cluster=[clusterName] ,实现对clusterName集群的监控
- 单体Hystrix消费者
- 可以先访问一下provider
- 查看hystrix流
- http://localhost:8001/actuator/hystrix.stream
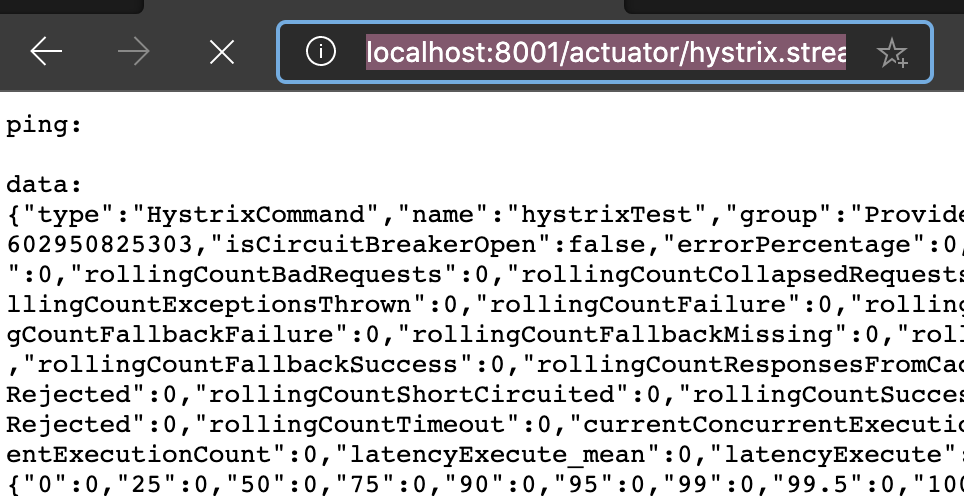
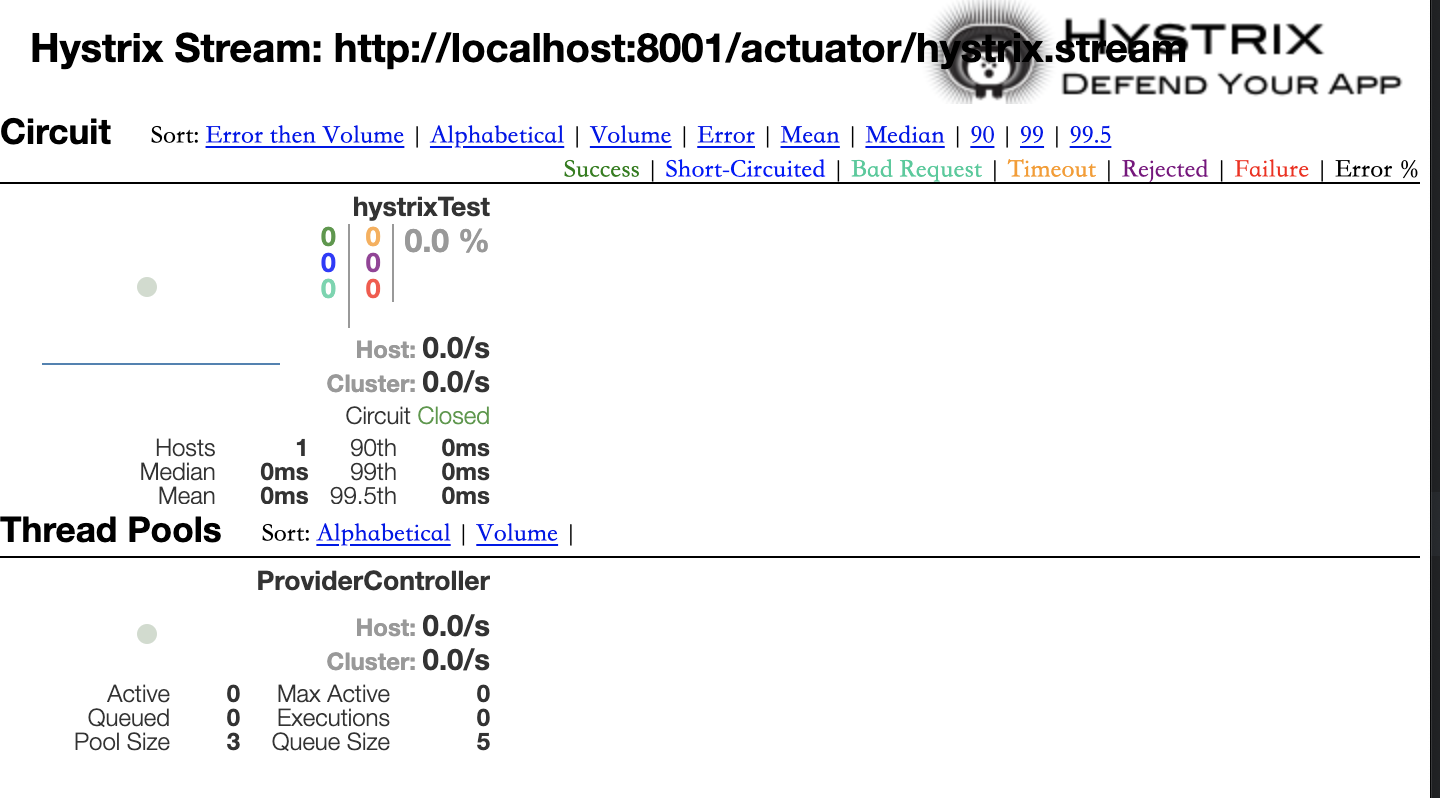
- 把这一段复制过去
- 设置名字就可以监控了
-
-
-
遇到失败,连接失败问题一直没解决
-
解决时间:2020年10月18日 00点15分
-
问题原因,版本选择过高
-
检查版本
-
<parent>
   <groupId>org.springframework.boot</groupId>
   <artifactId>spring-boot-starter-parent</artifactId>
   <version>2.1.17.RELEASE</version>
   <relativePath/> <!-- lookup parent from repository -->
</parent>
<properties>
		<java.version>1.8</java.version>
		<spring-cloud.version>Greenwich.SR6</spring-cloud.version>
	</properties>


 6675
6675


 被折叠的 条评论
为什么被折叠?
被折叠的 条评论
为什么被折叠?
 到【灌水乐园】发言


