


正常搭建完成dashboard,并打开监控页面时
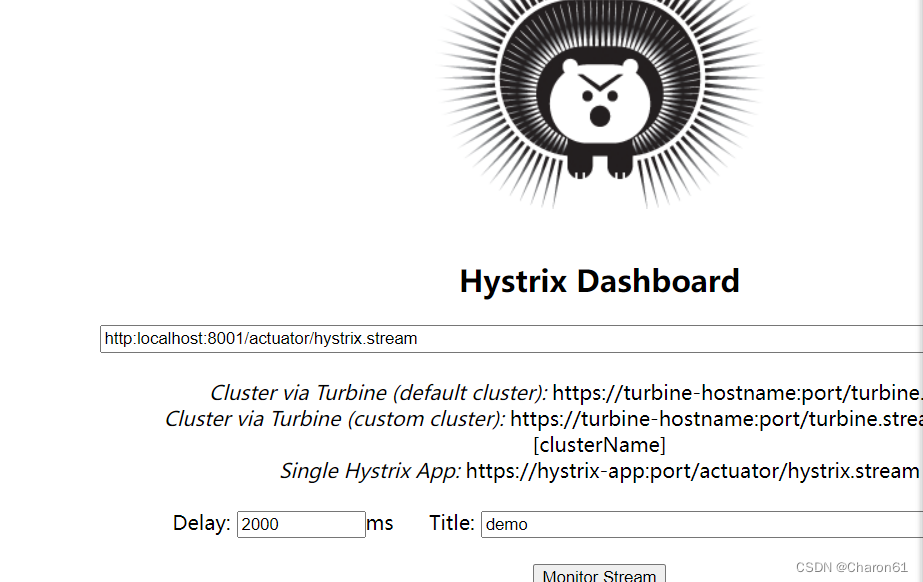
点击monitor stream,结果出现

”Unable to connect to Command Metric Stream. “,一个奇奇怪怪的问题,上网查询资料,发现可能是springcloud默认查询路径有问题,在dashboard项目的yml中添加如下配置

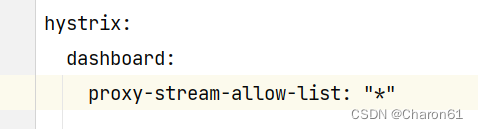
重新部署项目,结果仍旧没解决问题,还是出现”Unable to connect to Command Metric Stream. “
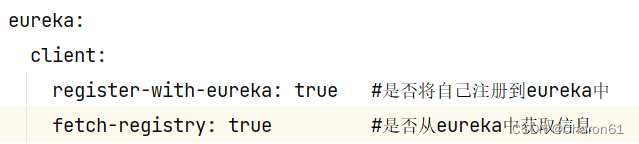
问题,重新查看控制台输出,发现dashboard项目不断报”Cannot execute request on any known server“,该错误是因为没有将该项目注册入注册中心导致,不在同一个注册中心下,dashboard页面无法获取提供者的数据,重新注册入注册中心
查看注册中心里的注册信息,查看dashboard页面是否注册进去:

注册成功,打开dashboard监控页面
问题依然没得到解决,但重新查看dashboard的控制台,发现报了其他的错”Failed opening connection to http://localhost:8001/actuator/hystrix.streamdelay=2000 : 404 : HTTP/1.1 404“
错误地打开链接,上网查资料,发现可能是新版本springcloud需要打开全部的端点监控访问权限
在服务提供者的yml中加入
management:
  endpoints:
    web:
      exposure:
        include: '*'
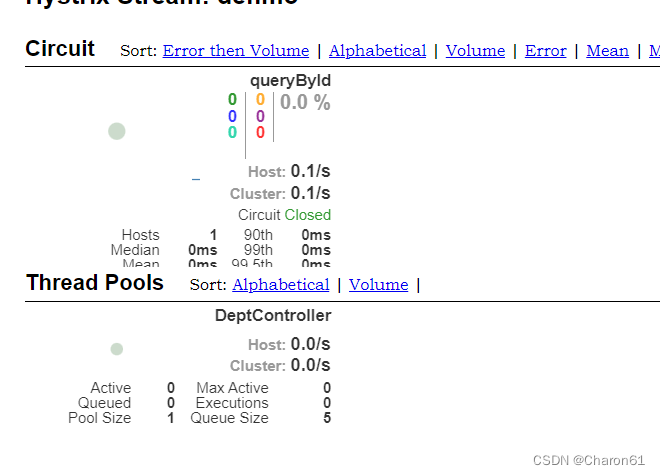
重新部署项目,在网页上打开被熔断器进行熔断的方法
“@HystrixCommand”
成功!


 2699
2699


 被折叠的 条评论
为什么被折叠?
被折叠的 条评论
为什么被折叠?
 到【灌水乐园】发言


