echarts雷达图实现动态扫描效果

最终实现效果图:

在这里插入图片描述
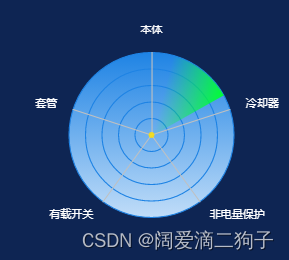
首先画出一个雷达图,然后使用css画出旋转光圈效果定位到雷达图正中心,就实现了该特效。
其中绿色扇形光圈是顺时针转动的。
实现代码如下:

	<div class='right'>
	  <!-- 雷达图 -->
	  <div ref="chart" style="width: 100%; height: 100%" id="chart"></div>
      <!-- 雷达扫描射线 -->
      <div id="radar"></div>
	</div>
  private getRadarChart() {
    const chartDom: any = this.$refs.chart
    this.myChart = echarts.init(chartDom)
    const that = this
    // 监听屏幕变化自动缩放图表
    window.addEventListener('resize', function() {
      that.myChart.resize()
    })
    var option = {
      radar: {
        shape: 'circle', // 设置雷达图形状,值有circle、square,默认为方形
        splitNumber: 5, // 雷达图圈数设置
        indicator: [// 不同的参照条件,可以设定最大值和最小值
          { name: '本体', max: 0 },
          { name: '套管', max: 0 },
          { name: '有载开关', max: 0 },
          { name: '非电量保护', max: 0 },
          { name: '冷却器', max: 0 }
        ],
        axisLine: { // 设置雷达图中间射线的颜色
          lineStyle: {
            color: '#c0c0c0'
          }
        },
        splitArea: { // 设置图表颜色,show的值为true
          show: true,
          areaStyle: {
          // color:"#c1ddf8", //一般设置方式
          // 设置渐变背景色 new echarts.graphic.LinearGradient(a,b,c,d,arr)
          // a ,b,c,d值可为0,1 a:1表示arr中的颜色右到左;c:1 arr中的颜色左到右
          // b:1表示arr中的颜色下到上;d:1表示arr中的颜色上到下
            color: new echarts.graphic.LinearGradient(0, 1, 0, 0, [
              { offset: 0, color: '#c1ddf8' }, // 0% 处的颜色
              { offset: 1, color: '#1e83e4' }// 100% 处的颜色
            ], false)
          }
        },
        splitLine: { // 网格颜色设置
          show: true,
          lineStyle: {
            width: 1,
            color: '#1e83e4'
          }
        },
        name: { // 修改indicator文字的颜色
          textStyle: {
            color: 'white',
            fontSize: 10
          }
        }
      },
      series: [{
        type: 'radar',
        symbol: 'circle', // 单个数值点的样式,还可以取值'rect','angle'等
        symbolSize: 5, // 数值点的大小
        symbolColor: 'red',
        data: [
          {
            value: [this.result.bodyScore, this.result.bushingScore, this.result.oltcscore, this.result.nonElectricQuantityProtectionScore, this.result.coolerScore],
            itemStyle: { // 该数值区域样式设置
              normal: {
                show: false,
                color: 'rgba(255,225,0,.3)', // 背景颜色,还需设置areaStyle
                lineStyle: {
                  color: 'rgba(255,225,0,.8)' // 边框颜色
                }
              }
            },
            label: { // 显示value中具体的数值
              normal: {
                show: true,
                position: 'inside',
                textStyle: { // 更改数值样式
                  color: 'white'
                }
              }
            },
            areaStyle: { // 设置区域背景颜色透明度
              normal: {
                width: 1,
                opacity: 0.8
              }
            },
            lineStyle: {
              normal: {
                width: 0
              }
            }
          }
        ]
      }]
    }
    option && this.myChart.setOption(option)
  }

css代码:

  .right{
    width: 65%;
    height: 200px;
    position: relative;
  }

  #radar:after {
      content: '';
      display: block;
      background-image: linear-gradient(44deg, rgba(0, 255, 51, 0) 50%, #00ff33 100%);
      width: 75px;
      height: 75px;
      position: absolute;
      top: 25px;
      right: 50%;
      animation: radar-beam 15s infinite;
      animation-timing-function: linear;
      transform-origin: bottom right;
      border-radius: 100% 0 0 0;
  }

  @keyframes radar-beam {
      0% {
          transform: rotate(0deg);
      }
      100% {
          transform: rotate(360deg);
      }
  }
  • 4
    点赞
  • 5
    收藏
    觉得还不错? 一键收藏
  • 2
    评论
实现雷达图动态扫描效果,可以使用 echarts 中的动画效果,结合经纬度控制雷达图扫描的起点和终点。 首先,需要定义一个雷达图的模板,包含需要展示的维度和初始数据。例如: ```javascript option = { radar: { indicator: [ { name: '维度1', max: 100 }, { name: '维度2', max: 100 }, { name: '维度3', max: 100 }, { name: '维度4', max: 100 }, { name: '维度5', max: 100 } ], center: ['50%', '50%'], radius: '60%', startAngle: 90, splitNumber: 4, shape: 'circle', name: { formatter: '{value}', textStyle: { color: '#fff', backgroundColor: '#999', borderRadius: 3, padding: [3, 5] } }, splitArea: { areaStyle: { color: ['rgba(114, 172, 209, 0.2)', 'rgba(114, 172, 209, 0.4)', 'rgba(114, 172, 209, 0.6)', 'rgba(114, 172, 209, 0.8)', 'rgba(114, 172, 209, 1)'], shadowColor: 'rgba(0, 0, 0, 0.3)', shadowBlur: 10 } }, axisLine: { lineStyle: { color: 'rgba(255, 255, 255, 0.5)' } }, splitLine: { lineStyle: { color: 'rgba(255, 255, 255, 0.5)' } } }, series: [ { name: '雷达图', type: 'radar', data: [ { value: [60, 73, 85, 40, 90], name: '数据1', areaStyle: { normal: { opacity: 0.9, color: new echarts.graphic.RadialGradient(0.5, 0.5, 1, [ { color: '#B8D3E4', offset: 0 }, { color: '#72ACD1', offset: 1 } ]) } }, lineStyle: { normal: { width: 1, opacity: 0.5, color: '#B8D3E4' } } } ] } ] }; ``` 然后,可以通过 echarts 提供的动画效果实现雷达图扫描。具体实现方式如下: ```javascript var myChart = echarts.init(document.getElementById('chart')); // 设置雷达图的起点和终点经纬度 var startPoint = [120.1293, 30.2581]; var endPoint = [116.4551, 40.2539]; // 定义一个动画函数,每隔一段时间更新雷达图的起点和终点,实现扫描效果 function animation() { // 计算当前扫描位置的经纬度 var currentPoint = [ startPoint[0] + (endPoint[0] - startPoint[0]) / 10, startPoint[1] + (endPoint[1] - startPoint[1]) / 10 ]; // 更新雷达图的起点和终点 myChart.setOption({ series: [ { data: [ { value: [60, 73, 85, 40, 90], name: '数据1', areaStyle: { normal: { opacity: 0.9, color: new echarts.graphic.RadialGradient(0.5, 0.5, 1, [ { color: '#B8D3E4', offset: 0 }, { color: '#72ACD1', offset: 1 } ]) } }, lineStyle: { normal: { width: 1, opacity: 0.5, color: '#B8D3E4' } } } ], // 设置雷达图扫描的起点和终点 markPoint: { symbol: 'circle', symbolSize: 5, itemStyle: { normal: { color: '#FFF' } }, label: { normal: { show: false }, emphasis: { show: false } }, data: [ { coord: currentPoint, name: '扫描点' } ] }, // 设置动画效果 animationDurationUpdate: 2000, animationEasingUpdate: 'linear' } ] }); // 每隔一段时间执行一次动画函数 setTimeout(animation, 200); } // 执行动画函数 animation(); ``` 在动画函数中,计算当前扫描位置的经纬度,并通过 setOption 方法更新雷达图的起点和终点。在每次更新雷达图时,都设置一个扫描点的 markPoint,表示当前扫描位置。同时,设置动画效果,让扫描点在雷达图上平滑移动。最后,通过 setTimeout 方法每隔一段时间执行一次动画函数,实现连续的扫描效果

“相关推荐”对你有帮助么?

  • 非常没帮助
  • 没帮助
  • 一般
  • 有帮助
  • 非常有帮助
提交
评论 2
添加红包

请填写红包祝福语或标题

红包个数最小为10个

红包金额最低5元

当前余额3.43前往充值 >
需支付:10.00
成就一亿技术人!
领取后你会自动成为博主和红包主的粉丝 规则
hope_wisdom
发出的红包
实付
使用余额支付
点击重新获取
扫码支付
钱包余额 0

抵扣说明:

1.余额是钱包充值的虚拟货币,按照1:1的比例进行支付金额的抵扣。
2.余额无法直接购买下载,可以购买VIP、付费专栏及课程。

余额充值