


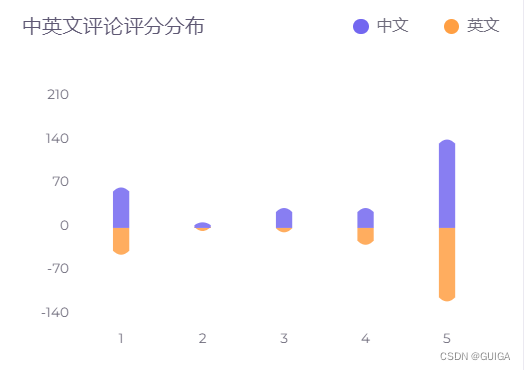
ApexCharts不能动态更新图表
解决方法:
使用updateSeries更新
        <!-- chart -->
        <vue-apex-charts
          id="revenue-report-chart"
          type="bar"
          ref="chart1"
          height="230"
          :options="revenueReport.chartOptions"
          :series="revenueReport.series"

        />
import VueApexCharts from 'vue-apexcharts'
export default {
  components: {
    VueApexCharts,
    BRow,
    BCol,
  },
  directives: {
    Ripple,
  },
  props: {
    data: {
      type: Object,
      default: () => {},
    },
  },
  data() {
    return {
      revenueReport: {
        series: [
          {
            name: '中文',
            data: [],
          },
          {
            name: '英文',
            data: [],
          },
        ],
        chartOptions: {
          chart: {
            stacked: true,
            type: 'bar',
            toolbar: { show: false },
          },
          grid: {
            padding: {
              top: -20,
              bottom: -10,
            },
            yaxis: {
              lines: { show: false },
            },
          },
          xaxis: {
            categories: ['1', '2', '3', '4', '5'],
            labels: {
              style: {
                colors: '#6E6B7B',
                fontSize: '0.86rem',
                fontFamily: 'Montserrat',
              },
            },
            axisTicks: {
              show: false,
            },
            axisBorder: {
              show: false,
            },
          },
          legend: {
            show: false,
          },
          dataLabels: {
            enabled: false,
          },
          colors: [$themeColors.primary, $themeColors.warning],
          plotOptions: {
            bar: {
              columnWidth: '20%',
              endingShape: 'rounded',
            },
            distributed: true,
          },
          yaxis: {
            labels: {
              style: {
                colors: '#6E6B7B',
                fontSize: '0.86rem',
                fontFamily: 'Montserrat',
              },
            },
          },
        },
      },
      // budget chart
      budgetChart: {
        options: {
          chart: {
            height: 80,
            toolbar: { show: false },
            zoom: { enabled: false },
            type: 'line',
            sparkline: { enabled: true },
          },
          stroke: {
            curve: 'smooth',
            dashArray: [0, 5],
            width: [2],
          },
          colors: [$themeColors.primary, '#dcdae3'],
          tooltip: {
            enabled: false,
          },
        },
      },
    }
  },
  methods: {
    getData(){
       this.$http.get(`${endpoint}/getReview/`+this.data)
      .then(response=>{
        const res = response.data;
        var zh =JSON.parse(JSON.stringify(res['zh']));
        var en=JSON.parse(JSON.stringify(res['en']));

        this.$refs.chart1.updateSeries([{
                        name: 'Sales',
                        data: zh
                    },
                    {
                        name: 'Sales',
                        data: en
                    }])

      })

    }
  },
  mounted(){
    this.getData()
  }
可以在获取数据后正常更新


 648
648


 被折叠的 条评论
为什么被折叠?
被折叠的 条评论
为什么被折叠?
 到【灌水乐园】发言


