


0、起因
网上能够搜索的到的资源,都没办法支持Matlab在柱状图里填充线条或者没办法很好的为填充线条的柱状图添加图例,经过研究我发现了一种可以完美填充柱状图的方法
1、导入函数
首先需要引入三个matlab的函数
hatchfill2.m函数
function H = hatchfill2(A,varargin)
% HATCHFILL2 Hatching and speckling of patch objects
%   HATCHFILL2(A) fills the patch(es) with handle(s) A. A can be a vector
%   of handles or a single handle. If A is a vector, then all objects of A
%   should be part of the same group for predictable results. The hatch
%   consists of black lines angled at 45 degrees at 40 hatching lines over
%   the axis span with no color filling between the lines.
%
%   A can be handles of patch or hggroup containing patch objects for
%   Pre-R2014b release. For HG2 releases, 'bar' and 'contour' objects are
%   also supported.
%
%   Hatching line object is actively formatted. If A, axes, or figure size
%   is modified, the hatching line object will be updated accordingly to
%   maintain the specified style.
%
%   HATCHFILL2(A,STYL) applies STYL pattern with default paramters. STYL
%   options are:
%      'single'     single lines (the default)
%      'cross'      double-crossed hatch
%      'speckle'    speckling inside the patch boundary
%      'outspeckle' speckling outside the boundary
%      'fill'       no hatching
%
%   HATCHFILL2(A,STYL,Option1Name,Option1Value,...) to customize the
%   hatching pattern
%
%       Name       Description
%      --------------------------------------------------------------------
%      HatchStyle       Hatching pattern (same effect as STYL argument)
%      HatchAngle       Angle of hatch lines in degrees (45)
%      HatchDensity     Number of hatch lines between axis limits
%      HatchOffset      Offset hatch lines in pixels (0)
%      HatchColor       Color of the hatch lines, 'auto' sets it to the
%                       EdgeColor of A
%      HatchLineStyle   Hatch line style
%      HatchLineWidth   Hatch line width
%      SpeckleWidth         Width of speckling region in pixels (7)
%      SpeckleDensity       Density of speckle points (1)
%      SpeckleMarkerStyle   Speckle marker style
%      SpeckleFillColor     Speckle fill color
%      HatchVisible     [{'auto'}|'on'|'off'] sets visibility of the hatch
%                       lines. If 'auto', Visibile option is synced to
%                       underlying patch object
%      HatchSpacing     (Deprecated) Spacing of hatch lines (5)
%
%   In addition, name/value pairs of any properties of A can be specified
%
%   H = HATCHFILL2(...) returns handles to the line objects comprising the
%   hatch/speckle.
%
%   Examples:
%       Gray region with hatching:
%       hh = hatchfill2(a,'cross','HatchAngle',45,'HatchSpacing',5,'FaceColor',[0.5 0.5 0.5]);
%
%       Speckled region:
%       hatchfill2(a,'speckle','HatchAngle',7,'HatchSpacing',1);

% Copyright 2015-2018 Takeshi Ikuma
% History:
% rev. 7 : (01-10-2018)
%   * Added support for 3D faces
%   * Removed HatchSpacing option
%   * Added HatchDensity option
%   * Hatching is no longer defined w.r.t. pixels. HatchDensity is defined
%     as the number of hatch lines across an axis limit. As a result,
%     HatchAngle no longer is the actual hatch angle though it should be
%     close.
%   * [known bug] Speckle hatching style is not working
% rev. 6 : (07-17-2016)
%   * Fixed contours object hatching behavior, introduced in rev.5
%   * Added ContourStyle option to enable fast drawing if contour is convex
% rev. 5 : (05-12-2016)
%   * Fixed Contour with NaN data point disappearnace issue
%   * Improved contours object support
% rev. 4 : (11-18-2015)
%   * Worked around the issue with HG2 contours with Fill='off'.
%   * Removed nagging warning "UseHG2 will be removed..." in R2015b
% rev. 3 : (10-29-2015)
%   * Added support for HG2 AREA
%   * Fixed for HatchColor 'auto' error when HG2 EdgeColor is 'flat'
%   * Fixed listener creation error
% rev. 2 : (10-24-2015)
%   * Added New option: HatchVisible, SpeckleDensity, SpeckleWidth
%     (SpeckleDensity and SpeckleWidtha are separated from HatchSpacing and
%     HatchAngle, respectively)
% rev. 1 : (10-20-2015)
%   * Fixed HG2 contour data extraction bug (was using wrong hidden data)
%   * Fixed HG2 contour color extraction bug
%   * A few cosmetic changes here and there
% rev. - : (10-19-2015) original release
%   * This work is based on Neil Tandon's hatchfill submission
%     (http://www.mathworks.com/matlabcentral/fileexchange/30733)
%     and borrowed code therein from R. Pawlowicz, K. Pankratov, and
%     Iram Weinstein.

narginchk(1,inf);
[A,opts,props] = parse_input(A,varargin);

drawnow % make sure the base objects are already drawn

if verLessThan('matlab','8.4')
   H = cell(1,numel(A));
else
   H = repmat({matlab.graphics.GraphicsPlaceholder},1,numel(A));
end
for n = 1:numel(A)
   H{n} = newhatch(A(n),opts,props);

   % if legend of A(n) is shown, add hatching to it as well
   %    leg = handle(legend(ancestor(A,'axes')));
   %    hsrc = [leg.EntryContainer.Children.Object];
   %    hlc = leg.EntryContainer.Children(find(hsrc==A(n),1));
   %    if ~isempty(hlc)
   %       hlc = hlc.Children(1); % LegendIcon object
   %       get(hlc.Children(1))
   %    end
end

if nargout==0
   clear H
else
   H = [H{:}];
   if numel(H)==numel(A)
      H = reshape(H,size(A));
   else
      H = H(:);
   end
end

end

function H = newhatch(A,opts,props)

% 0. retrieve pixel-data conversion parameters
% 1. retrieve face & vertex matrices from A
% 2. convert vertex matrix from data to pixels units
% 3. get xdata & ydata of hatching lines for each face
% 4. concatenate lines sandwitching nan's in between
% 5. convert xdata & ydata back to data units
% 6. plot the hatching line

% traverse if hggroup/hgtransform
if ishghandle(A,'hggroup')
   if verLessThan('matlab','8.4')
      H = cell(1,numel(A));
   else
      H = repmat({matlab.graphics.GraphicsPlaceholder},1,numel(A));
   end

   for n = 1:numel(A.Children)
      try
         H{n} = newhatch(A.Children(n),opts,props);
      catch
      end
   end

   H = [H{:}];
   return;
end

% Modify the base object property if given
if ~isempty(props)
   pvalold = sethgprops(A,props);
end

try
   vislisena = strcmp(opts.HatchVisible,'auto');
   if vislisena
      vis = A.Visible;
   else
      vis = opts.HatchVisible;
   end

   redraw = strcmp(A.Visible,'off') && ~vislisena;
   if redraw
      A.Visible = 'on'; % momentarily make the patch visible
      drawnow;
   end

   % get the base object's vertices & faces
   [V,F,FillFcns] = gethgdata(A); % object does not have its patch data ready

   if redraw
      A.Visible = 'off'; % momentarily make the patch visible
   end

   if ~isempty(FillFcns)
      FillFcns{1}();
      drawnow;
      [V,F] = gethgdata(A); % object does not have its patch data ready
      FillFcns{2}();
      drawnow;
   end

   % recompute hatch line data
   [X,Y,Z] = computeHatchData(handle(ancestor(A,'axes')),V,F,opts);

   % 6. plot the hatching line
   commonprops = {'Parent',A.Parent,'DisplayName',A.DisplayName,'Visible',vis};
   if ~strcmp(opts.HatchColor,'auto')
      commonprops = [commonprops {'Color',opts.HatchColor,'MarkerFaceColor',opts.HatchColor}];
   end
   if isempty(regexp(opts.HatchStyle,'speckle$','once'))
      H = line(X,Y,Z,commonprops{:},'LineStyle',opts.HatchLineStyle','LineWidth',opts.HatchLineWidth);
   else
      H = line(X,Y,Z,commonprops{:},'LineStyle','none','Marker',opts.SpeckleMarkerStyle,...
         'MarkerSize',opts.SpeckleSize,'Parent',A.Parent,'DisplayName',A.DisplayName);
   end

   if strcmp(opts.HatchColor,'auto')
      syncColor(H,A);
   end

   if isempty(H)
      error('Unable to obtain hatching data from the specified object A.');
   end

   % 7. Move H so that it is place right above A in parent's uistack
   p = handle(A.Parent);
   Hcs = handle(p.Children);
   [~,idx] = ismember(A,Hcs); % always idx(1)>idx(2) as H was just created
   p.Children = p.Children([2:idx-1 1 idx:end]);

   % if HG1, all done | no dynamic adjustment support
   if verLessThan('matlab','8.4')
      return;
   end

   % save the config data & set up the object listeners
   setappdata(A,'HatchFill2Opts',opts); % hatching options
   setappdata(A,'HatchFill2Obj',H); % hatching line object
   setappdata(A,'HatchFill2LastData',{V,F}); % last patch data
   setappdata(A,'HatchFill2LastVisible',A.Visible); % last sensitive properties
   setappdata(A,'HatchFill2PostMarkedClean',{}); % run this function at the end of the MarkClean callback and set NoAction flag
   setappdata(A,'HatchFill2NoAction',false); % no action during next MarkClean callback, callback only clears this flag
   setappdata(H,'HatchFill2MatchVisible',vislisena);
   setappdata(H,'HatchFill2MatchColor',strcmp(opts.HatchColor,'auto'));
   setappdata(H,'HatchFill2Patch',A); % base object

   %%%%%%%%%%%%%%%%%%%%%%%%%%%%%%%%%%%%%%%%%%%%%%%%%%%%%%%%%%%%%%%%%%%%%%%%
   % Create listeners for active formatting

   addlistener(H,'ObjectBeingDestroyed',@hatchBeingDeleted);

   lis = [
      addlistener(A,'Reparent',@objReparent)
      addlistener(A,'ObjectBeingDestroyed',@objBeingDeleted);
      addlistener(A,'MarkedClean',@objMarkedClean)
      addlistener(A,'LegendEntryDirty',@(h,evt)[])]; % <- study this later

   syncprops = {'Clipping','HitTest','Interruptible','BusyAction','UIContextMenu'};
   syncprops(~cellfun(@(p)isprop(A,p),syncprops)) = [];
   for n = 1:numel(syncprops)
      lis(n+2) = addlistener(A,syncprops{n},'PostSet',@syncProperty);
   end

catch ME
   % something went wrong, restore the base object properties
   if ~isempty(props)
      for pname = fieldnames(pvalold)'
         name = pname{1};
         val = pvalold.(name);
         if iscell(val)
            pvalold.(name){1}.(name) = pvalold.(name){2};
         else
            A.(name) = pvalold.(name);
         end
      end
   end
   ME.rethrow();
end

end

%%%%%%%%%% EVENT CALLBACK FUNCTIONS %%%%%%%%%%%%
% Base Object's listeners
% objReparent - also move the hatch object
% ObjectingBeingDestroyed - also destroy the hatch object
% MarkedClean - match color if HatchColor = 'auto'
%             - check if vertex & face changed; if so redraw hatch
%             - check if hatch redraw triggered the event due to object's
%               face not shown; if so clear the flag

function objMarkedClean(hp,~)
% CALLBACK for base object's MarkedClean event
% check: visibility change, hatching area change, & color change

if getappdata(hp,'HatchFill2NoAction')
   setappdata(A,'HatchFill2NoAction',false);
   return;
end

% get the main patch object (loops if hggroup or HG2 objects)
H = getappdata(hp,'HatchFill2Obj');

rehatch = ~strcmp(hp.Visible,getappdata(hp,'HatchFill2LastVisible'));
if rehatch % if visibility changed
   setappdata(hp,'HatchFill2LastVisible',hp.Visible);
   if strcmp(hp.Visible,'off') % if made hidden, hide hatching as well
      if getappdata(H,'HatchFill2MatchVisible')
         H.Visible = 'off';
         return; % nothing else to do
      end
   end
end

% get the patch data
[V,F,FillFcns] = gethgdata(hp);
if ~isempty(FillFcns) % patch does not exist, must momentarily generate it
   FillFcns{1}();
   setappdata(A,'HatchFill2PostMarkedClean',FillFcns{2});
   return;
end
if ~rehatch % if visible already 'on', check for the change in object data
   VFlast = getappdata(hp,'HatchFill2LastData');
   rehatch = ~isequaln(F,VFlast{2}) || ~isequaln(V,VFlast{1});
end

% rehatch if patch data/visibility changed
if rehatch
   % recompute hatch line data
   [X,Y,Z] = computeHatchData(ancestor(H,'axes'),V,F,getappdata(hp,'HatchFill2Opts'));

   % update the hatching line data
   set(H,'XData',X,'YData',Y,'ZData',Z);

   % save patch data
   setappdata(hp,'HatchFill2LastData',{V,F});
end

% sync the color
syncColor(H,hp);

% run post callback if specified (expect it to trigger another MarkedClean
% event immediately)
fcn = getappdata(hp,'HatchFill2PostMarkedClean');
if ~isempty(fcn)
   setappdata(hp,'HatchFill2PostMarkedClean',function_handle.empty);
   setappdata(hp,'HatchFill2NoAction',true);
   fcn();
   return;
end

end

function syncProperty(~,evt)
% sync Visible property to the patch object
hp = handle(evt.AffectedObject); % patch object
hh = getappdata(hp,'HatchFill2Obj');
hh.(evt.Source.Name) = hp.(evt.Source.Name);
end

function objReparent(hp,evt)
%objReparent event listener callback

pnew = evt.NewValue;
if isempty(pnew)
   return; % no change?
end

% move the hatch line object over as well
H = getappdata(hp,'HatchFill2Obj');
H.Parent = pnew;

% make sure to move the hatch line object right above the patch object
Hcs = handle(pnew.Children);
[~,idx] = ismember(hp,Hcs); % always idx(1)>idx(2) as H was just moved
pnew.Children = pnew.Children([2:idx-1 1 idx:end]);

end

function objBeingDeleted(hp,~)
%when base object is deleted

if isappdata(hp,'HatchFill2Obj')
   H = getappdata(hp,'HatchFill2Obj');
   try % in case H is already deleted
   delete(H);
   catch
   end
end

end

function hatchBeingDeleted(hh,~)
%when hatch line object (hh) is deleted

if isappdata(hh,'HatchFill2Patch')

   %   remove listeners listening to the patch object
   hp = getappdata(hh,'HatchFill2Patch');

   if isappdata(hp,'HatchFill2Listeners')
      delete(getappdata(hp,'HatchFill2Listeners'));
      rmappdata(hp,'HatchFill2Listeners');
   end
end

end

%%%%%%%%%%%%%%%%%%%%%%%%%%%%%%%%%%%%%%%%%%

function varargout = computeHatchData(ax,V,F,opts)

varargout = cell(1,nargout);

if isempty(V) % if patch shown
   return;
end

N = size(F,1);
XYZc = cell(2,N);
for n = 1:N % for each face

   % 2. get xdata & ydata of the vertices of the face in transformed bases
   f = F(n,:); % get indices to the vertices of the face
   f(isnan(f)) = [];

   [v,T,islog] = transform_data(ax,V(f,:),[]); % transform the face
   if isempty(v) % face is not hatchable
      continue;
   end

   % 2. get xdata & ydata of hatching lines for each face
   if any(strcmp(opts.HatchStyle,{'speckle','outsidespeckle'}))
      xy = hatch_xy(v.',opts.HatchStyle,opts.SpeckleWidth,opts.SpeckleDensity,opts.HatchOffset);
   else
      xy = hatch_xy(v.',opts.HatchStyle,opts.HatchAngle,opts.HatchDensity,opts.HatchOffset);
   end

   % 3. revert the bases back to 3D Eucledian space
   XYZc{1,n} = revert_data(xy',T,islog).';
end

% 4. concatenate hatch lines across faces sandwitching nan's in between
[XYZc{2,:}] = deal(nan(3,1));
XYZ = cat(2,XYZc{:});

% 5. convert xdata & ydata back to data units
[varargout{1:3}] = deal(XYZ(1,:),XYZ(2,:),XYZ(3,:));

end

function tf = issupported(hbase)
% check if all of the given base objects are supported

supported_objtypes = {'patch','hggroup','bar','contour','area','surface','histogram'};

if isempty(hbase)
   tf = false;
else
   tf = ishghandle(hbase,supported_objtypes{1});
   for n = 2:numel(supported_objtypes)
      tf(:) = tf | ishghandle(hbase,supported_objtypes{n});
   end
   tf = all(tf);
end

end

% synchronize hatching line color to the patch's edge color if HatchColor =
% 'auto'
function syncColor(H,A)

if ~getappdata(H,'HatchFill2MatchColor')
   % do not sync
   return;
end

if ishghandle(A,'patch') || ishghandle(A,'Bar') || ishghandle(A,'area') ...
      || ishghandle(A,'surface') || ishghandle(A,'Histogram') %HG2
   pname = 'EdgeColor';
elseif ishghandle(A,'contour') % HG2
   pname = 'LineColor';
end
color = A.(pname);
if strcmp(color,'flat')
   try
      color = double(A.Edge(1).ColorData(1:3)')/255;
   catch
      warning('Does not support CData based edge color.');
      color = 'k';
   end
end
H.Color = color;
H.MarkerFaceColor = color;

end

function [V,F,FillFcns] = gethgdata(A)
% Get vertices & face data from the object along with the critical
% properties to observe change in the hatching area

% initialize the output variable
F = [];
V = [];
FillFcns = {};

if ~isvalid(A) || strcmp(A.Visible,'off')
   return;
end

if ishghandle(A,'patch')
   V = A.Vertices;
   F = A.Faces;
elseif ishghandle(A,'bar')
   [V,F] = getQuadrilateralData(A.Face);
elseif ishghandle(A,'area')
   [V,F] = getTriangleStripData(A.Face);
   set(A,'FaceColor','none');
elseif ishghandle(A,'surface') % HG2
   if strcmp(A.FaceColor,'none')
      FillFcns = {@()set(A,'FaceColor','w'),@()set(A,'FaceColor','none')};
      return;
   end
   [V,F] = getQuadrilateralData(A.Face);
elseif ishghandle(A,'contour') % HG2

   % Retrieve data from hidden FacePrims property (a TriangleStrip object)
   if strcmp(A.Fill,'off')
      FillFcns = {@()set(A,'Fill','on'),@()set(A,'Fill','off')};
      return;
   end
   [V,F] = getTriangleStripData(A.FacePrims);
elseif ishghandle(A,'histogram') %HG2: Quadrateral underlying data object
   [V,F] = getQuadrilateralData(A.NodeChildren(4));
end

end

function [V,F] = getQuadrilateralData(A) % surface, bar, histogram,

if isempty(A)
   warning('Cannot hatch the face: Graphics object''s face is not defined.');
   V = [];
   F = [];
   return;
end

V = A.VertexData';

% If any of the axes is in log scale, V is normalized to wrt the axes
% limits,
V(:) = norm2data(V,A);

if ~isempty(A.VertexIndices) % vertices likely reused on multiple quadrilaterals
   I = A.VertexIndices;
   Nf = numel(I)/4; % has to be divisible by 4
else %every 4 consecutive vertices defines a quadrilateral
   Nv = size(V,1);
   Nf = Nv/4;
   I = 1:Nv;
end
F = reshape(I,4,Nf)';
if ~isempty(A.StripData) % hack workaround
   F(:) = F(:,[1 2 4 3]);
end
try
   if ~any(all(V==V(1,:))) % not on any Euclidian plane
      % convert quadrilateral to triangle strips
      F = [F(:,1:3);F(:,[1 3 4])];
   end
catch % if implicit array expansion is not supported (<R2016b)
   if all(V(:,1)~=V(1,1)) || all(V(:,2)~=V(1,2)) || all(V(:,3)~=V(1,3)) % not on any Euclidian plane
      % convert quadrilateral to triangle strips
      F = [F(:,1:3) F(:,[1 3 4])];
   end
end

end

function [V,F] = getTriangleStripData(A) % area & contour

if isempty(A)
   warning('Cannot hatch the face: Graphics object''s face is not defined.');
   V = [];
   F = [];
   return;
end

V = A.VertexData';
I = double(A.StripData);

% If any of the axes is in log scale, V is normalized to wrt the axes
% limits,
V(:) = norm2data(V,A);

N = numel(I)-1; % # of faces
m = diff(I);
M = max(m);
F = nan(N,M);
for n = 1:N
   idx = I(n):(I(n+1)-1);
   if mod(numel(idx),2) % odd
      idx(:) = idx([1:2:end end-1:-2:2]);
   else % even
      idx(:) = idx([1:2:end-1 end:-2:2]);
   end
   F(n,1:numel(idx)) = idx;
end
end

% if graphical objects are given normalized to the axes
function V = norm2data(V,A)
ax = ancestor(A,'axes');
inlog = strcmp({ax.XScale ax.YScale ax.ZScale},'log');
if any(inlog)
   lims = [ax.XLim(:) ax.YLim(:) ax.ZLim(:)];
   dirs = strcmp({ax.XDir ax.YDir ax.ZDir},'normal');
   for n = 1:3 % for each axis
      if inlog(n)
         lims(:,n) = log10(lims(:,n));
      end
      V(:,n) = V(:,n)*diff(lims(:,n));
      if dirs(n)
         V(:,n) = V(:,n) + lims(1,n);
      else
         V(:,n) = lims(2,n) - V(:,n);
      end
      if inlog(n)
         V(:,n) = 10.^V(:,n);
      end
   end
end
end

function pvalold = sethgprops(A,props)
% grab the common property names of the base objects

pnames = fieldnames(props);
if ishghandle(A,'hggroup')
   gpnames = fieldnames(set(A));
   [tf,idx] = ismember(gpnames,pnames);
   idx(~tf) = [];
   for i = idx'
      pvalold.(pnames{i}) = A.(pnames{i});
      A.(pnames{i}) = props.(pnames{i});
   end
   props = rmfield(props,pnames(idx));

   h = handle(A.Children);
   for n = 1:numel(h)
      pvalold1 = sethgprops(h(n),props);
      ponames = fieldnames(pvalold1);
      for k = 1:numel(ponames)
         pvalold.(ponames{k}) = {h(n) pvalold1.(ponames{k})};
      end
   end
else
   for n = 1:numel(pnames)
      pvalold.(pnames{n}) = A.(pnames{n});
      A.(pnames{n}) = props.(pnames{n});
   end
end

end

function xydatai = hatch_xy(xydata,styl,angle,step,offset)
%
% M_HATCH Draws hatched or speckled interiors to a patch
%
%    M_HATCH(LON,LAT,STYL,ANGLE,STEP,...line parameters);
%
% INPUTS:
%     X,Y - vectors of points.
%     STYL - style of fill
%     ANGLE,STEP - parameters for style
%
%     E.g.
%
%      'single',45,5  - single cross-hatch, 45 degrees,  5 points apart
%      'cross',40,6   - double cross-hatch at 40 and 90+40, 6 points apart
%      'speckle',7,1  - speckled (inside) boundary of width 7 points, density 1
%                               (density >0, .1 dense 1 OK, 5 sparse)
%      'outspeckle',7,1 - speckled (outside) boundary of width 7 points, density 1
%                               (density >0, .1 dense 1 OK, 5 sparse)
%
%
%      H=M_HATCH(...) returns handles to hatches/speckles.
%
%      [XI,YI,X,Y]=MHATCH(...) does not draw lines - instead it returns
%      vectors XI,YI of the hatch/speckle info, and X,Y of the original
%      outline modified so the first point==last point (if necessary).
%
%     Note that inside and outside speckling are done quite differently
%     and 'outside' speckling on large coastlines can be very slow.

%
% Hatch Algorithm originally by K. Pankratov, with a bit stolen from
% Iram Weinsteins 'fancification'. Speckle modifications by R. Pawlowicz.
%
% R Pawlowicz 15/Dec/2005

I = zeros(1,size(xydata,2));

% face vertices are not always closed
if any(xydata(:,1)~=xydata(:,end))
   xydata(:,end+1) = xydata(:,1);
   I(end+1) = I(1);
end

if any(strcmp(styl,{'speckle','outspeckle'}))
   angle = angle*(1-I);
end

switch styl
   case 'single'
      xydatai = drawhatch(xydata,angle,1/step,0,offset);
   case 'cross'
      xydatai = [...
         drawhatch(xydata,angle,1/step,0,offset) ...
         drawhatch(xydata,angle+90,1/step,0,offset)];
   case 'speckle'
      xydatai = [...
         drawhatch(xydata,45,   1/step,angle,offset) ...
         drawhatch(xydata,45+90,1/step,angle,offset)];
   case 'outspeckle'
      xydatai = [...
         drawhatch(xydata,45,   1/step,-angle,offset) ...
         drawhatch(xydata,45+90,1/step,-angle,offset)];
      inside = logical(inpolygon(xydatai(1,:),xydatai(2,:),x,y)); % logical needed for v6!
      xydatai(:,inside) = [];
   otherwise
      xydatai = zeros(2,0);
end

end

%%%

function xydatai = drawhatch(xydata,angle,step,speckle,offset)
% xydata is given as 2xN matrix, x on the first row, y on the second

% Idea here appears to be to rotate everthing so lines will be
% horizontal, and scaled so we go in integer steps in 'y' with
% 'points' being the units in x.
% Center it for "good behavior".

% rotate first about (0,0)
ca = cosd(angle); sa = sind(angle);
u = [ca sa]*xydata;              % Rotation
v = [-sa ca]*xydata;

% translate to the grid point nearest to the centroid
u0 = round(mean(u)/step)*step; v0 = round(mean(v)/step)*step;
x = (u-u0); y = (v-v0)/step+offset;    % plus scaling and offsetting

% Compute the coordinates of the hatch line ...............
yi = ceil(y);
yd = [diff(yi) 0]; % when diff~=0 we are crossing an integer
fnd = find(yd);    % indices of crossings
dm = max(abs(yd)); % max possible #of integers between points

% This is going to be pretty space-inefficient if the line segments
% going in have very different lengths. We have one column per line
% interval and one row per hatch line within that interval.
%
A = cumsum( repmat(sign(yd(fnd)),dm,1), 1);

% Here we interpolate points along all the line segments at the
% correct intervals.
fnd1 = find(abs(A)<=abs( repmat(yd(fnd),dm,1) ));
A  = A+repmat(yi(fnd),dm,1)-(A>0);
xy = (x(fnd+1)-x(fnd))./(y(fnd+1)-y(fnd));
xi = repmat(x(fnd),dm,1)+(A-repmat(y(fnd),dm,1) ).*repmat(xy,dm,1);
yi = A(fnd1);
xi = xi(fnd1);

% Sorting points of the hatch line ........................
%%yi0 = min(yi); yi1 = max(yi);
% Sort them in raster order (i.e. by x, then by y)
% Add '2' to make sure we don't have problems going from a max(xi)
% to a min(xi) on the next line (yi incremented by one)
xi0 = min(xi); xi1 = max(xi);
ci = 2*yi*(xi1-xi0)+xi;
[~,num] = sort(ci);
xi = xi(num); yi = yi(num);

% if this happens an error has occurred somewhere (we have an odd
% # of points), and the "fix" is not correct, but for speckling anyway
% it really doesn't make a difference.
if rem(length(xi),2)==1
   xi = [xi; xi(end)];
   yi = [yi; yi(end)];
end

% Organize to pairs and separate by  NaN's ................
li = length(xi);
xi = reshape(xi,2,li/2);
yi = reshape(yi,2,li/2);

% The speckly part - instead of taking the line we make a point some
% random distance in.
if length(speckle)>1 || speckle(1)~=0

   if length(speckle)>1
      % Now we get the speckle parameter for each line.

      % First, carry over the speckle parameter for the segment
      %   yd=[0 speckle(1:end-1)];
      yd = speckle(1:end);
      A=repmat(yd(fnd),dm,1);
      speckle=A(fnd1);

      % Now give it the same preconditioning as for xi/yi
      speckle=speckle(num);
      if rem(length(speckle),2)==1
         speckle = [speckle; speckle(end)];
      end
      speckle=reshape(speckle,2,li/2);

   else
      speckle=[speckle;speckle];
   end

   % Thin out the points in narrow parts.
   % This keeps everything when abs(dxi)>2*speckle, and then makes
   % it increasingly sparse for smaller intervals.
   dxi=diff(xi);
   nottoosmall=sum(speckle,1)~=0 & rand(1,li/2)<abs(dxi)./(max(sum(speckle,1),eps));
   xi=xi(:,nottoosmall);
   yi=yi(:,nottoosmall);
   dxi=dxi(nottoosmall);
   if size(speckle,2)>1, speckle=speckle(:,nottoosmall); end
   % Now randomly scatter points (if there any left)
   li=length(dxi);
   if any(li)
      xi(1,:)=xi(1,:)+sign(dxi).*(1-rand(1,li).^0.5).*min(speckle(1,:),abs(dxi) );
      xi(2,:)=xi(2,:)-sign(dxi).*(1-rand(1,li).^0.5).*min(speckle(2,:),abs(dxi) );
      % Remove the 'zero' speckles
      if size(speckle,2)>1
         xi=xi(speckle~=0);
         yi=yi(speckle~=0);
      end
   end
else
   xi = [xi; ones(1,li/2)*nan];  % Separate the line segments
   yi = [yi; ones(1,li/2)*nan];
end

% Transform back to the original coordinate system
xydatai = [ca -sa;sa ca]*[xi(:)'+u0;(yi(:)'-offset)*step+v0];

end

%%%%%%%%%%%%%%%%%%%%%%%%%%%%%%%%%%%%%%%%%%%%%%%%%%%%%%%%%%%%%%%%%%%%%%%%%%%

function [h,opts,props] = parse_input(h,argin)
% parse & validate input arguments

patchtypes = {'single','cross','speckle','outspeckle','fill','none'};

% get base object handle
if ~issupported(h)
   error('Unsupported graphics handle type.');
end
h = handle(h);

% get common property names
pnames = getcommonprops(h);

% if style argument is given, convert it to HatchStyle option pair
stylearg = {};
if ~isempty(argin) && ischar(argin{1})
   try
      ptypes = validatestring(argin{1},patchtypes);
      stylearg = {'HatchStyle' ptypes};
      argin(1) = [];
   catch
      % STYL not given, continue on
   end
end

% create inputParser for options
p = inputParser;
p.addParameter('HatchStyle','single');
p.addParameter('HatchAngle',45,@(v)validateattributes(v,{'numeric'},{'scalar','finite','real'}));
p.addParameter('HatchDensity',40,@(v)validateattributes(v,{'numeric'},{'scalar','positive','finite','real'}));
p.addParameter('HatchSpacing',[],@(v)validateattributes(v,{'numeric'},{'scalar','positive','finite','real'}));
p.addParameter('HatchOffset',0,@(v)validateattributes(v,{'numeric'},{'scalar','nonnegative','<',1,'real'}));
p.addParameter('HatchColor','auto',@validatecolor);
p.addParameter('HatchLineStyle','-');
p.addParameter('HatchLineWidth',0.5,@(v)validateattributes(v,{'numeric'},{'scalar','positive','finite','real'}));
p.addParameter('SpeckleWidth',7,@(v)validateattributes(v,{'numeric'},{'scalar','finite','real'}));
p.addParameter('SpeckleDensity',100,@(v)validateattributes(v,{'numeric'},{'scalar','positive','finite','real'}));
p.addParameter('SpeckleMarkerStyle','.');
p.addParameter('SpeckleSize',2,@(v)validateattributes(v,{'numeric'},{'scalar','positive','finite'}));
p.addParameter('SpeckleFillColor','auto',@validatecolor);
p.addParameter('HatchVisible','auto');

for n = 1:numel(pnames)
   p.addParameter(pnames{n},[]);
end
p.parse(stylearg{:},argin{:});

rnames = fieldnames(p.Results);
isopt = ~cellfun(@isempty,regexp(rnames,'^(Hatch|Speckle)','once')) | strcmp(rnames,'ContourStyle');
props = struct([]);
for n = 1:numel(rnames)
   if isopt(n)
      opts.(rnames{n}) = p.Results.(rnames{n});
   elseif ~isempty(p.Results.(rnames{n}))
      props(1).(rnames{n}) = p.Results.(rnames{n});
   end
end

opts.HatchStyle = validatestring(opts.HatchStyle,patchtypes);
if any(strcmp(opts.HatchStyle,{'speckle','outspeckle'}))
   warning('hatchfill2:PartialSupport','Speckle/outspeckle HatchStyle may not work in the current release of hatchfill2')
end
if strcmpi(opts.HatchStyle,'none') % For backwards compatability:
   opts.HatchStyle = 'fill';
end
opts.HatchLineStyle = validatestring(opts.HatchLineStyle,{'-','--',':','-.'},mfilename,'HatchLineStyle');

if ~isempty(opts.HatchSpacing)
   warning('HatchSpacing option has been deprecated. Use ''HatchDensity'' option instead.');
end
opts = rmfield(opts,'HatchSpacing');

opts.SpeckleMarkerStyle = validatestring(opts.SpeckleMarkerStyle,{'+','o','*','.','x','square','diamond','v','^','>','<','pentagram','hexagram'},'hatchfill2','SpeckleMarkerStyle');
opts.HatchVisible = validatestring(opts.HatchVisible,{'auto','on','off'},mfilename,'HatchVisible');

end

function pnames = getcommonprops(h)
% grab the common property names of the base objects

V = set(h(1));
pnames = fieldnames(V);
if ishghandle(h(1),'hggroup')
   pnames = union(pnames,getcommonprops(get(h(1),'Children')));
end
for n = 2:numel(h)
   V = set(h(n));
   pnames1 = fieldnames(V);
   if ishghandle(h(n),'hggroup')
      pnames1 = union(pnames1,getcommonprops(get(h(n),'Children')));
   end
   pnames = intersect(pnames,pnames1);
end

end

function validatecolor(val)

try
   validateattributes(val,{'double','single'},{'numel',3,'>=',0,'<=',1});
catch
   validatestring(val,{'auto','y','yellow','m','magenta','c','cyan','r','red',...
      'g','green','b','blue','w','white','k','black'});
end
end

%%%%%%%%%%%%%%%%%%%%%%%%%%%%%%%%%%%%%%%%%%%%%%%%%%%%%%%%%%%%%%%%%%%%%%%%%%%
% axes unit conversion functions

function [V,T,islog] = transform_data(ax,V,ref)
% convert vertices data to hatch-ready form
% - if axis is log-scaled, data is converted to their log10 values
% - if 3D (non-zero z), spatially transform data onto the xy-plane. If
%   reference point is given, ref is mapped to the origin. Otherwise, ref
%   is chosen to be the axes midpoint projected onto the patch plane. Along
%   with the data, the axes corner coordinates are also projected onto the
%   patch plane to obtain the projected axes limits.
% - transformed xy-data are then normalized by the projected axes spans.

noZ = size(V,2)==2;

xl = ax.XLim;
yl = ax.YLim;
zl = ax.ZLim;

% log to linear space
islog = strcmp({ax.XScale ax.YScale ax.ZScale},'log');
if islog(1)
   V(:,1) = log10(V(:,1));
   xl = log10(xl);
   if ~isempty(ref)
      ref(1) = log10(ref(1));
   end
end
if islog(2)
   V(:,2) = log10(V(:,2));
   yl = log10(yl);
   if ~isempty(ref)
      ref(2) = log10(ref(2));
   end
end
if islog(3) && ~noZ
   V(:,3) = log10(V(:,3));
   zl = log10(zl);
   if ~isempty(ref)
      ref(3) = log10(ref(3));
   end
end

if noZ
   V(:,3) = 0;
end

% if not given, pick the reference point to be the mid-point of the current
% axes
if isempty(ref)
   ref = [mean(xl) mean(yl) mean(zl)];
end

% normalize the axes so that they span = 1;
Tscale = makehgtform('scale', [1/diff(xl) 1/diff(yl) 1/diff(zl)]);
V(:) = V*Tscale(1:3,1:3);
ref(:) = ref*Tscale(1:3,1:3);

% obtain unique vertices
Vq = double(unique(V,'rows')); % find unique points (sorted order)
Nq = size(Vq,1);
if Nq<3 || any(isinf(Vq(:))) || any(isnan(Vq(:))) % not hatchable
   V = [];
   T = [];
   return;
end

try % erros if 2D object
   zq = unique(Vq(:,3));
catch
   V(:,3) = 0;
   zq = 0;
end
T = eye(4);
if isscalar(zq) % patch is on a xy-plane
   if zq~=0 % not on the xy-plane
      T = makehgtform('translate',[0 0 -zq]);
   end
else
   % if patch is not on a same xy-plane

   % use 3 points likely well separated
   idx = round((0:2)/2*(Nq-1))+1;

   % find unit normal vector of the patch plane
   norm = cross(Vq(idx(1),:)-Vq(idx(3),:),Vq(idx(2),:)-Vq(idx(3),:)); % normal vector
   norm(:) = norm/sqrt(sum(norm.^2));

   % define the spatial rotation
   theta = acos(norm(3));
   if theta>pi/2, theta = theta-pi; end
   u = [norm(2) -norm(1) 0];
   Trot = makehgtform('axisrotate',u,theta);

   % project the reference point onto the plane
   P = norm.'*norm;
   ref_proj = ref*(eye(3) - P) + Vq(1,:)*P;
   if norm(3)
      T = makehgtform('translate', -ref_proj); % user specified reference point or -d/norm(3) for z-crossing
   end

   % apply the rotation now
   T(:) = Trot*T;

   % find the axes limits on the transformed space
   %    [Xlims,Ylims,Zlims] = ndgrid(xl,yl,zl);
   %    Vlims = [Xlims(:) Ylims(:) Zlims(:)];
   %    Vlims_proj = [Vlims ones(8,1)]*T';
   %    lims_proj = [min(Vlims_proj(:,[1 2]),[],1);max(Vlims_proj(:,[1 2]),[],1)];
   %    xl = lims_proj(:,1)';
   %    yl = lims_proj(:,2)';
end

% perform the transformation
V(:,4) = 1;
V = V*T';
V(:,[3 4]) = [];

T(:) = T*Tscale;

end

function V = revert_data(V,T,islog)

N = size(V,1);
V = [V zeros(N,1) ones(N,1)]/T';
V(:,end) = [];

% log to linear space
if islog(1)
   V(:,1) = 10.^(V(:,1));
end
if islog(2)
   V(:,2) = 10.^(V(:,2));
end
if islog(3)
   V(:,3) = 10.^(V(:,3));
end

end
legendflex.m函数
function varargout = legendflex(varargin)
%LEGENDFLEX Creates a more flexible legend
%
% legendflex(M, param1, val1, ...)
% legendflex(h, M, param1, val1, ...)
% [legend_h,object_h,plot_h,text_str] = legendflex(...)
%
% This offers a more flexible version of the legend command.  It offers a
% different method of positioning the legend, as well as options to:
%
%   - organize legend text and symbols in a grid with a specified number of
%     rows and/or columns
%   - rescale the horizontal space used by each legend symbol
%   - create multiple legends for the same axis
%   - add a title to the legend within the legend box
%
% Unlike in the default legend command, where the legend is positioned
% relative to the labeled objects' parent axis according to one of 16
% location strings, this function positions the legend based on two anchor
% points (one on either the figure or a child object of a figure, and one
% on the legend itself) and a buffer (or offset) between these two anchor
% points. The anchor points refer to the corners and centers of each
% side of the box surrounding the reference object and the legend itself;
% they can be refered to either as numbers (1-8, clockwise from northwest
% corner) or strings ('nw', 'n', 'ne', 'e', 'se', 's', 'sw', 'w').  The
% position of the legend is determined by these two points and the distance
% between them, defined in the 'buffer' variable, which by default is
% measured in pixels.  So the combination of
%
%  (..., 'ref', gca, 'anchor', [3 3], 'buffer', [-10 -10])
%
% means that you want the northeast corner of the current axis to be
% aligned with the northeast corner of the legend, but with the legend
% shifted 10 pixels to the left and down.
%
% This method of positioning can be particularly useful when labeling a
% figure that includes many subplots that share a common color scheme,
% where the "best" location for a legend is not necessarily within the
% bounds of an axis.  Unlike the legend command, the axes in the figure are
% never resized (and it is up to the user to check that the legend fits on
% the figure in the specified location).  In addition to being easier than
% manually positioning a legend, this function updates the legend location
% when the figure is resized, preserving the desired alignment.  The
% following anchor/buffer combinations, when used with the default
% reference and a buffer unit of pixels, approximately replicate the
% typical legend locations:
%
% Specifier              Anchor    Buffer
%
% north                  [2 2]     [  0 -10]
% south                  [6 6]     [  0  10]
% east                   [4 4]     [-10   0]
% west                   [8 8]     [ 10   0]
% northeast              [3 3]     [-10 -10]
% northwest              [1 1]     [ 10 -10]
% southeast              [5 5]     [-10  10]
% southwest              [7 7]     [ 10  10]
% northoutside*          [2 6]     [  0  10]
% southoutside*          [6 2]     [  0 -10]
% eastoutside*           [3 8]     [ 10   0]
% westoutside*           [8 3]     [-10   0]
% northeastoutside*      [3 1]     [ 10   0]
% northwestoutside*      [1 3]     [-10   0]
% southeastoutside*      [5 7]     [ 10   0]
% southwestoutside*      [7 5]     [-10   0]  *placed outside axis rather
%                                              than resizing plot box
%
% This function should support all types of plot objects.
%
% Updates to labeled line and patch properties should be reflected in the
% legend.  In pre-R2014b versions of Matlab (those that use the old
% non-object graphics handles), properties of more complex legend labels,
% such as contours, quivers, bars, etc.) will also be synced to the legend;
% however, at this time, the code doesn't update properties for anything
% other than lines and patches in R2014b+ (haven't found a good way to
% listen for changes to the properties of the other graphics object types).
%
% A note on resizing: This function assigns a resize function to the parent
% figure to maintain the position of the legend (in terms of anchor
% location and buffer) as the figure size changes.  If you manually resize
% the legend, this function will respect changes to height, width, and
% units (though I don't recommend changing the units to 'normalized', as
% this can cause the text and symbols to overflow the legend box on
% resize).  It will not respect manual repositioning when resizing, since
% it assumes you want to maintain the anchor/buffer prescription used to
% create it.  Overall, I've tried to make this resize as unobtrusive as
% possible; if your figure already has a resize function at the time you
% apply it, that behavior is inherited, with the legend-resize called
% afterward.  If you plan to further modify the figure's resize function
% post-legendflex and want to maintain repositioning of the legends,
% retrieve the resize function via hfun = get(hfig, 'ResizeFcn'), pass it
% to the new resize function, and invoke it via feval(oldfun, h, ed), where
% h and ed are the default variables passed by a callback function.
%
% Input variables:
%
%   M:          cell array of strings, labels for legend
%
%   h:          handle of axis or handle(s) of object(s) to be labeled.  If
%               this is an axis handle, all children of the axis will be
%               included in the legend.  If not included, current axis is
%               used.
%
% Optional input variables (passed as parameter/value pairs): [default]
%
%   ncol:       number of columns, or 0 to indicate as many as necessary
%               given the # of labeled objects [1 if nrow is 0, 0
%               otherwise]
%
%   nrow:       number of rows, or 0 to indicate as many as necessary
%               given the # of labeled objects [0]
%
%   ref:        handle of object used to position the legend. This can be
%               either a figure or a child object of a figure (and does not
%               need to relate in any way to the objects being labeled).
%               If not included, the reference will be to the axis that a
%               normal legend would be associated with (usually the parent
%               axis of the labeled objects, unless objects from multiple
%               axes are passed, in which case it's the parent object of
%               the first labeled object).
%
%   anchor:     1 x 2 array specifying which points of the reference object
%               and new legend, respectively, to anchor to each other.
%               Anchor points can be described using either numbers (in a 1
%               x 2 double array) or directional strings (in a 1 x 2 cell
%               array) as follows:
%               1:  'nw'    upper left corner
%               2:  'n'     center of top edge
%               3:  'ne'    upper right corner
%               4:  'e'     center of right edge
%               5:  'se'    bottom right corner
%               6:  's'     center of bottom edge
%               7:  'sw'    bottom left corner
%               8:  'w'     center of left edge
%
%               [[3 3], i.e. {'ne' 'ne'}]
%
%   buffer:     1 x 2 array of horizontal and vertical distance,
%               respectively, from the reference anchor point to the legend
%               anchor point. Distance is measured in units specified by
%               bufferunit. [[-10 -10]]
%
%   bufferunit: unit for buffer distance.  Note that this property only
%               affects the units used to position the legend, not the
%               units for the legend itself (which is always a fixed size,
%               based on the space needed to encapsulate the specified
%               symbols and text).  The 'normalized' units are normalized
%               to size of the figure. ['pixels']
%
%   box:        'on' or 'off', specifies whether to enclose legend objects
%               in a box ['on']
%
%   xscale:     scalar value indicating scale factor to apply to the width
%               required by each symbol, relative to the size used by
%               legend. For example, 0.5 will shorten the lines/patches by
%               half. [1]
%
%   title:      A title string to be added inside the legend box, centered,
%               above all legend entries.  This can be either a string or a
%               cell array of strings; the latter will produce a multi-line
%               title. If empty, no title is added.  ['']
%
%   padding:    1 x 3 array, pixel spacing added to beginning of each
%               column (before symbol), between symbol and text, and after
%               text, respectively.  Usually, the default provides the
%               spacing typical of a regular legend, but occassionally the
%               extent properties wrap a little too close to text, making
%               things look crowded; in these cases you can try unsquishing
%               (or squishing, via use of negative values) things via this
%               parameter. [2 1 1]
%
%   nolisten:   logical scalar.  If true, don't add the event listeners.
%               The event listeners update the legend objects when you
%               change a property of the labeled objects (such as line
%               style, color, etc.).  However, the updating requires the
%               legend to be redrawn, which can really slow things down,
%               especially if you're labelling lots of objects that get
%               changed together (if you change the line width of 100
%               labeled lines, the legend gets redrawn 100 times).  In more
%               recent releases, this also occurs when printing to file, so
%               I recommend setting this to true if you plan to print a
%               legend with a large number of labeled objects.  The legend
%               will still be redrawn on figure resize regardless of the
%               value of this parameter. [false]
%
%   In addition to these legendflex-specific parameters, this function will
%   accept any parameter accepted by the original legend function (e.g.
%   font properties) except 'location', 'boxon', 'boxoff', or 'hide'.
%
% Output variables:
%
%   legend_h:   handle of the legend axis.  It is not linked to an axis or
%               graphics objects in the same way as a Matlab legend.
%               However, on figure resize, all properties of the legend
%               objects are checked for changes, so adjusting the figure
%               size can re-link the legend to the labeled objects after
%               you have made changes to those objects.
%
%   object_h:   handles of the line, patch, and text graphics objects
%               created in the legend
%
%   plot_h:     handles of the lines and other objects labeled in this
%               legend
%
%   text_str:   cell array of the text strings used in the legend
%
%
% Example:
%
% % Replicating an example from legend.m:
%
% figure;
% b = bar(rand(10,5),'stacked'); colormap(summer); hold on
% x = plot(1:10,5*rand(10,1),'marker','square','markersize',12,...
%          'markeredgecolor','y','markerfacecolor',[.6 0 .6],...
%          'linestyle','-','color','r','linewidth',2); hold off
% lbl = {'Carrots','Peas','Peppers','Green Beans','Cucumbers','Eggplant'};
%
% % Rather than covering up data or resizing the axis, let's squeeze the
% % legend into the margin at the top of the figure;
%
% legendflex([b,x], lbl, 'ref', gcf, ...
%                        'anchor', {'n','n'}, ...
%                        'buffer',[0 0], ...
%                        'nrow',2, ...
%                        'fontsize',8);

% Copyright 2011-2014 Kelly Kearney

% Detemine whether HG2 is in use

hg2flag = ~verLessThan('matlab', '8.4.0');
r2016aflag = ~verLessThan('matlab', '9.0.0');
r2013bflag = ~verLessThan('matlab', '8.2.0');

%-------------------
% Parse input
%-------------------
%
% allinput = varargin; % Save for callback later
%
% islegin = false(size(varargin));

% First inputs must be either:
% (M, ...)
% (h, M, ...)

narginchk(1,Inf);

% Split input into the variables that will be passed to legend (handles and
% labels) and everything else

handlepassed = all(ishandle(varargin{1})); % for HG1/HG2

iscellstr = @(x) cellfun(@(y) ischar(y), x); % For now...
% iscellstr = @(x) cellfun(...
%     @(y) ischar(y) || (iscell(y) && all(cellfun(@ischar,y))), x); % for multi-line?

if handlepassed
    legin = varargin(1:2);
    if ~iscell(legin{2}) || ~all(iscellstr(legin{2}))
        error('Legend labels must be a cell array of strings');
    end
    pv = varargin(3:end);
else
    legin = varargin(1);
    if ~iscell(legin{1}) || ~all(iscellstr(legin{1}))
        if isnumeric(legin{1})
            error('Unable to parse input 1; check that handle(s) exist');
        else
            error('Legend labels must be a cell array of strings');
        end
    end
    pv = varargin(2:end);
end

% Parse my optional properties

if hg2flag
    defref = gobjects(0);
else
    defref = NaN;
end

if r2013bflag
    addParamMethod = 'addParameter';
else
    addParamMethod = 'addParamValue';
end

p = inputParser;
p.(addParamMethod)('xscale',     1,         @(x) validateattributes(x, {'numeric'}, {'nonnegative','scalar'}));
p.(addParamMethod)('ncol',       0,         @(x) validateattributes(x, {'numeric'}, {'scalar', 'integer'}));
p.(addParamMethod)('nrow',       0,         @(x) validateattributes(x, {'numeric'}, {'scalar', 'integer'}));
p.(addParamMethod)('ref',        defref,    @(x) validateattributes(x, {'numeric','handle'}, {'scalar'}));
p.(addParamMethod)('anchor',     [3 3],     @(x) validateattributes(x, {'numeric','cell'}, {'size', [1 2]}));
p.(addParamMethod)('buffer',     [-10 -10], @(x) validateattributes(x, {'numeric'}, {'size', [1 2]}));
p.(addParamMethod)('bufferunit', 'pixels',  @(x) validateattributes(x, {'char'}, {}));
p.(addParamMethod)('box',        'on',      @(x) validateattributes(x, {'char'}, {}));
p.(addParamMethod)('title',      '',        @(x) validateattributes(x, {'char','cell'}, {}));
p.(addParamMethod)('padding',    [2 1 1],   @(x) validateattributes(x, {'numeric'}, {'size', [1 3]})); % 'nonnegative'
p.(addParamMethod)('nolisten',   false,     @(x) validateattributes(x, {'logical'}, {'scalar'}));
p.KeepUnmatched = true;

p.parse(pv{:});
Opt = p.Results;

% Any parameters that don't match mine are assumed to be a legend property.
%  If not, legend will handle the error when I call it.

Extra = p.Unmatched;
extra = [fieldnames(Extra) struct2cell(Extra)];
extra = extra';

% Validate that units and box inputs are correct

validatestring(Opt.bufferunit, {'pixels','normalized','inches','centimeters','points','characters'}, 'legendflex', 'bufferunit');
validatestring(Opt.box, {'on', 'off'}, 'legendflex', 'box');

% Translate anchor strings to numbers, if necessary

if iscell(Opt.anchor)
    [blah, Opt.anchor] = ismember(Opt.anchor, {'nw','n','ne','e','se','s','sw','w'});
    if ~all(blah)
        error('Anchor must be 1 x 2 cell array of strings: n, e, s, w, ne, nw, se, sw');
    end
else
    validateattributes(Opt.anchor, {'numeric'}, {'integer', '<=', 8}, 'legendflex', 'anchor');
end

% Create a temporary legend to get all the objects

S = warning('off', 'MATLAB:legend:PlotEmpty');
if r2016aflag
    % The new legend objects are pretty opaque... even diving into the
    % undocumented properties, I haven't been able to find the handles of
    % the legend sub-components (lines, text, etc).  So I need to stick to
    % the legacy version, which creates an axis object rather than legend
    % object. Legacy version has bug in text properties parsing, though, so
    % need to work around that too: use the new-style legend object to get
    % proper text properties, then use those to alter the buggy old-style
    % legend.
    tmp = legend(legin{:}, extra{:}, 'location', 'northeast');
    textProps = {'FontAngle','FontName','FontSize','FontUnits','FontWeight','Interpreter'};
    tprop = get(tmp, textProps);
    delete(tmp);
    wtmp = warning('off', 'MATLAB:handle_graphics:exceptions:SceneNode'); % silence Latex interpreter thing
    [h.leg, h.obj, h.labeledobj, h.textstr] = legend(legin{:}, extra{:}, 'location', 'northeast');
    warning(wtmp);
    nobj = length(h.labeledobj);
    for it = 1:length(textProps)
        set(h.obj(1:nobj), textProps{it}, tprop{it});
    end
else
    [h.leg, h.obj, h.labeledobj, h.textstr] = legend(legin{:}, extra{:}, 'location', 'northeast');
    nobj = length(h.labeledobj);
end
warning(S);

if nobj == 0
    warning('Plot empty; no legend created');
    return
end

% There's a bug in R2014b-R2015a that causes rendering issues if a contour
% object is included in a legend and legend is called with more than one
% output. For some reason, the rendering issues disappear only if the
% contour object(s) is listed last in the legend.  So for now, my
% workaround for this is to change the order of the legend labels as
% necessary.  Issue appears to be fixed in 2015b.

iscont = strcmp(get(h.labeledobj, 'type'), 'contour');
cbugflag = ~verLessThan('matlab', '8.4.0') && verLessThan('matlab', '8.6.0') && any(iscont);

if cbugflag

    if length(legin) == 1
        legin = {h.labeledobj legin{1}};
    end

    delete(h.leg);

    [srt, isrt] = sort(iscont);
    legin{1} = legin{1}(isrt);
    legin{2} = legin{2}(isrt);

    [h.leg, h.obj, h.labeledobj, h.textstr] = legend(legin{:}, extra{:}, 'location', 'northeast');

end

% # rows and columns

if (Opt.ncol == 0) && (Opt.nrow == 0)
    Opt.ncol = 1;
    Opt.nrow = nobj;
elseif (Opt.ncol == 0)
    Opt.ncol = ceil(nobj./Opt.nrow);
elseif (Opt.nrow == 0)
    Opt.nrow = ceil(nobj./Opt.ncol);
end
if Opt.ncol*Opt.nrow < nobj
    error('Number of legend entries greater than specified grid allows; change ncol and/or nrow');
end

% Reference object

if hg2flag

    if isempty(Opt.ref)

        if all(ishandle(legin{1}))
            tmp = ancestor(legin{1}, 'axes');
            if iscell(tmp)
                Opt.ref = tmp{1};
            else
                Opt.ref = tmp(1);
            end
        else
            Opt.ref = gca;
        end

    end
else
    if isnan(Opt.ref)
        tmp = get(h.leg, 'UserData');
        Opt.ref = tmp.PlotHandle;
    end
end
if ~ishandle(Opt.ref)
    error('Input ref must be a graphics handle');
end

% Box

Opt.box = strcmpi('on', Opt.box);

% Convert units to getpos abbreviations

unittable = {...
    'px'  'Pixels'
    'nz'  'Normalized'
    'in'  'Inches'
    'cm'  'Centimeters'
    'pt'  'Points'
    'ch'  'Characters'};
Opt.bufunit = unittable{strcmpi(unittable(:,2),Opt.bufferunit),1};

% Check for title

addtitle = ~isempty(Opt.title);

%-------------------
% New placement of
% everything in
% legend
%-------------------

% Determine parent figure

figh = ancestor(Opt.ref, 'figure');
currax = get(figh, 'currentaxes');

% Calculate row height

legpospx = getpos(h.leg, 'px');

% rowHeight = legpospx(4)/nobj;
vmarginNm =  0.275/nobj;
vmarginPx = legpospx(4) * vmarginNm;

rowHeightNm = (1 - vmarginNm)/nobj;
rowHeight = rowHeightNm .* legpospx(4);

% Determine width needed for each text string

if nobj == 1
    textExtent = get(h.obj(1:nobj), 'Extent');
else
    textExtent = cell2mat(get(h.obj(1:nobj), 'Extent'));
end
textWidthPx  = textExtent(:,3) .* legpospx(3);
textHeightPx = textExtent(:,4) .* legpospx(4);
textWidthNm = textExtent(:,3);

% Calculate horizontal space needed for symbols

symbolWidthPx = textExtent(1,1) .* legpospx(3) * Opt.xscale;
symbolWidthNm = textExtent(1,1);

% Calculate column width needed for 2px-symbol-1px-text-1px

colWidth = zeros(Opt.ncol*Opt.nrow,1);
colWidth(1:nobj) = textWidthPx + symbolWidthPx + sum(Opt.padding);
colWidth = reshape(colWidth, Opt.nrow, Opt.ncol);
colWidth = max(colWidth,[],1);

% If title is added, figure out how much space it will need

if addtitle
    textProps = {'FontAngle','FontName','FontSize','FontUnits','FontWeight','Interpreter'};
    textVals = get(h.obj(1), textProps);
    ttlprops = [textProps; textVals];

    fpos = getpos(figh, 'px');
    figtmp = figure('units','pixels','position',[0 0 fpos(3:4)],'visible','off');
    axes('parent',figtmp,'position',[0 0 1 1],'xlim',[0 fpos(3)],'ylim',[0 fpos(4)]);
    tmp = text(0,0,Opt.title, ttlprops{:}, 'horiz', 'left', 'vert', 'bottom');
    ttlex = get(tmp, 'extent');
    ttlwidth = ceil(ttlex(3)) + 4; % Add a little padding
    ttlheight = ceil(ttlex(4));

    if ttlwidth > sum(colWidth)
        colWidth(end) = colWidth(end) + (ttlwidth-sum(colWidth));
    end
    close(figtmp);
end

% Locate bottom left corner of each legend symbol, text box, and title

xsymbnew = [0 cumsum(colWidth(1:end-1))]+Opt.padding(1);
ysymbnew = (rowHeight*Opt.nrow + vmarginPx)-(1:Opt.nrow)*rowHeight;
[xsymbnew, ysymbnew] = meshgrid(xsymbnew, ysymbnew);
xsymbnew = xsymbnew(1:nobj);
ysymbnew = ysymbnew(1:nobj);

xtext = xsymbnew + Opt.padding(2) + symbolWidthPx;
ytext = ysymbnew;% + 1;

xsymbold = zeros(nobj,1);
ysymbold = 1 - (1/nobj)*(1:nobj);

wnewleg = sum(colWidth);
hnewleg = rowHeight*Opt.nrow + vmarginPx;

if addtitle
    xttl = wnewleg/2;
    yttl = hnewleg;
    hnewleg = hnewleg + ttlheight;
end

% Get legend position in bufferunit and translate to pixels

legpos = positionleg(Opt.ref, wnewleg, hnewleg, Opt.anchor, Opt.buffer, Opt.bufunit);
tmpax = axes('units', Opt.bufferunit, 'position', legpos,'visible','off');
legpos = getpos(tmpax, 'px');
delete(tmpax);

%-------------------
% Create legend
%-------------------

% Create the legend axis

hnew.leg = axes('units', 'pixels', ...
               'position', legpos, ...
               'xlim', [0 legpos(3)], ...
               'ylim', [0 legpos(4)], ...
               'xtick', [], ...
               'ytick', [], ...
               'box', 'on', ...
               'parent', figh);

% Copy the text strings to the new legend

textProps = {'FontAngle','FontName','FontSize','FontUnits','FontWeight','Interpreter','HorizontalAlignment','VerticalAlignment'};
textVals = get(h.obj(1:nobj), textProps);

if hg2flag
    hnew.obj = gobjects(size(h.obj));
else
    hnew.obj = zeros(size(h.obj));
end
for it = 1:nobj
    props = [textProps; textVals(it,:)];
    hnew.obj(it) = text(xtext(it), ytext(it), h.textstr{it}, props{:}, ...
                        'horizontalalignment', 'left', ...
                        'verticalalignment', 'bottom');
end

% Copy the symbols to the new legend

nsymbol = length(h.obj) - nobj;

for ii = 1:nsymbol

    if strcmp(get(h.obj(nobj+ii), 'type'), 'hggroup')

        tag = get(h.obj(nobj+ii),'Tag');
        if ~isempty(tag)
            [blah, idx] = ismember(tag,h.textstr);
        end

        chld = findall(h.obj(nobj+ii), 'type', 'line', '-or', 'type', 'patch');
        for ic = 1:length(chld)
            xy = get(chld(ic), {'xdata', 'ydata'});

            xnorm = xy{1}./symbolWidthNm;
            ynorm = (xy{2}- (1-idx*rowHeightNm))./rowHeightNm;

            xnew = xnorm * symbolWidthPx + xsymbnew(idx);
            ynew = ynorm * rowHeight     + ysymbnew(idx);

            set(chld(ic), 'xdata', xnew, 'ydata', ynew);
        end

        hnew.obj(nobj+ii) = copyobj(h.obj(nobj+ii), hnew.leg);

    else

        hnew.obj(nobj+ii) = copyobj(h.obj(nobj+ii), hnew.leg);

        tag = get(h.obj(nobj+ii),'Tag');
        if ~isempty(tag) % assumes empty tags indicate repetition of previous tag (true pre-2014b)
            [blah, idx] = ismember(tag,h.textstr);
        end

        xy = get(h.obj(nobj+ii), {'xdata', 'ydata'});

        xnorm = xy{1}./symbolWidthNm;
        ynorm = (xy{2}- (1-idx*rowHeightNm))./rowHeightNm;

        xnew = xnorm * symbolWidthPx + xsymbnew(idx);
        ynew = ynorm * rowHeight     + ysymbnew(idx);

        set(hnew.obj(nobj+ii), 'xdata', xnew, 'ydata', ynew);

    end

end

% Add title

if addtitle
    text(xttl, yttl, Opt.title, ttlprops{:}, 'horiz', 'center', 'vert', 'bottom');
end

% Add box or hide axis

if Opt.box
    set(hnew.leg, 'box', 'on');
else
    if hg2flag
        set(hnew.leg, 'box', 'off', 'color', 'none', 'xcolor', 'none', 'ycolor', 'none');
    else
        set(hnew.leg, 'visible', 'off');
    end
end

% Delete the temporary legend

delete(h.leg);

% Return focus to previously-current axis

set(figh, 'currentaxes', currax);
drawnow; % Not sure why this is necessary for the currentaxes to take effect, but it is

% Fix for vertical-alignment issue: This solution still isn't perfect, but
% it seems to help for most Interpreter-none and Interpreter-latex cases.
% The TeX interpreter still places sub- and superscripts too high/low... no
% robust fix found for that yet.
%
% TODO: need to add proper calcs for when title included
%
% Thanks to S�ren Enemark for this suggestion.

if ~addtitle
    try % TODO: Crashing on some edge cases
        textobj = hnew.obj(1:nobj);
        yheight = get(hnew.leg, 'ylim');
        yheight = yheight(2);

        ylo = get(textobj(Opt.nrow), 'extent');
        ylo = ylo(2);
        yhi = get(textobj(1), 'extent');
        yhi = sum(yhi([2 4]));
        dy = yheight/2 - 0.5*(ylo + yhi);
        for ii = 1:length(textobj)
            pos = get(textobj(ii), 'position');
            set(textobj(ii), 'position', pos + [0 dy 0]);
        end
    end
end

%-------------------
% Callbacks and
% listeners
%-------------------

% Save some relevant variables in the new legend axis's application data

Lf.ref        = Opt.ref;
Lf.w          = wnewleg;
Lf.h          = hnewleg;
Lf.anchor     = Opt.anchor;
Lf.buffer     = Opt.buffer;
Lf.bufunit    = Opt.bufunit;
Lf.bufferunit = Opt.bufferunit;
Lf.plotobj    = h.labeledobj;
Lf.legobj     = hnew.obj;

setappdata(hnew.leg, 'legflex', Lf);

% Resize listeners

addlistener(hnew.leg, 'Position', 'PostSet', @(src,evt) updatelegappdata(src,evt,hnew.leg));
if hg2flag && strcmp(Lf.ref.Type, 'figure')
    addlistener(Lf.ref, 'SizeChanged', @(src,evt) updatelegpos(src,evt,hnew.leg));
else
    addlistener(Lf.ref, 'Position', 'PostSet', @(src,evt) updatelegpos(src,evt,hnew.leg));
end
rsz = get(figh, 'ResizeFcn');
if isempty(rsz) % No previous resize function
    set(figh, 'ResizeFcn', @updatelegfigresize);
else
    if ~iscell(rsz)
        rsz = {rsz};
    end
    hasprev = cellfun(@(x) isequal(x, @updatelegfigresize), rsz);
    if ~hasprev
        rsz = {rsz{:} @updatelegfigresize};
        set(figh, 'ResizeFcn', {@wrapper, rsz});
    end
end

if ~Opt.nolisten

    % Run the resync function if anything changes with the labeled objects

    objwatch = findall(h.labeledobj, 'type', 'line', '-or', 'type', 'patch');

    for ii = 1:length(objwatch)
        switch lower(get(objwatch(ii), 'type'))
            case 'line'
                triggerprops = {'Color','LineStyle','LineWidth','Marker','MarkerSize','MarkerEdgeColor','MarkerFaceColor'};
                addlistener(objwatch(ii), triggerprops, 'PostSet', @(h,ed) resyncprops(h,ed,hnew.leg));
            case 'patch'
                triggerprops = {'CData','CDataMapping','EdgeAlpha','EdgeColor','FaceAlpha','FaceColor','LineStyle','LineWidth','Marker','MarkerEdgeColor','MarkerFaceColor','MarkerSize'};
                addlistener(objwatch(ii), triggerprops, 'PostSet', @(h,ed) resyncprops(h,ed,hnew.leg));
        end
    end

end


%-------------------
% Output
%-------------------

out = {hnew.leg, hnew.obj, h.labeledobj, h.textstr};
varargout = out(1:nargout);


%***** Subfunctions *****

%------------------------
% Position new legend
%------------------------

function legpos = positionleg(href, w, h, anchor, buffer, bufunit)
% ap: position vector for reference object
% lp: position vector for legend

if strcmp(get(href, 'type'), 'figure')
    tmp = axes('parent', href,'position', [0 0 1 1],'visible','off');
    pos = getpos(tmp, bufunit);
    delete(tmp);
else
    pos = getpos(href, bufunit);
end

htmp = axes('units', 'pixels', 'position', [0 0 w h], 'visible','off');
lpos = getpos(htmp, bufunit);
delete(htmp);
w = lpos(3);
h = lpos(4);

% Find anchor locations on reference object

refxy = [...
    pos(1)          pos(2)+pos(4)
    pos(1)+pos(3)/2 pos(2)+pos(4)
    pos(1)+pos(3)   pos(2)+pos(4)
    pos(1)+pos(3)   pos(2)+pos(4)/2
    pos(1)+pos(3)   pos(2)
    pos(1)+pos(3)/2 pos(2)
    pos(1)          pos(2)
    pos(1)          pos(2)+pos(4)/2];

% How bottom left relates to each anchor point

shift = [...
    0       -h
    -w/2    -h
    -w      -h
    -w      -h/2
    -w      0
    -w/2    0
    0       0
    0       -h/2];

% Legend location

corner = refxy(anchor(1),:) + buffer + shift(anchor(2),:);
legpos = [corner w h];

%------------------------
% Listener functions
%------------------------

% If user manually resizes the legend, update the app data

function updatelegappdata(src, evt, legax)
if ishandle(legax)
    Lf = getappdata(legax, 'legflex');
    pos = getpos(legax, 'px');
    Lf.w = pos(3);
    Lf.h = pos(4);
    setappdata(legax, 'legflex', Lf);
end
% If reference object moves or resizes, reposition the legend appropriately

function updatelegpos(src, evt, legax)
if ishandle(legax)
    Lf = getappdata(legax, 'legflex');
    legpos = positionleg(Lf.ref, Lf.w, Lf.h, Lf.anchor, Lf.buffer, Lf.bufunit);
    set(legax, 'Units', Lf.bufferunit, 'Position', legpos);
end

% Since figure resize can change axis size without actually triggering a
% listener, force this

function updatelegfigresize(src, evt)

allax = findall(src, 'type', 'axes');
for ii = 1:length(allax)
    isleg = ~isempty(getappdata(allax(ii), 'legflex'));
    if ~isleg
        pos = get(allax(ii), 'Position');
        set(allax(ii), 'Position', pos); % No change, just trigger PostSet
    end
end

% If plotted object changes, resync with legend

function resyncprops(src, evt, legax)

if ishandle(legax) % In case it's been deleted

    Lf = getappdata(legax, 'legflex');

    str = cellstr(num2str((1:length(Lf.plotobj))'));
    [htmp.leg, htmp.obj, htmp.labeledobj, htmp.textstr] = legend(Lf.plotobj, str);

    objtype = get(Lf.legobj, 'type');
    isline = strcmp(objtype, 'line');
    ispatch = strcmp(objtype, 'patch');
    ishg = strcmp(objtype, 'hggroup');
    hgidx = find(ishg);

    lobj = [Lf.legobj(isline) htmp.obj(isline)];
    pobj = [Lf.legobj(ispatch) htmp.obj(ispatch)];

    if ~isempty(hgidx)
        for ih = hgidx
            chldln1 = findall(Lf.legobj(ih), 'type', 'line');
            chldln2 = findall(htmp.obj(ih), 'type', 'line');

            lobj = [lobj; [chldln1 chldln2]];

            chldpa1 = findall(Lf.legobj(ih), 'type', 'patch');
            chldpa2 = findall(htmp.obj(ih), 'type', 'patch');

            pobj = [pobj; [chldpa1 chldpa2]];

        end
    end

    lprops = {'color','linestyle','linewidth','marker','markersize','markeredgecolor','markerfacecolor'};
    for il = 1:size(lobj,1)
        lvals = get(lobj(il,2), lprops);
        pv = [lprops; lvals];
        set(lobj(il,1), pv{:});
    end

    pprops = {'cdata','cdatamapping','edgealpha','edgecolor','facealpha','facecolor','linestyle','linewidth','marker','markeredgecolor','markerfacecolor','markersize'};
    for ip = 1:size(pobj,1)
        pvals = get(pobj(ip,2), pprops);
        pv = [pprops; pvals];
        set(pobj(ip,1), pv{:});
    end

    cmap = colormap(htmp.leg);
    colormap(legax, cmap);

    delete(htmp.leg);
end

% Wrapper to add multiple callback functions to resize

function wrapper(ObjH, EventData, fcnList)
for ii = 1:length(fcnList)
    feval(fcnList{ii}, ObjH, EventData);
end
getpos.m
function [pos,unit]=getpos(h,fmt,href,opt)
% GETPOS Get graphics object position in a flexible way.
%   GETPOS(H,FMT) gets the position property of graphics object
%   with handle H, according to FMT that can be expressed using different
%   units. H must have a "Position" property.
%
%   FMT is a char array containing four "%2c" strings separated by colon or
%   space. The two characters specify the unit as :
%
%           px  for Pixels
%           nz  for Normalized
%           in  for Inches
%           cm  for Centimeters
%           pt  for Points
%           ch  for Characters
%
%   If FMT is only one format string from the above list, all returned values are
%   expressed using this unit.
%
%   Any string value of FMT can be replaced by a single '#' to not retrieve the
%   corresponding value. The returned value is NaN except if the optional last
%   argument OPT is set to "compact" in GETPOS(H,FMT,[HREF],OPT).
%
%   Note that GETPOS(H) works as get(H,'Position') and return the position
%   vector in the current unit of the graphics object H.
%
%   GETPOS(H,FMT,HREF,['compact']) gets the position of the graphics object H according
%   to FMT, but using the position of the graphics object HREF as reference instead
%   of the parent of H. HREF must be a valid handle and must have a "Position"
%   property (except for the Root object). Returned values may be negative or 0.
%
%   [POS,UNIT]=GETPOS(H,...) returns an additional output argument UNIT that
%   contained the unit list of the output vector position POS. It may be safer
%   when different units are used.
%
%   See also SETPOS, SET, GET.

%   Author: J�r�me Briot, Matlab 6.1.0.450 (R12.1)
%   Contact: dutmatlab@yahoo.fr
%   Revision: 1.0 (12-Feb-2007)
%             1.1 (14-Feb-2007) Third input argument HREF added.
%                               Minor corrections in the help section.
%             1.2 (21-Feb-2007) Bug fixed if HREF is the Root object
%                               Examples removed from the help section
%   Comments:
%

% Check the number of input arguments

narginchk(1,4);


% Check if H is a graphics object handle
if ~ishandle(h)
    error('First argument must be a graphic object handle');
end

% Store the current unit of the graphics object H
current_unit=get(h,'units');

% Init variables
unit={current_unit current_unit current_unit current_unit};
pos=[nan nan nan nan];

% If FMT input argument is not specified, works as GET(H,'Position')
if nargin==1
    pos=get(h,'position');
    return
end

% Check if FMT is a char string
if ~ischar(fmt)
	error('Second argument must be a string in GETPOS(H,FMT)')
end

if nargin==2 % GETPOS(H,FMT)

    href=get(h,'parent');
    opt='full';

elseif nargin==3

    if ishandle(href) % GETPOS(H,FMT,HREF)

        opt='full';

    elseif strcmpi(href,'compact') % GETPOS(H,FMT,"compact")

        href=get(h,'parent');
        opt='compact';

    else % GETPOS(H,FMT,???)
        error('Wrong third argument in GETPOS(H,FMT,???). Must be a valid handle or "compact"');

    end

elseif nargin==4 % GETPOS(H,FMT,HREF,OPT)

    if ~ishandle(href)
        error('Third argument must be a valid handle in GETPOS(H,FMT,HREF,OPT)');
    end

    if ~strcmpi(opt,'compact')
        error('Last argument must be "compact" in GETPOS(H,FMT,HREF,OPT)');
    end

end

flag_href=0;
% Don't use HREF position if it is the parent of H
if href~=get(h,'parent')
    href=h;
    flag_href=1;
end

% Store the current unit of the reference object HREF
current_ref_unit=get(href,'units');

% Extract 4 char strings from FMT
M=strread(fmt,'%s','delimiter',' ,');

% Only one FMT requested for output
if numel(M)==1
    [M{2:4}]=deal(M{1});
end

% List available units
available_units={'inches' 'centimeters' 'normalized' 'points' 'pixels' 'characters'};

% Decode elements of FMT
for n=1:numel(M)

    % If FMT(n) is not a "#"
    if ~strcmp(M{n},'#')

        % Check if the units paramter is valid
        idx=strcmpi(M{n},{'in' 'cm' 'nz' 'pt' 'px' 'ch'});

        if ~any(idx)
            error('Units must be one of "in", "cm", "nz", "pt", "px" or "ch"')
        end

        unit{n}=available_units{idx}; % Set the units to one from the list

    end

end

% Get position of H using decoded FMT
for n=1:numel(M)

    % If FMT(n) is not a "#" => get the value
    if ~strcmp(M{n},'#')

        % Modify the "Units" property of H
        set(h,'units',unit{n});
        % Modify the "Units" property of HREF
        set(href,'units',unit{n});
        % Get the current "Position" vector of H
        temp=get(h,'position');
        % Get the current "Position" vector of HREF
        if strcmp(get(href, 'type'), 'root') % HREF is the Root object (no 'Position' property)
            temp_href=get(href,'screensize'); %%% Should be safe here !
        else temp_href=get(href,'position');
        end
        % Get and store the specified field from the "Position" vector
        % If HREF is specified and is not the parent of H, flag_href=1 else flag_href=0
        pos(n)=temp(n)-temp_href(n)*flag_href;

    end

end

% Check for compact output format
if strcmpi(opt,'compact')
    pos(isnan(pos))=[];
end

% Restore the unit of the graphics object H
set(h,'units',current_unit);
% Restore the unit of the reference object HREF
set(href,'units',current_ref_unit);
02、编写柱状图代码
clc;
clear;
%If you want to adjust the pattern to 6 bar such as " applyhatch(gcf,'.-+/|x');",
%try to type this "applyhatch(gcf,'.-++/||xx');" instedly.
%So you can avoid the duplicated pattern at least, even order problem is still not solved.
data=[100, 200, 900, 1400, 788;111, 222, 333, 444, 555];%三列的柱状图,分为了两种,具体见图
X = [1,2];

GO = bar(X,data,1,'EdgeColor','k','LineWidth',1);

hatchfill2(GO(1),'cross','HatchAngle',45,'HatchDensity',40,'HatchColor','k');
hatchfill2(GO(2),'single','HatchAngle',45,'HatchDensity',40,'HatchColor','k');
hatchfill2(GO(3),'single','HatchAngle',0,'HatchDensity',40,'HatchColor','k');
hatchfill2(GO(4),'single','HatchAngle',-45,'HatchDensity',40,'HatchColor','k');
hatchfill2(GO(5),'cross','HatchAngle',-60,'HatchDensity',30,'HatchColor','k');

GO(1).FaceColor = [0.000, 0.447, 0.741];
GO(2).FaceColor = [0.850, 0.325, 0.098];
GO(3).FaceColor = [0.929, 0.694, 0.125];
GO(4).FaceColor = [0.494, 0.184, 0.556];
GO(5).FaceColor = [0.466, 0.674, 0.188];

% Draw the legend
legendData = {'Legend 1','Legend 2','Legend 3', 'Legend 4', 'Legend 5'};
[legend_h, object_h, plot_h, text_str] = legendflex(GO, legendData, 'Padding', [2, 2, 10], 'FontSize', 11, 'Location', 'NorthEast');
% object_h(1) is the first bar's text
% object_h(2) is the second bar's text
% object_h(3) is the first bar's patch
% object_h(4) is the second bar's patch
%
% Set the two patches within the legend
hatchfill2(object_h(6), 'cross', 'HatchAngle', 45, 'HatchDensity', 40, 'HatchColor', 'k');
hatchfill2(object_h(7), 'single', 'HatchAngle', 45, 'HatchDensity', 40, 'HatchColor', 'k');
hatchfill2(object_h(8), 'single', 'HatchAngle', 0, 'HatchDensity', 40, 'HatchColor', 'k');
hatchfill2(object_h(9), 'single', 'HatchAngle', -45, 'HatchDensity', 40, 'HatchColor', 'k');
hatchfill2(object_h(10), 'cross', 'HatchAngle', -60, 'HatchDensity', 30, 'HatchColor', 'k');
% Some extra formatting to make it pretty :)
set(gca, 'FontSize', 11);
set(gca, 'XMinorTick','on', 'XMinorGrid','on', 'YMinorTick','on', 'YMinorGrid','on');
% xlim([0.5, 2.5]);
ylim([0, 1500]);

% hTitle = title('Texture filled bar chart');
% hXLabel = xlabel('Samples');
hYLabel = ylabel('AAAA');
大概效果如下:
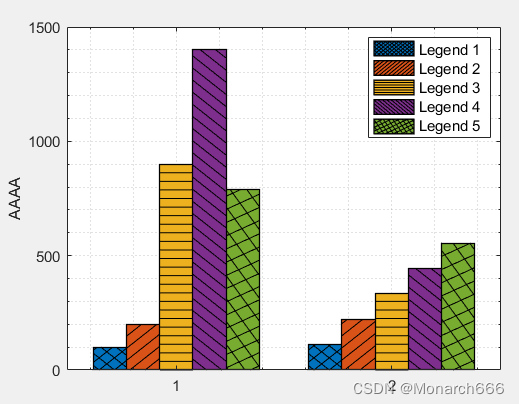
至此就可以优雅的在Matlab的柱状图里填充线条啦,当然也可以用Excel来进行画图,更方便~


 2505
2505

 被折叠的 条评论
为什么被折叠?
被折叠的 条评论
为什么被折叠?
 到【灌水乐园】发言


