


echarts 画散点图, x周,y周在指定位置标志一下
示例一
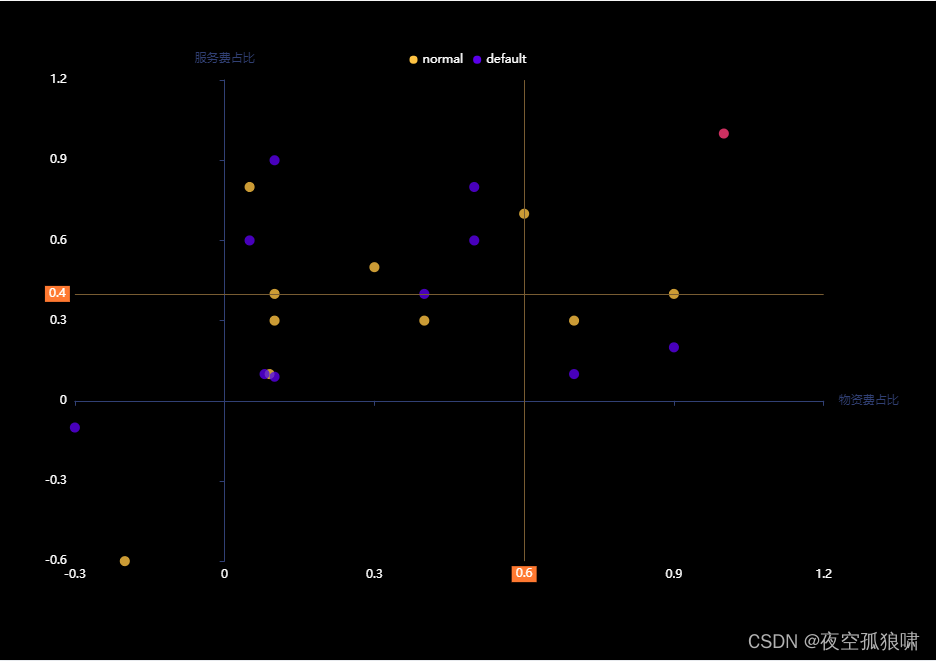
let scatterData = {
   data: [
      [
         [-0.2, -0.6],
         [0.4, 0.3],
         [0.1, 0.4],
         [0.3, 0.5],
         [0.09, 0.1],
         [0.7, 0.3],
         [0.9, 0.4],
         [0.05, 0.8],
         [0.6, 0.7],
         [0.1, 0.3],
      ],
      [
         [-0.3, -0.1],
         [0.7, 0.1],
         [0.4, 0.4],
         [0.5, 0.8],
         [0.05, 0.6],
         [0.1, 0.9],
         [0.9, 0.2],
         [0.08, 0.1],
         [0.5, 0.6],
         [0.1, 0.09],
      ],
      [
         [1,1]
      ]
   ],
   title: ["normal", 'default'],
   x: 0.6,
   y: 0.4,
}

let colorList = [
   "#b33ecb",
   "#ffbe24",
   "#4727f1",
   "#fb3978",
   "#f3954f",
   "#1b3f89",
   "#036ceb",
]

let series = [
   {
      type: "line",
      markLine: {
         silent: true,
         symbol: "none",
         lineStyle: {
            normal: {
               type: "solid",
               color: "#785a2d",
            },
         },
         label: {
            show: true,
            position: "start",
            color: "#fff",
            backgroundColor: "#ff751a",
            padding: [2, 4],
         },
         data: [
            {
               yAxis: scatterData.y, //y轴开始位置
            },
            {
               xAxis: scatterData.x,  //x轴开始位置
            },
         ],
      },
   },
];

scatterData.data.forEach((v, i) => {
   series.push({
      name: scatterData.title[i],
      type: "scatter",
      data: v,
   });
});

option = {
   backgroundColor: '#000',
   color: colorList,
   grid: {
      top: "12%",
      left: "8%",
      right: "12%",
      bottom: "15%",
   },
   tooltip: {
      trigger: "axis",
      axisPointer: {
         type: "cross",
      },
      formatter: (params) => {
         return `<div>
            <span style="color:#fff;display: inline-block;width: 86px;">物资费占比:</span>
            <span style="color:#fff">${params[0].data[0]}</span>
            <br/>
            <span style="color:#fff;display: inline-block;width: 86px;">服务费占比:</span>
            <span style="color:#fff">${params[0].data[1]}</span>
            </div>`;
      },
   },
   legend: {
      top: '8%',
      itemWidth: 8,
      data: scatterData.title,
      orient: "horizontal",
      x: "center", //可设定图例在左、右、居中
      y: "top", //可设定图例在上、下、居中
      padding: [0, 0, 25, 0],
      textStyle: {
         color: "#fff",
      },
   },
   xAxis: {
      name: '物资费占比',
      axisLabel: {
         show: true,
         textStyle: {
            color: "#fff",
         },
      },
      axisLine: {
         show: true,
         lineStyle: {
            type: 'solid',
            color: '#2D4377',
            opacity: 1
         }
      },
      splitLine: {
         show: false,
      },
   },
   yAxis: {
      name: '服务费占比',

      axisLabel: {
         show: true,
         textStyle: {
            color: "#fff",
         },
      },
      axisLine: {
         show: true,
         lineStyle: {
            type: 'solid',
            color: '#2D4377',
            opacity: 1
         }
      },
      splitLine: {
         show: false,
      },
   },
   series: series,
};
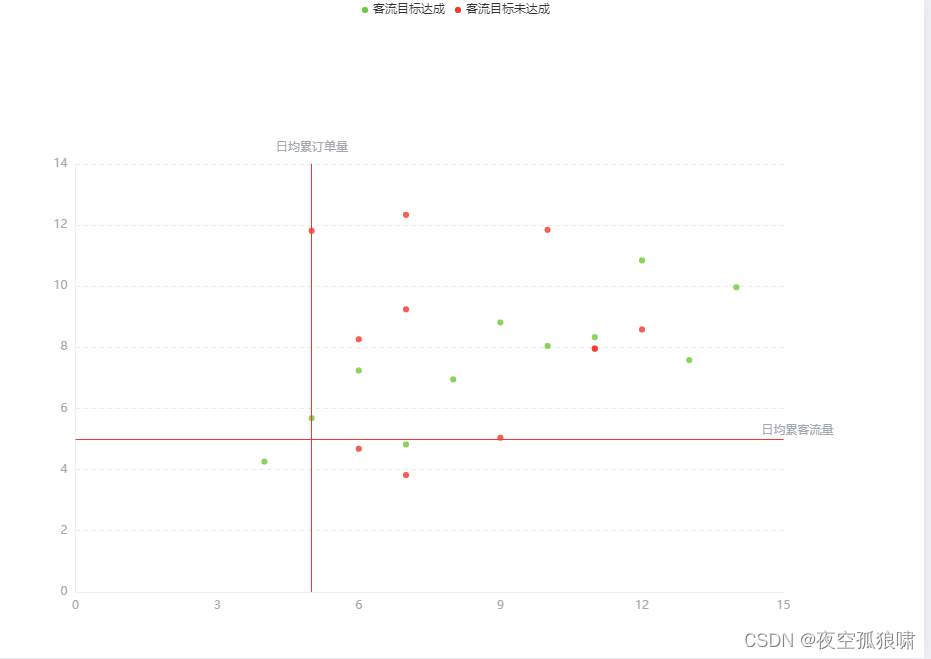
例子二
option = {
                    backgroundColor:'#fff',
                    grid: {
                        top:'25%',
                        left: '7%',
                        right: '15%',
                        bottom: '7%',
                        containLabel: true
                    },
                    tooltip: {
                        trigger: 'axis',
                        textStyle: {
                            color: '#FFF',
                            fontSize:12,
                            // fontFamily: "PingFangSc-Regular, sans-serif",
                            background: 'rgba(255,255,255,0.1)',
                            lineHeight:20
                        },
                        axisPointer: {
                            type: 'shadow',
                            background: 'rgba(255,255,255,0.1)',
                        },
                        position: 'inside',
                    },
                    legend: {
                        top: 0,
                        left:'center',
                        itemWidth: 6, //矩形宽度
                        itemHeight: 6, //矩形宽度
                        data:[
                        {name: '首客订单率目标',icon: 'line'},
                        {name: '客流目标达成'},
                        {name: '客流目标未达成'}
                    ],
                    },
                    xAxis: {
                        axisLine: { //  改变x轴颜色
                            show:true,
                            lineStyle: {
                                color: '#F0EFEF',
                                type:'solid'
                            }
                        },
                    axisTick: {
                            show: false
                        },
                        axisLabel: { //  改变x轴字体颜色和大小
                            textStyle: {
                                color: "#A3A9AF",
                                fontSize: 12
                            },
                        },
                        splitLine: {
                            show:false
                        },
                    },
                    yAxis: {
                        // name:'%',
                        typpe:'dashed',
                        nameTextStyle: {
                            color: '#A3A9AF',
                            padding: [0, 25, 0, 0]
                        },
                        axisLine: { //  改变y轴颜色
                            lineStyle: {
                                color: '#F0EFEF'
                            }
                        },
                        axisTick: {
                            show: false
                        },
                        axisLabel: { //  改变y轴字体颜色和大小
                            //formatter: '{value} m³ ', //  给y轴添加单位
                            textStyle: {
                                color: "#A3A9AF",
                                fontSize: 12
                            },
                        },
                        splitLine: {
                            show:true,
                            lineStyle: {
                                color: "#E9E9E9",
                                type:'dashed'
                            }
                        },
                    },
                    series: [
                       {
                        name: '客流目标达成',
                        type: 'scatter',
                        itemStyle: {
                            color: "#77C620",
                        },
                        symbolSize: 6,
                        data: [[10.0, 8.04],
                        [8.0, 6.95],
                        [13.0, 7.58],
                        [9.0, 8.81],
                        [11.0, 8.33],
                        [14.0, 9.96],
                        [6.0, 7.24],
                        [4.0, 4.26],
                        [12.0, 10.84],
                        [7.0, 4.82],
                        [5.0, 5.68]
],
                    },
                    {
                        name: '客流目标未达成',
                        type: 'scatter',
                        itemStyle: {
                            color: "#F03024",
                        },
                        symbolSize: 6,
                        data: [
                        [9.0, 5.04],
                        [11.0, 7.95],
                        [12.0, 8.58],
                        [5.0, 11.81],
                        [7.0, 12.33],
                        [11.0, 7.96],
                        [7.0, 9.24],
                        [6.0, 8.26],
                        [10.0, 11.84],
                        [7.0, 3.82],
                        [6.0, 4.68]
                    ]
                    },
                    {
                        name: '',
                        type: 'line',
                            markLine: {
                                symbol: 'none',
                                silent: true,
                                lineStyle: {
                                    type: 'solid',
                                    width: 1,
                                    color: '#F03024',
                                },
                                label: {
                                    // show: false
                                    color:'#A3A9AF',
                                    distance: [-25,8,0,0],
                                    padding:[-15,2,2,3],
                                    formatter: function(params) {
                                        return params.name;
                                    }
                                },
                                data:[{name:'日均累客流量',yAxis:5},{name:'日均累订单量',xAxis:5}]
                            }
                        }
                    ]
                }
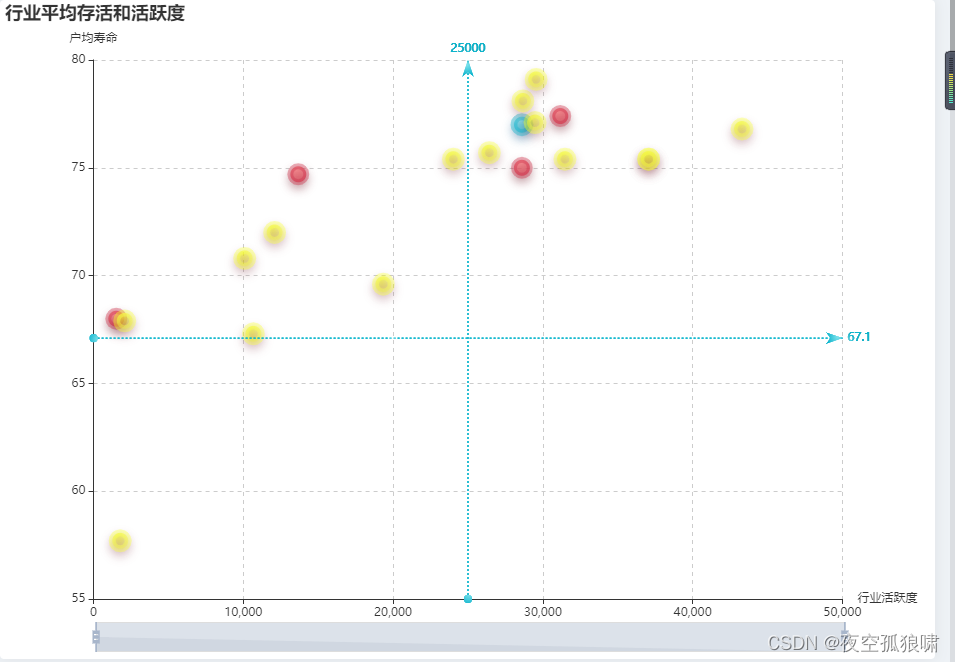
示例三
var data = [
    [
        [28604, 77, 252847810, '农、林、牧、渔业', '1']
    ],
    [
        [31163, 77.4, 252847810, '采矿业', '2'],
        [1516, 68, 252847810, '制造业', '2'],
        [13670, 74.7, 252847810, '电力、热力、燃气及水生产和供应业', '2'],
        [28599, 75, 252847810, '建筑业', '2']
    ],
    [
        [29476, 77.1, 252847810, '批发和零售业', '3'],
        [31476, 75.4, 252847810, '交通运输、仓储和邮政业', '3'],
        [28666, 78.1, 252847810, '住宿和餐饮业', '3'],
        [1777, 57.7, 252847810, '信息传输、软件和信息技术服务业', '3'],
        [29550, 79.1, 252847810, '金融业', '3'],
        [2076, 67.9, 252847810, '房地产业', '3'],
        [12087, 72, 252847810, '租赁和商务服务业', '3'],
        [24021, 75.4, 252847810, '科学研究和技术服务业', '3'],
        [43296, 76.8, 252847810, '水利、环境和公共设施管理业 ', '3'],
        [10088, 70.8, 252847810, '居民服务、修理和其他服务业 ', '3'],
        [19349, 69.6, 252847810, '教育', '3'],
        [10670, 67.3, 252847810, '卫生和社会工作', '3'],
        [26424, 75.7, 252847810, '文化、体育和娱乐业', '3'],
        [37062, 75.4, 252847810, '公共管理、社会保障和社会组织', '3'],
        [37062, 75.4, 252847810, '国际组织', '3']
    ]
];

var dataxAxis = 25000;
var datayAxis = 67.1;
option = {

    title: {
        text: '行业平均存活和活跃度'
    },
    dataZoom: [{
        id: 'dataZoomX',
        type: 'inside',
        xAxisIndex: [0],
        filterMode: 'filter'
    }, {
        id: 'dataZoomy',
        type: 'slider',
        xAxisIndex: [0],
        filterMode: 'empty'
    }],
    xAxis: {
        name: '行业活跃度',
        splitLine: {
            show: true,
            interval: 'auto',
            lineStyle: {
                type: 'dashed'
            }
        }
    },
    yAxis: {
        name: '户均寿命',
        splitLine: {
            show: true,
            interval: 'auto',
            lineStyle: {
                type: 'dashed'
            }
        },
        scale: true
    },
    series: [{
        name: '1',
        data: data[0],
        type: 'scatter',
        symbolSize: function(data) {
            return Math.sqrt(data[2]) / 10e2;
        },
        label: {
            emphasis: {
                show: true,
                formatter: function(param) {
                    return param.data[3];
                },
                position: 'top'
            }
        },
        itemStyle: {
            normal: {
                shadowBlur: 10,
                shadowColor: 'rgba(25, 100, 150, 0.5)',
                shadowOffsetY: 5,
                color: new echarts.graphic.RadialGradient(0.4, 0.3, 1, [{
                    offset: 0,
                    color: 'rgb(129, 227, 238)'
                }, {
                    offset: 1,
                    color: 'rgb(25, 183, 207)'
                }]),
                borderColor: 'rgba(25, 183, 207, 0.5)',
                borderWidth: 7
            }
        },
        markLine: {
            lineStyle: {
                normal: {
                    type: 'dotted'
                }
            },
            data: [{
                xAxis: dataxAxis
            }, {
                yAxis: datayAxis
            }]
        }
    }, {
        name: '2',
        data: data[1],
        type: 'scatter',
        symbolSize: function(data) {
            return Math.sqrt(data[2]) / 10e2;
        },
        label: {
            emphasis: {
                show: true,
                formatter: function(param) {
                    return param.data[3];
                },
                position: 'top'
            }
        },
        itemStyle: {
            normal: {
                shadowBlur: 10,
                shadowColor: 'rgba(120, 36, 50, 0.5)',
                shadowOffsetY: 5,
                color: new echarts.graphic.RadialGradient(0.4, 0.3, 1, [{
                    offset: 0,
                    color: 'rgb(251, 118, 123)'
                }, {
                    offset: 1,
                    color: 'rgb(204, 46, 72)'
                }]),
                borderColor: 'rgba(204, 46, 72, 0.5)',
                borderWidth: 6
            }
        },
        markLine: {
            lineStyle: {
                normal: {
                    type: 'dotted',
                    color: 'bule'
                }
            },
            data: [{
                xAxis: dataxAxis
            }, {
                yAxis: datayAxis
            }]
        }
    }, {
        name: '3',
        data: data[2],
        type: 'scatter',
        symbolSize: function(data) {
            return Math.sqrt(data[2]) / 10e2;
        },
        label: {
            emphasis: {
                show: true,
                formatter: function(param) {
                    return param.data[3];
                },
                position: 'top'
            }
        },
        itemStyle: {
            normal: {
                shadowBlur: 10,
                shadowColor: 'rgba(120, 36, 50, 0.5)',
                shadowOffsetY: 5,
                color: new echarts.graphic.RadialGradient(0.4, 0.3, 1, [{
                    offset: 0,
                    color: 'rgba(255, 255, 0, 1)'
                }, {
                    offset: 1,
                    color: 'rgba(255, 255, 0, 0)'
                }]),
                borderColor: 'rgba(255, 255, 0, 0.5)',
                borderWidth: 7
            }
        },
        markLine: {
            lineStyle: {
                normal: {
                    type: 'dotted',
                    color: 'bule'
                }
            },
            data: [{
                xAxis: dataxAxis
            }, {
                yAxis: datayAxis
            }]
        }
    }]

};


 7645
7645


 被折叠的 条评论
为什么被折叠?
被折叠的 条评论
为什么被折叠?
 到【灌水乐园】发言


