


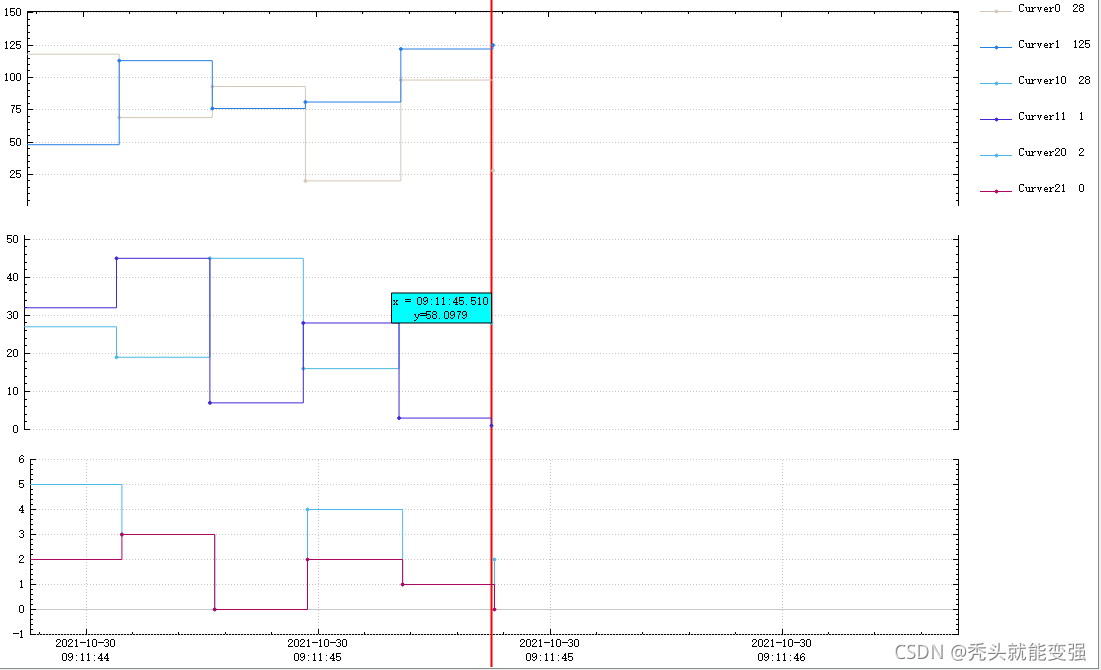
三个水平的坐标系,如图
首先说明,本案列是直接继承QCustomPlot,如果是需要通过非继承方式,自行将其中的this关键字替换为QCustomPlot* X 的X;文中有些代码省略了this,自行判断。
一、添加多个坐标系
步骤如下:
this->setInteractions(QCP::iRangeDrag //可平移
                          | QCP::iRangeZoom //可滚轮缩放
                          | QCP::iSelectPlottables //可选中曲线
                          | QCP::iSelectLegend );//可选中图例
//! 1.清空布局中默认的坐标系及其他控件
this->plotLayout()->clear();

/*  在.h文件中定义好的需要使用的控件
QCPAxisRect * A0_5;			//坐标系 1
QCPAxisRect * A0_50;		//坐标系 2
QCPAxisRect * V0_150;		//坐标系 3
QCPItemTracer* tracer;		//游标
QCPItemText* tracerLabel;	//游标标签
*/
V0_150 = nullptr;
A0_50 = nullptr;
A0_5 = nullptr;
legend = nullptr;
tracer = nullptr;
tracerLabel = nullptr;

//! 2.创建游标及游标标签
tracer_init();
/* 创建代码就在此处注释中描述,实际使用中写在对应方法中
    if(tracer == nullptr)
    {
        tracer = new QCPItemTracer(this);
        tracer->setInterpolating(false);//禁用插值
        tracer->setPen(QPen(QBrush(QColor(Qt::red)),Qt::DashLine));//虚线游标
        tracer->setStyle(QCPItemTracer::tsCrosshair);//游标样式:十字星、圆圈、方框


        tracerLabel = new QCPItemText(this);
        tracerLabel->setLayer("overlay");
        tracerLabel->setPen(QPen(Qt::black));
        tracerLabel->setBrush(Qt::cyan);
        tracerLabel->setPadding(QMargins(2,2,2,2));//边界宽度
        tracerLabel->setPositionAlignment(Qt::AlignLeft | Qt::AlignTop);// 标签显示位置,左上
        tracerLabel->position->setParentAnchor(tracer->position); // 标签跟随游标
    }
*/

//! 3. 添加坐标系  三个坐标系的创建、样式属性分别在不同方法进行,方便维护
V0_150_init();
A0_50_init();
A0_5_init();
/* 坐标系的创建过程就不多余的描述,以注释中代码为例
	// 以智能指针方式定义dateTicker
    QSharedPointer<QCPAxisTickerDateTime> dateTicker(new QCPAxisTickerDateTime);
    dateTicker->setDateTimeFormat("yyyy-MM-dd\nhh:mm:ss"); // 设置以时间为X轴单位
    V0_150 = new QCPAxisRect(this, true);	// 创建坐标系
    V0_150->axis(QCPAxis::atBottom)->setTicker(dateTicker); // 将时间轴设置在坐标系中
    V0_150->axis(QCPAxis::atLeft)->setRange(0,150);	// 设置Y轴范围
    V0_150->setupFullAxesBox(true);    // 让四个轴关联,并全部显示出来
    V0_150->setRangeDrag(Qt::Horizontal | Qt::Vertical); //水平方向拖动 | 垂直方向移动
    V0_150->setRangeZoom(Qt::Horizontal | Qt::Vertical); //水平方向缩放 | 垂直方向缩放
    //如果是固定坐标系数量,可直接将坐标系添加如布局,\ 此处是动态添加和删除坐标系,所有魏加入布局
    //this->plotLayout()->addElement(axisRectCount(),0,V0_150); //axisRectCount()获取布局中坐标系个数
//! 4. legend
/*  if(legend == nullptr)
    {
        legend = new QCPLegend;
        legend->setVisible(true);
//        plotLayout()->addElement(legend); //加入布局
//! 注释:此处未加入布局和设置拉伸比的原因如下:由于初始第一个坐标系和legend中都没有数据,legend高度会在布局中影响坐标系的高度。
所有在添加图层前将legend加入布局即可(如果有方法解决这个问题,可直接添加如布局)
//        plotLayout()->setColumnStretchFactor(1, 0.001); //设置行拉伸比例,将legend的宽度最小化
        connect(this, SIGNAL(selectionChangedByUser()), this, SLOT(when_selectionChangedByUser()));
        connect(this, SIGNAL(legendDoubleClick(QCPLegend*, QCPAbstractLegendItem*, QMouseEvent*)), this, SLOT(when_legendDoubleClick(QCPLegend*, QCPAbstractLegendItem*, QMouseEvent*)));
    }
*/

//! 5. 坐标系某些轴的隐藏
//axis_style_init(); //每添加或删除一个坐标系 或 同时添加或删除多个坐标系 调用一次
*/
//! MyCustomPlot::QCustomPlot
//! 以3个坐标系为例
void MyCustomPlot::axis_style_init()
{
    int index = 0;

    if(axisRectCount() == 2)
    {
        foreach (auto *rect, axisRects())
        {
            index++;
            if(index == 1)
            {
                rect->axis(QCPAxis::atTop)->setVisible(true);
                rect->axis(QCPAxis::atBottom)->setVisible(false);
            }
            else if(index == 2){
                rect->axis(QCPAxis::atTop)->setVisible(false);
                rect->axis(QCPAxis::atBottom)->setVisible(true);
            }
        }


    }
    else if(axisRectCount() == 3)
    {
        foreach (auto *rect, axisRects())
        {
            index++;
            if(index == 1)
            {
                rect->axis(QCPAxis::atTop)->setVisible(true);
                rect->axis(QCPAxis::atBottom)->setVisible(false);
            }
            else if(index == 2){
                rect->axis(QCPAxis::atTop)->setVisible(false);
                rect->axis(QCPAxis::atBottom)->setVisible(false);
            }
            else if(index == 3)
            {
                rect->axis(QCPAxis::atTop)->setVisible(false);
            }
        }
    }
}
void MyCustomPlot::add_axis(int index) // 0 1 3 分别区别三个坐标系
{
    if(axisRectCount() >= 3) return;
    switch (index) {
    case 0:
        if(V0_150 == nullptr){	//若为空指针,调用函数
            V0_150_init();
            if(A0_50 != nullptr) //若不为空指针,建立信号槽,同步X轴,注意建立双向连接
            {
                connect(V0_150->axis(QCPAxis::atBottom), SIGNAL(rangeChanged(QCPRange)), A0_50->axis(QCPAxis::atBottom), SLOT(setRange(QCPRange)));
                connect(A0_50->axis(QCPAxis::atBottom), SIGNAL(rangeChanged(QCPRange)), V0_150->axis(QCPAxis::atBottom), SLOT(setRange(QCPRange)));
            }
            if(A0_5 != nullptr)	// 同理
            {
                connect(V0_150->axis(QCPAxis::atBottom), SIGNAL(rangeChanged(QCPRange)), A0_5->axis(QCPAxis::atBottom), SLOT(setRange(QCPRange)));
                connect(A0_5->axis(QCPAxis::atBottom), SIGNAL(rangeChanged(QCPRange)), V0_150->axis(QCPAxis::atBottom), SLOT(setRange(QCPRange)));
            }
        }
        plotLayout()->addElement(axisRectCount(),0,V0_150); // 将坐标系加入布局
        break;
    case 1:
        if(A0_50 == nullptr){
            A0_50_init();
            if(V0_150 != nullptr){
                connect(A0_50->axis(QCPAxis::atBottom), SIGNAL(rangeChanged(QCPRange)), V0_150->axis(QCPAxis::atBottom), SLOT(setRange(QCPRange)));
                connect(V0_150->axis(QCPAxis::atBottom), SIGNAL(rangeChanged(QCPRange)), A0_50->axis(QCPAxis::atBottom), SLOT(setRange(QCPRange)));
            }
            if(A0_5 != nullptr){
                connect(A0_50->axis(QCPAxis::atBottom), SIGNAL(rangeChanged(QCPRange)), A0_5->axis(QCPAxis::atBottom), SLOT(setRange(QCPRange)));
                connect(A0_5->axis(QCPAxis::atBottom), SIGNAL(rangeChanged(QCPRange)), A0_50->axis(QCPAxis::atBottom), SLOT(setRange(QCPRange)));
            }
        }
        plotLayout()->addElement(axisRectCount(),0,A0_50);
        break;
    case 2:
        if(A0_5 == nullptr){
            A0_5_init();
            if(A0_50 != nullptr){
                connect(A0_5->axis(QCPAxis::atBottom), SIGNAL(rangeChanged(QCPRange)), A0_50->axis(QCPAxis::atBottom), SLOT(setRange(QCPRange)));
                connect(A0_50->axis(QCPAxis::atBottom), SIGNAL(rangeChanged(QCPRange)), A0_5->axis(QCPAxis::atBottom), SLOT(setRange(QCPRange)));
            }
            if(V0_150 != nullptr){
                connect(A0_5->axis(QCPAxis::atBottom), SIGNAL(rangeChanged(QCPRange)), V0_150->axis(QCPAxis::atBottom), SLOT(setRange(QCPRange)));
                connect(V0_150->axis(QCPAxis::atBottom), SIGNAL(rangeChanged(QCPRange)), A0_50->axis(QCPAxis::atBottom), SLOT(setRange(QCPRange)));
            }
        }
        plotLayout()->addElement(axisRectCount(),0,A0_5);
        break;
    default:
        break;
    }

    legend_init(); // 创建legend,根据自己需要创建
    axis_style_init();// 调整坐标系样式
    plotLayout()->simplify(); //简化布局
    replot(QCustomPlot::rpQueuedReplot); //刷新
}
void MyCustomPlot::delete_axis(int index)
{
    if(axisRectCount() <= 0) return;//axisRectCount()布局中坐标系数量
    switch (index) {
    case 0:
        if(V0_150 == nullptr) return;
        clearDataAndDeleteGraph(0);                 // 1. 清除数据,移除图层 不清除数据和图层,legend会保留信息,在legend点击事件发送时会程序崩溃
        plotLayout()->remove(axisRect(index));      // 2. 从布局中删除坐标系  并 delete
        plotLayout()->simplify();                   // 3. 简化布局
													// 2.3步骤是从布局中删除坐标系的关键,可自行测试无某一步骤造成的影响
        V0_150 = nullptr;  //避免成为野指针
        break;
    case 1:
        if(A0_50 == nullptr) return;
        clearDataAndDeleteGraph(1);
        plotLayout()->remove(axisRect(index));
        plotLayout()->simplify();

        A0_50 = nullptr;
        break;
    case 2:
        if(A0_5 == nullptr) return;
        clearDataAndDeleteGraph(2);
        plotLayout()->remove(axisRect(index));
        plotLayout()->simplify();

        A0_5 = nullptr;
        break;
    default:
        break;
    }

    if(axisRectCount() <= 0 && legend != nullptr) // customplot中无坐标系,删除legend
    {
        plotLayout()->remove(legend);
        plotLayout()->simplify();
        legend = nullptr;
    }
    else if(axisRectCount() > 0 && legend != nullptr)
    {
        plotLayout()->take(legend);
        plotLayout()->simplify();
        plotLayout()->addElement(legend);
        plotLayout()->setColumnStretchFactor(1, 0.001);
    }
    axis_style_init();
    replot(QCustomPlot::rpQueuedReplot);
}
void MyCustomPlot::clearDataAndDeleteGraph(int index)
{	//! graph_Map保存了每一个图层指针graph_Map的key为 坐标系的type*10+idx, type就等于此函数中的index
	//void MyCustomPlot::addData(int idx, double key, double value, int type)
    for(QMap<int,QCPGraph*>::Iterator it = graph_Map.begin(); it != graph_Map.end(); it++)
    {
        if(it.key()/10 == index)
        {
            if(it.value() != nullptr)
            {
                QCPGraph* graph = it.value();
                graph->data().data()->clear(); //清除数据
                graph_Map.remove(it.key()); //在移除Map
                removeGraph(graph); //移除图层,不要自己delete,调用此函数自动delete
                replot(QCustomPlot::rpQueuedReplot);
            }
        }
    }
}
// 判断数据加入的坐标系
void MyCustomPlot::addData(int idx, double key, double value, int type)
{
    if(!plotLayout()->hasElement(0,1) && legend != nullptr) // 将legend加入布局,一样的道理,自己选中合适的位置加入
    {
        plotLayout()->addElement(legend);
        plotLayout()->setColumnStretchFactor(1, 0.001);
    }
    switch (type) {
    case 0:
        if(V0_150 == nullptr) return;
        addData(idx+type*10, key, value, V0_150);
        break;
    case 1:
        if(A0_50 == nullptr) return;
        addData(idx+type*10, key, value, A0_50);
        break;
    case 2:
        if(A0_5 == nullptr) return;
        addData(idx+type*10, key, value, A0_5);
        break;
    default:
        break;
    }
}

void MyCustomPlot::addData(int idx, double key, double value,QCPAxisRect* rect)
{
    QCPGraph* _graph;
    if(!graph_Map.contains(idx)) // 判断当前数据是否已有图层
    {	//创建图层并加入Map
        graph_Map.insert(idx, addGraph(rect->axis(QCPAxis::atBottom),rect->axis(QCPAxis::atLeft)));

        _graph = graph_Map.value(idx);
        _graph->setLineStyle(QCPGraph::lsStepLeft);        //设置连线类型
        _graph->setPen(QPen(QColor(qrand()%256, qrand()%256, qrand()%256),1)); //随机曲线颜色,qsrand(QTime(0,0,0).secsTo(QTime::currentTime())); 提前添加
        _graph->setScatterStyle(QCPScatterStyle(QCPScatterStyle::ssDisc, 3));        //显示散点数据
        _graph->addData(key, value); //添加数据
        if(!isMove){
            rect->axis(QCPAxis::atBottom)->setRange(key-1,key+1);
            rect->axis(QCPAxis::atLeft)->setRange(value-1,value+1);
        }
        LengedName_Map.insert(idx,QString("Curver%1").arg(idx));
        _graph->setName(LengedName_Map.value(idx));
        XRange = rect->axis(QCPAxis::atBottom)->range();
        YRange = rect->axis(QCPAxis::atLeft)->range();
    }
    else
    {
        _graph = graph_Map.value(idx);
        _graph->addData(key, value);
        if(!isMove){
            rect->axis(QCPAxis::atBottom)->setRange(key-1,key+1);
            rect->axis(QCPAxis::atLeft)->setRange( value-1 < rect->axis(QCPAxis::atLeft)->range().lower ? value-1 : rect->axis(QCPAxis::atLeft)->range().lower, value+1 > rect->axis(QCPAxis::atLeft)->range().upper ? value+1 : rect->axis(QCPAxis::atLeft)->range().upper);
        }
        _graph->setName(QString("%1  %2").arg(LengedName_Map.value(idx)).arg(value));
    }
    replot(QCustomPlot::rpQueuedReplot);                 //刷新图表
}
void MyCustomPlot::mousePressEvent(QMouseEvent *event)
{
    QCustomPlot::mousePressEvent(event);
    isMove = true;

}

void MyCustomPlot::mouseMoveEvent(QMouseEvent *event)
{
    QCustomPlot::mouseMoveEvent(event);

    if(tracer == nullptr || tracerLabel == nullptr || axisRectCount() <= 0 || tracer->graph() == nullptr) return;
    if(tracer->visible())
    {
        if(tracerGraph){

            QCPAxisRect* rect = nullptr;

            int key = graph_Map.key(tracerGraph,-1);
            if(key == -1) return;
            else if(key/10 == 0){
                rect = V0_150;
            }
            else if(key/10 == 1){
                rect = A0_50;
            }
            else if(key/10 == 2){
                rect = A0_5;
            }
            else
                return;

            double x = rect->axis(QCPAxis::atBottom)->pixelToCoord(event->pos().x());//像素坐标转plot坐标
            tracer->setGraphKey(x);
            tracer->updatePosition(); //使得刚设置游标的横纵坐标位置生效
            double y = rect->axis(QCPAxis::atLeft)->pixelToCoord(event->pos().y());
            QString xTime = QDateTime::fromMSecsSinceEpoch(x * 1000.0).toString("hh:mm:ss.zzz");
            tracerLabel->setText(QString("x = %1\ny=%2").arg(xTime).arg(y));
            replot(QCustomPlot::rpQueuedReplot);
        }
    }
}

void MyCustomPlot::mouseReleaseEvent(QMouseEvent *event)
{
    QCustomPlot::mouseReleaseEvent(event);
    isMove = false;
}

void MyCustomPlot::when_selectionChangedByUser()
{
    for (QMap<int,QCPGraph*>::iterator it = graph_Map.begin(); it != graph_Map.end();it++)
    {
        QCPGraph *graph = it.value();
        if(graph == nullptr) return;
        QCPPlottableLegendItem *item = legend->itemWithPlottable(graph);
        if (item->selected() || graph->selected())//选中了哪条曲线或者曲线的图例
        {
            tracerGraph = graph;
            if(tracer != nullptr){
                tracer->setGraph(tracerGraph);
            }

            item->setSelected(true);

            QPen pen;
            pen.setWidth(3);
            pen.setColor(Qt::blue);
            graph->selectionDecorator()->setPen(pen);

            graph->setSelection(QCPDataSelection(graph->data()->dataRange()));

        }

    }
}

/*
双击图例修改曲线颜色
*/
void MyCustomPlot::when_legendDoubleClick (QCPLegend *legend, QCPAbstractLegendItem *legendItem, QMouseEvent *event)
{
    Q_UNUSED(legend);
    Q_UNUSED(event);
    qDebug()<<"when_legendDoubleClick (QCPLegend *legend, QCPAbstractLegendItem *legendItem, QMouseEvent *event)";

    for (int i = 0; i < this->graphCount(); ++i)
    {
        QCPGraph *pGraph = this->graph(i);
        if(legendItem == this->legend->itemWithPlottable(pGraph))//查询被点击的图例项是哪个graph的图例项
        {
            QColor newColor = QColorDialog::getColor(Qt::red,this,"选择新颜色");
            if(newColor.isValid())//用户点击了确定
            {
                pGraph->setPen(QPen(newColor,1));
                replot(QCustomPlot::rpQueuedReplot);
            }
        }
    }
}


 1082
1082


 被折叠的 条评论
为什么被折叠?
被折叠的 条评论
为什么被折叠?
 到【灌水乐园】发言


