


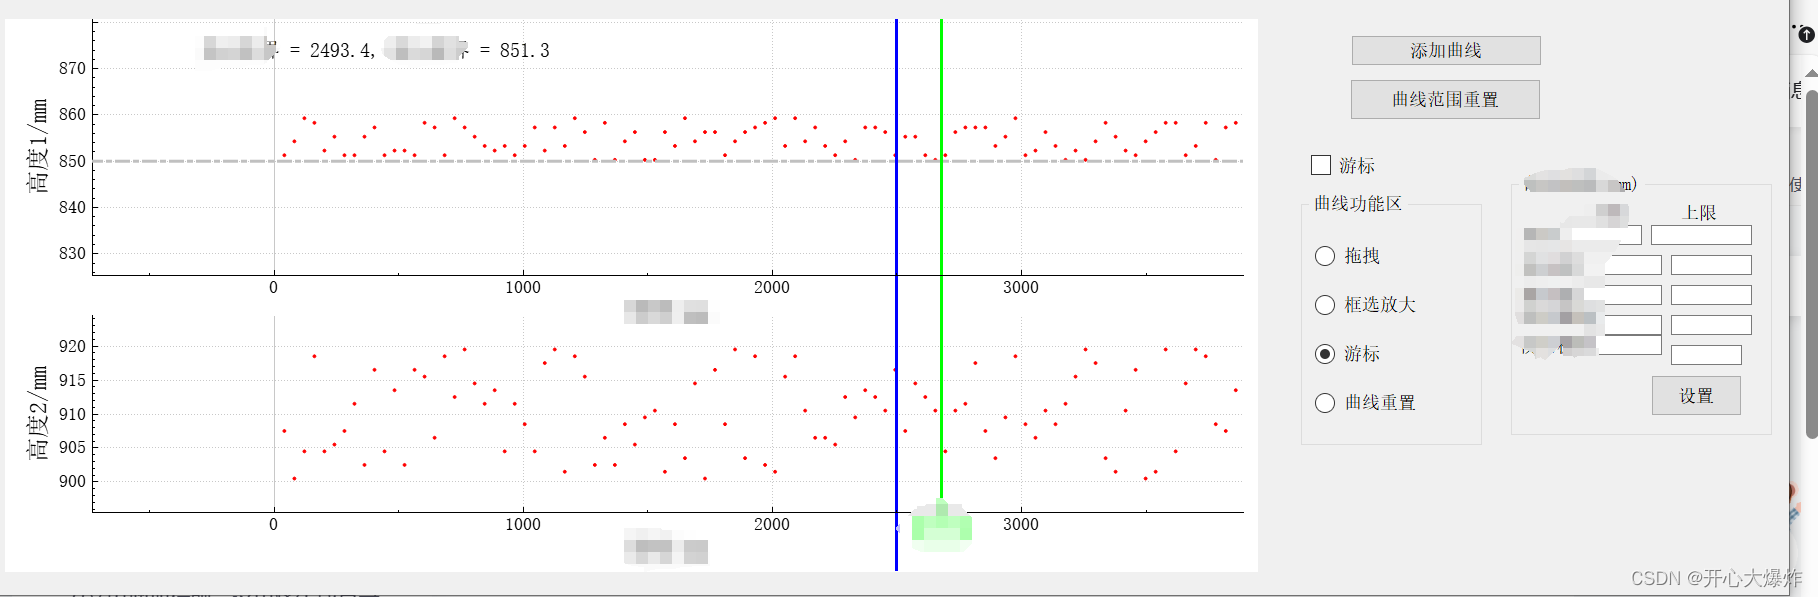
如下图所示,本文主要包含的功能有:
1.画多个坐标系,且坐标系联动
2.画一个贯穿多个坐标系的直线;
3.画一个矩形,并填充颜色;
4.曲线范围重置;
5.根据鼠标位置,定位离鼠标最近的数据,显示数据序列,数据大小;
6.曲线上显示文字;
7.曲线拖拽、框选放大、游标、重置,及多个radio按钮的响应管理
如下图所示,曲线绘图区,存在2个坐标系,两个坐标系X轴方向是联动的,现在需要画一条直线,能够贯穿两个坐标系
1.一个QCustomplot上 有 2个坐标系
主要思路是: QCustomplot中默认布局是QCPLayoutGrid *plotLayout()
std::vector<QCPAxisRect *> m_pCPAxisRect;//两个坐标轴
this->plotLayout()->addElement(0, 0, m_pCPAxisRect[0]);
this->plotLayout()->addElement(1, 0, m_pCPAxisRect[1]);
先往m_pCPAxisRect[0] 里面 填充 曲线、标签啥的,然后再this->plotLayout()->addElement
2.多个坐标系联动
多个坐标系联动,此处是x 轴联动,如果对坐标系1拖拽X轴,则其他坐标系的X轴范围与坐标系1是一样的。
int nCount = m_pCPAxisRect.size();
    for (int i = 0; i < nCount; ++i) {
        for (int j = i+1; j < nCount; ++j)
        {
            connect(m_pCPAxisRect.at(i)->axis(QCPAxis::atBottom), SIGNAL(rangeChanged(QCPRange)), m_pCPAxisRect.at(j)->axis(QCPAxis::atBottom), SLOT(setRange(QCPRange)));
            connect(m_pCPAxisRect.at(j)->axis(QCPAxis::atBottom), SIGNAL(rangeChanged(QCPRange)), m_pCPAxisRect.at(i)->axis(QCPAxis::atBottom), SLOT(setRange(QCPRange)));
        }

    }
3. 贯穿多个坐标系的游标直线
   m_pItemline = new QCPItemLine(this);
   m_pItemline->setPen(QPen(Qt::green, 3, Qt::SolidLine));//避免宽度大于1的线

    m_pItemline->start->setCoords(305, 0);  // location of point 1 in plot coordinate
    m_pItemline->end->setCoords(305, 500);  // location of point 2 in plot coordinate
    //在整个
最低0.47元/天 解锁文章


 3326
3326


 被折叠的 条评论
为什么被折叠?
被折叠的 条评论
为什么被折叠?
 到【灌水乐园】发言


