


最近接到一个需求,一个数据展示类的大屏 其中一块设计到一个离线3D行政图的渲染,过程曲折,顺道记录一下,免得以后再踩坑
效果图
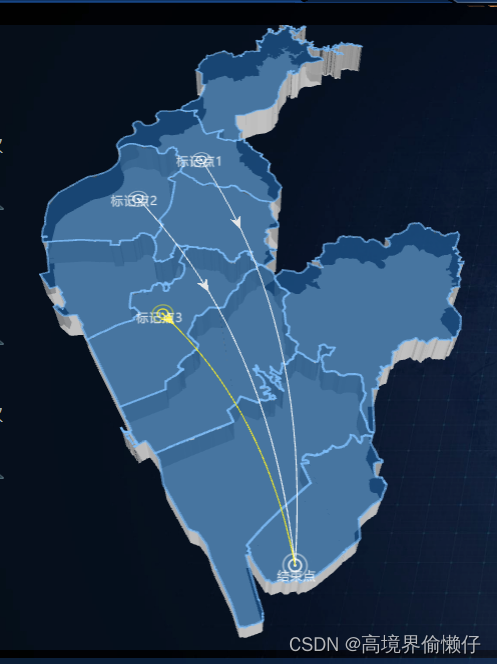
需求分析:
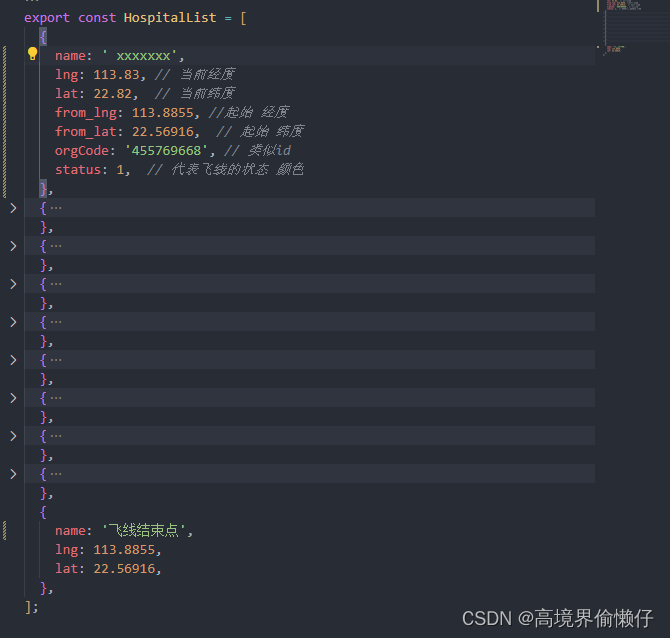
获取数据
   jes数据格式,只要不到街道级别  网上免费的很多。到街道直接去淘宝
   类似下面的数据结构

再准备一份标点数据
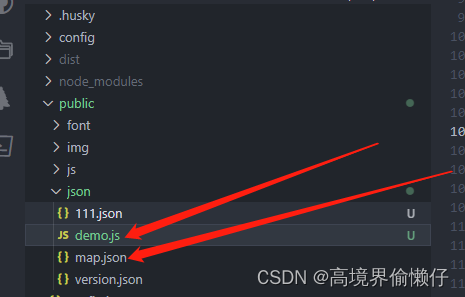
根目录
刚刚准备的两份文件
完整代码
import { HomeController } from '@/services';
import { LineLayer, PointLayer, PolygonLayer, Scene } from '@antv/l7';
import { Mapbox } from '@antv/l7-maps';
import { useRequest } from 'ahooks';
import { useEffect, useRef, useState } from 'react';
import { demoData} from '../../../../../public/json/demo';
import ArrowSvg from './../../../../assets/home/arrow.svg';
import ArrowSvgH from './../../../../assets/home/arrowH.svg';
import './index.less';

const Map = () => {

  const sceneRef = useRef<Scene | null>();
  const [baseData, setBaseData] =
    useState<HOME_TYPE.OrgTypeReal[]>(demoData);

   //  轮询接口   你可能不适用
  const { run } = useRequest(HomeController.getOrgData, {
    pollingInterval: 60000,
    pollingErrorRetryCount: 3,
    onSuccess: (data) => {
      let arr: HOME_TYPE.OrgTypeReal[] = [];
      data?.map((item: HOME_TYPE.OrgType) => {
        HospitalList.forEach((ite) => {
          if (item.orgCode.toUpperCase() === ite.orgCode) {
            arr.push({
              ...ite,
              status: item.status,
              name: item.orgName,
            });
          }
        });
      });

      const arr1: any = demoData.filter(
        (item) => item.name === '飞线起始点',
      );
      setBaseData(arr.concat(arr1));
    },
  });
  useEffect(() => {
    run();
  }, []);
  useEffect(() => {
    const id = document.getElementById('map');
    if (id) {
      if (sceneRef.current) {
        sceneRef.current.destroy();
        sceneRef.current = null;
      }
      sceneRef.current = new Scene({
        id: 'map',
        map: new Mapbox({
          style: 'blank',
          pitch: 30,   // 倾斜度
          center: [113.828671, 22.754741],
          zoom: 8,
        }),
        logoVisible: false,  // 不展示logo
      });
      const scene = sceneRef.current;

      scene.addImage('plane', ArrowSvg);
      scene.addImage('planeH', ArrowSvgH);
      scene.on('loaded', () => {
        fetch('/json/map.json')
          .then((res) => res.json())
          .then((data) => {
            // 绘制地图板块
            const provincelayer = new PolygonLayer({ autoFit: true, zIndex: 5 })
              .source(data) //使用的数据为下载到本地的json数据
              .shape('extrude') //用于绘制几何体
              .size(15000)
              .color('#1C74C0')
              .style({
                // mapTexture: mapBgImg,   //如果想使用纹理贴图,shap必须为extrude
                heightfixed: true, //抬升高度是否随 zoom 变化
                vertexHeightScale: 2000,
                raisingHeight: 20000, //抬升高度
                sourceColor: '#fff', //抬高高度的颜色
                targetColor: '#fff',
                opacity: 0.8,
                pickLight: true,
              });
            const provincelayerDown = new PolygonLayer({ autoFit: true })
              .source(data) //使用的数据为下载到本地的json数据
              .shape('fill') //用于绘制几何体
              .size(2)
              .color('#fff')
              .style({
                // mapTexture: mapBgImg,   //如果想使用纹理贴图,shap必须为extrude
                // heightfixed: true, //抬升高度是否随 zoom 变化
                raisingHeight: 20000, //抬升高度
                // // sourceColor: '#fff', //抬高高度的颜色
                // // targetColor: '#fff',
                // opacity: 1,
                // pickLight: true
              });
            const NamePoint = new PointLayer({
              zIndex: 2200,
              textOffset: [0, -50],
            })
              .source(baseData, {
                parser: {
                  type: 'json',
                  x: 'lng',
                  y: 'lat',
                },
              })
              .shape('name', 'text')
              .color('#fff')
              .animate(true)
              .style({
                // gamma: "#fff",
                halo: 1,
                raisingHeight: 15000,
              })
              .size(12);
            const dotPoint = new PointLayer({ zIndex: 25, depth: false })
              .source(baseData, {
                parser: {
                  type: 'json',
                  x: 'lng',
                  y: 'lat',
                },
              })
              .shape('circle')
              .color('status', (v) => {
                switch (v) {
                  case 2:
                    return '#ffed11';
                  default:
                    return '#FFF';
                }
              })
              .animate(true)

              .size(30);
            const lineUp = new LineLayer({ zIndex: 5 })
              .source(data)
              .shape('line')
              // .color('rgba(255,255,255,0.3)')
              .size(1)
              .style({
                sourceColor: '#79bffd', // 起点颜色
                targetColor: '#79bffd', // 终点颜色
                raisingHeight: 55000,
                opacity: 0.6,
              })
              .animate(true);
            const flylayer = new LineLayer({
              blend: 'normal',
              zIndex: 30,
              pickingBuffer: 6,
              enablePropagation: true,
            })
              .source(baseData, {
                parser: {
                  type: 'json',
                  x1: 'from_lng',
                  y1: 'from_lat',
                  x: 'lng',
                  y: 'lat',
                },
              })
              .size(1)
              .shape('arc')
              .color('status', (v) => {
                switch (v) {
                  case 2:
                    return '#ffed11';
                  default:
                    return '#FFF';
                }
              })
              .style({
                raisingHeight: 150000,
              });
            // .animate({
            //   duration: 1,
            //   interval: 1,
            //   trailLength: 2,
            // });
            const airPlaneLayer = new LineLayer({
              blend: 'normal',
              zIndex: 31,
              pickingBuffer: 6,
              enablePropagation: true,
            })
              .source(baseData, {
                parser: {
                  type: 'json',
                  x1: 'from_lng',
                  y1: 'from_lat',
                  x: 'lng',
                  y: 'lat',
                },
              })
              .shape('arc')
              .texture('status', (v) => {
                switch (v) {
                  case 2:
                    return 'planeH';
                  default:
                    return 'plane';
                }
              })
              .size(15)
              .color('#1890ff')
              .animate({
                duration: 0.8,
                interval: 1,
                trailLength: 0.2,
              })
              .style({
                textureBlend: 'replace',
                lineTexture: true, // 开启线的贴图功能
                iconStep: 6, // 设置贴图纹理的间距
              });

            scene.addLayer(provincelayer); // 抬升底图
            scene.addLayer(provincelayerDown); //底图

            scene.addLayer(NamePoint); // 名称图
            scene.addLayer(lineUp); //  围边图
            scene.addLayer(dotPoint); //  坐标圆圈点

            flylayer.on('click', (...args: any[]) => {
              console.log(args);
              sessionStorage.setItem(
                'orgInfo',
                JSON.stringify(args[0].feature),
              );
              window.location.href = `${window.location.origin}/datalink`;
              // history.push('/datalink');
            });
            scene.addLayer(flylayer); // 飞线

            scene.addLayer(airPlaneLayer);
            scene.setMapStatus({
              dragEnable: false, // 是否允许地图拖拽
              keyboardEnable: false, // 是否允许形键盘事件
              doubleClickZoom: false, // 双击放大
              zoomEnable: false, // 滚动缩放
              rotateEnable: false, // 旋转
            });
          });
      });
    }
  }, [baseData]);
  return (
    <>
      <div
        id="map"
        style={{
          width: '100%',
          height: '100%',
          position: 'relative',
          zIndex: 1,
        }}
      >
      </div>
    </>
  );
};
export default Map;
其中我的baseData 数据来源 是后端返回的数据 和我自己定义的demo数据 重组形成的 你们使用的时候可直接参考demo.js 中的数据格式
另外你在使用过程中可能会发现 经纬度在图层下方 或者经纬度不准的情况。造成这个问题的原因是 我把地图整体抬高了 形成3d效果。 这样的问题出现后 需要我们手动调整demo.js 中经纬度
总结
本来想 详细分析一下 但是发现代码里面 各种注释都有。所以各位少侠直接看注释吧 应该是比较清晰的。如果有不懂的api 直接在 antv-l7上面搜索就行


 1627
1627


 被折叠的 条评论
为什么被折叠?
被折叠的 条评论
为什么被折叠?
 到【灌水乐园】发言


