


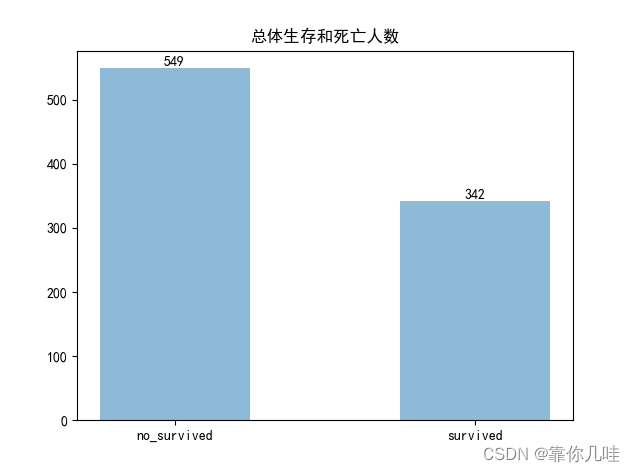
1 首先统计总的死亡人数和幸存人数对比 (柱状图和饼图)
import numpy as np
import pandas as pd
import matplotlib.pyplot as plt
from pylab import mpl
mpl.rcParams['font.sans-serif'] = ['SimHei'] # SimHei是黑体的意思
df = pd.read_csv('train.csv')
print(df.info)
print(df.head())
# 统计总的生存和死亡人数
total_survived_sum = df['Survived'].sum()
total_nosurvived_sum =df['Survived'][df['Survived']==0].count()
print("幸存者为%d,遇难者为%d"%(total_survived_sum,total_nosurvived_sum))
plt.bar([1, 0], [total_survived_sum,total_nosurvived_sum], width=0.5, alpha=0.5)
plt.xticks([1, 0], ['survived', 'no_survived'])
plt.title('总体生存和死亡人数')
for i, j in zip([1, 0], [total_survived_sum, total_nosurvived_sum]):
print(i, j)
print('%i' % j)
plt.text(i, j, '%i' % j, ha='center', va='bottom')
plt.show()
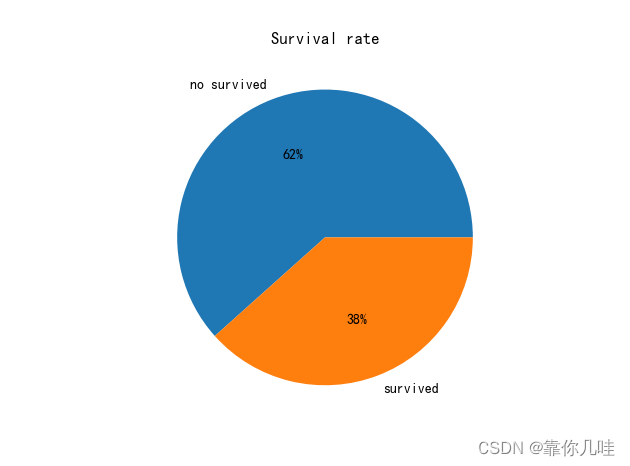
plt.pie([total_nosurvived_sum,total_survived_sum],labels=['no survived','survived'],autopct='%1.0f%%')
plt.title('Survival rate')
plt.show()
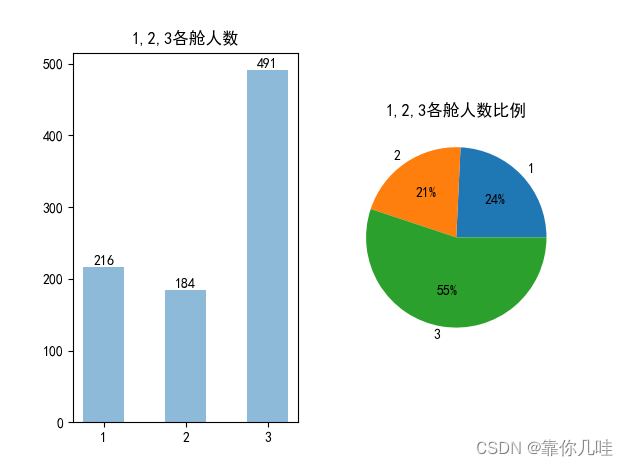
2 船舱等级因素对幸存的影响
a 首先获得各船舱人数 (船舱等级为1,2,3(数字越小,档次越高))
#  三个船舱等级下人数
number = df[['Pclass', 'Survived']].groupby(['Pclass']).count()  # count函数用于统计Pclass中1,2,3的行数
number.index = ['1', '2', '3']
print(number)  # 分组集合后的数据格式为series 包含index 和values 两个方法。
plt.subplot(121)
plt.bar([1, 2, 3], number['Survived'], width=0.5, alpha=0.5)
plt.xticks([1, 2, 3], number.index)
plt.title('1,2,3各舱人数')
for i, j in zip([1, 2, 3], number['Survived']):
    print(i, j)
    print('%i' % j)
    plt.text(i, j, '%i' % j, ha='center', va='bottom')

plt.subplot(122)
plt.pie((df[['Pclass','Survived']].groupby(['Pclass']).count())['Survived'],labels=['1','2','3'],autopct='%1.0f%%')
plt.title('1,2,3各舱人数比例')
plt.show()  # plt.pie 传入的是列表
再分析一下各舱幸存人数 以及占各舱幸存人数占幸存总人数比例
#  灾难后各舱幸存人数
survived_df=df[df[ 'Survived'] == 1]  # 过滤掉死去的人(去除包含该数据条件的所有行)
number2 = survived_df[['Pclass','Survived']].groupby('Pclass').sum()
print(number2)  # number2为series

plt.figure(figsize=(10,5))
plt.subplot(121)
plt.bar([1, 2, 3], number2['Survived'], width=0.5, alpha=0.5)
plt.xticks([1, 2, 3], number2.index)
plt.title('各舱幸存总人数')
for i, j in zip([1, 2, 3], number2['Survived']):
    print(i, j)
    print('%i' % j)
    plt.text(i, j, '%i' % j, ha='center', va='bottom')
plt.subplot(122)
plt.pie((survived_df[['Pclass', 'Survived']].groupby('Pclass').sum())['Survived'], labels=['1','2','3'],autopct='%1.0f%%')
plt.title('各舱幸存人数占总生存人数比例')
plt.show()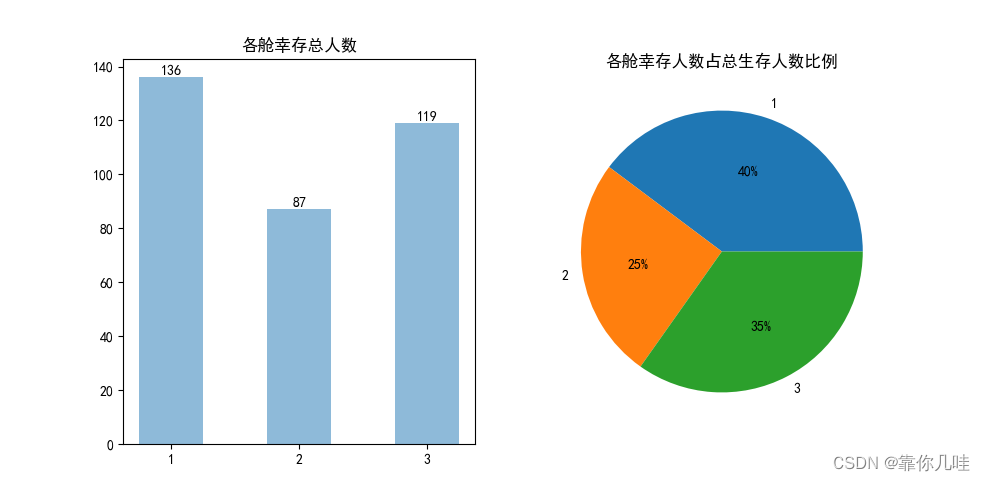
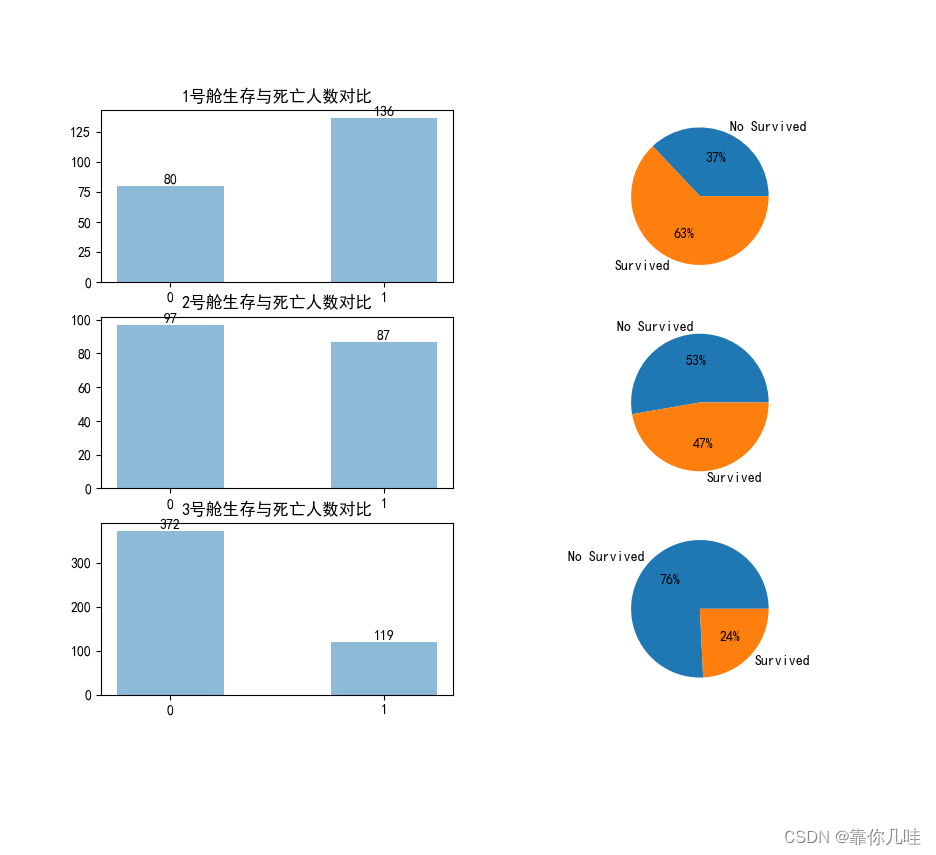
再看一下各舱各自生存率状况
# 各舱生存和死亡人数柱状图 以及各舱生存率比例饼图
Pclass1=df[df['Pclass']==1]
Pclass2=df[df['Pclass']==2]
Pclass3=df[df['Pclass']==3]
number3 = Pclass1[['Pclass', 'Survived']].groupby('Survived').count()

plt.figure(figsize=(10,20))
plt.subplot(4,2,1)
plt.bar([0, 1], number3['Pclass'], width=0.5, alpha=0.5)
plt.xticks([0, 1], number3.index)
plt.title('1号舱生存与死亡人数对比')
for i, j in zip([0, 1], number3['Pclass']):
    print(i, j)
    print('%i' % j)
    plt.text(i, j, '%i' % j, ha='center', va='bottom')
plt.subplot(4,2,2)
plt.pie([Pclass1['Survived'][Pclass1['Survived'] == 0].count(),Pclass1['Survived'][Pclass1['Survived'] == 1].count()],labels=['No Survived', 'Survived'],autopct='%1.0f%%')


number4 = Pclass2[['Pclass', 'Survived']].groupby('Survived').count()
plt.subplot(4,2,3)
plt.bar([0, 1], number4['Pclass'], width=0.5, alpha=0.5)
plt.xticks([0, 1], number4.index)
plt.title('2号舱生存与死亡人数对比')
for i, j in zip([0, 1], number4['Pclass']):
    print(i, j)
    print('%i' % j)
    plt.text(i, j, '%i' % j, ha='center', va='bottom')
plt.subplot(4,2,4)
plt.pie([Pclass2['Survived'][Pclass2['Survived'] == 0].count(),Pclass2['Survived'][Pclass2['Survived'] == 1].count()],labels=['No Survived', 'Survived'],autopct='%1.0f%%')

number5 = Pclass3[['Pclass', 'Survived']].groupby('Survived').count()
plt.subplot(4,2,5)
plt.bar([0, 1], number5['Pclass'], width=0.5, alpha=0.5)
plt.xticks([0, 1], number5.index)
plt.title('3号舱生存与死亡人数对比')
for i, j in zip([0, 1], number5['Pclass']):
    print(i, j)
    print('%i' % j)
    plt.text(i, j, '%i' % j, ha='center', va='bottom')
plt.subplot(4,2,6)
plt.pie([Pclass3['Survived'][Pclass3['Survived'] == 0].count(),Pclass3['Survived'][Pclass3['Survived'] == 1].count()],labels=['No Survived', 'Survived'],autopct='%1.0f%%')
plt.show()
接下来探究性别对生还情况的影响
首先绘制船上男女比例图
#  性别对死亡率的影响

male=df['Sex'][df['Sex']=='male'].count()
female=df['Sex'][df['Sex']=='female'].count()
print('船上男性为%d人,女性为%d人'%(male,female))
#
plt.figure(figsize=(10,5))
plt.bar([0, 1], [male, female], width=0.5, alpha=0.5)
plt.xticks([0, 1], ['男性', '女性'])
plt.title('男女人数比例')
for i, j in zip([0, 1], [male, female]):
    print(i, j)
    print('%i' % j)
    plt.text(i, j, '%i' % j, ha='center', va='bottom')
plt.show()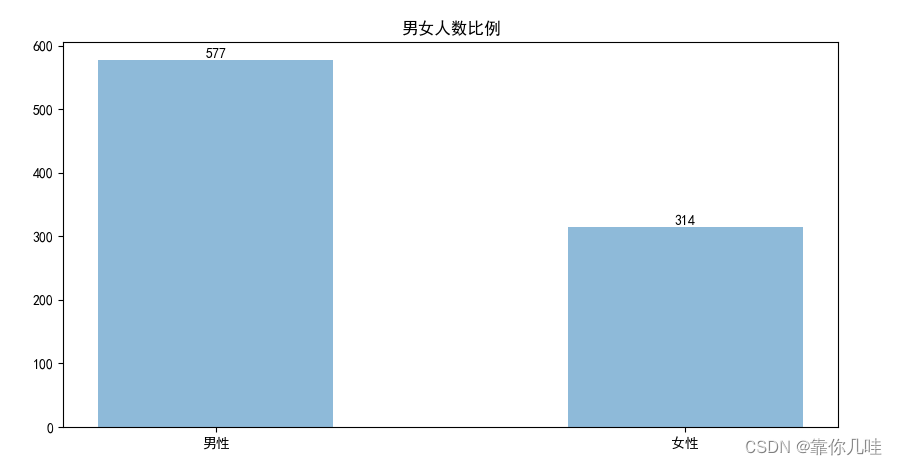
可看出船上男 577人 女 314 人
男女饼状图
plt.pie([male,female],labels=['male','female'],autopct='%1.0f%%')
plt.show()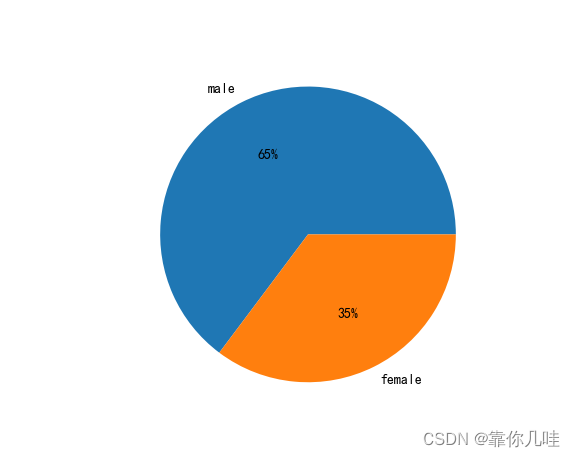
接下来统计幸存者中男女比例
# 统计幸存者中男女各自人数
survived_df=df[df[ 'Survived'] == 1]
Survived_male=survived_df['Sex'][survived_df['Sex']=='male'].count()
Survived_female=survived_df['Sex'][survived_df['Sex']=='female'].count()
print('幸存者中男性为%d人,女性为%d人'%(Survived_male, Survived_female))


#  幸存男性和幸存女性数量对比
plt.figure(figsize=(10,5))
plt.subplot(121)
plt.bar([0, 1], [Survived_male, Survived_female], width=0.5, alpha=0.5)
plt.xticks([0, 1], ['幸存男性', '幸存女性'])
plt.title('幸存男性和幸存女性数量对比')
for i, j in zip([0, 1], [Survived_male, Survived_female]):
    print(i, j)
    print('%i' % j)
    plt.text(i, j, '%i' % j, ha='center', va='bottom')
plt.subplot(122)
plt.pie([Survived_male, Survived_female],labels=['male', 'female'],autopct='%1.0f%%')
plt.title('幸存者中幸存男性和幸存女性比例')
plt.show()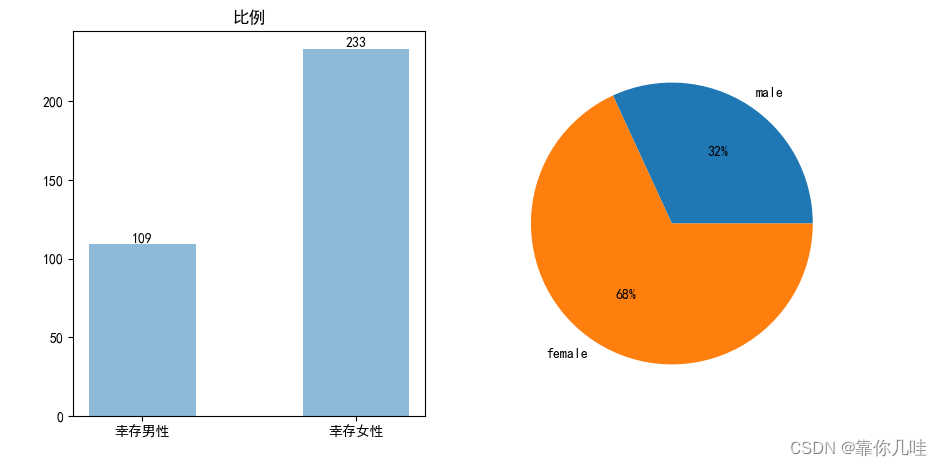
再接下来,分析在男性种群中,男性生还率状况 (幸存男性加死亡男性等于事故前船上男性)
#  幸存男性和死亡男性对比
male_df=df[df['Sex']=='male']
nu1 = male_df['Survived'][male_df['Survived']==1].count()
nu2 = male_df['Survived'][male_df['Survived']==0].count()
print('幸存男性为%d人,死亡男性为%d人'%(nu1, nu2))
plt.figure(figsize=(10,5))
plt.subplot(121)
plt.bar([0, 1], [nu1, nu2], width=0.5, alpha=0.5)
plt.xticks([0, 1], ['幸存男性', '死亡男性'])
plt.title('比例')
for i, j in zip([0, 1], [nu1, nu2]):
    print(i, j)
    print('%i' % j)
    plt.text(i, j, '%i' % j, ha='center', va='bottom')
plt.subplot(122)
plt.pie([male_df['Survived'][male_df['Survived']==0].count(),male_df['Survived'][male_df['Survived']==1].count()],labels=['no Survived','Survived'],autopct='%1.0f%%')
plt.show()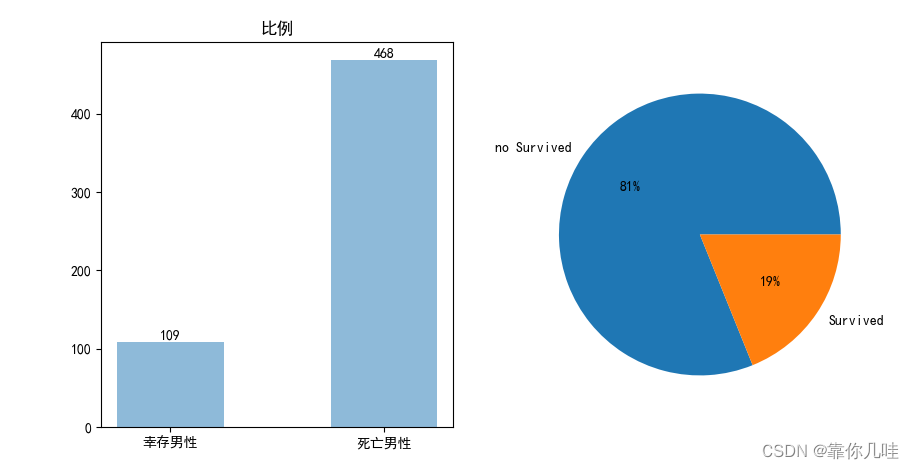
如法炮制,分析在女性种群中,女性生还率状况 (幸存女性加死亡女性等于事故前船上女性)
#  女性生还和死亡的人数对比
female_df=df[df['Sex']=='female']
num1 = female_df['Survived'][female_df['Survived']==1].count()
num2 = female_df['Survived'][female_df['Survived']==0].count()
print('幸存女性为%d人,死亡女性为%d人'%(num1, num2))
plt.figure(figsize=(10,5))
plt.subplot(121)
plt.bar([0, 1], [num1, num2], width=0.5, alpha=0.5)
plt.xticks([0, 1], ['幸存女性', '死亡女性'])
plt.title('女性生存死亡比例')
for i, j in zip([0, 1], [num1, num2]):
    print(i, j)
    print('%i' % j)
    plt.text(i, j, '%i' % j, ha='center', va='bottom')
plt.subplot(122)
plt.pie([female_df['Survived'][female_df['Survived']==0].count(),female_df['Survived'][female_df['Survived']==1].count()],labels=['no Survived','Survived'],autopct='%1.0f%%')
plt.show()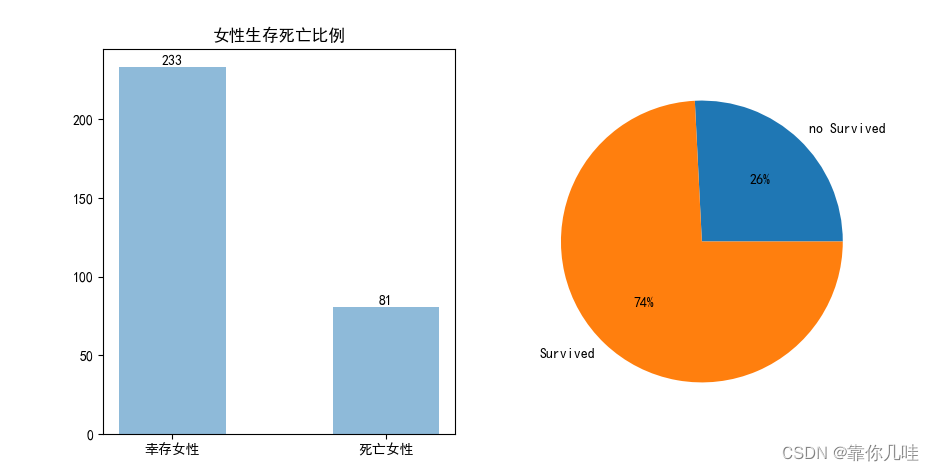
年龄因素的影响
因为年龄一栏目存在空值,所以先进行填充
  年龄因素分析
average_age=df['Age'].mean()  # 计算年龄均值
std_age=df['Age'].std()  # 计算年龄栏方差
count_nan_age=df['Age'].isnull().sum()  # 计算年龄栏空值总和
#  生成(average_age-std_age,average_age+std_age)范围的size个随机数
rand1=np.random.randint(average_age-std_age,average_age+std_age,size=count_nan_age)
df['Age'][np.isnan(df['Age'])]=rand1  # np.isnan()输出为布尔变量
然后粗略看一下年龄分布直方图和箱线图
# 粗略看一下年龄分布直方图
plt.figure(figsize=(12,5))
plt.subplot(121)
df['Age'].hist(bins=100)
plt.xlabel('Age')
plt.ylabel('Num')
#  箱线图
plt.subplot(122)
df.boxplot(column='Age',showfliers=False)
plt.show()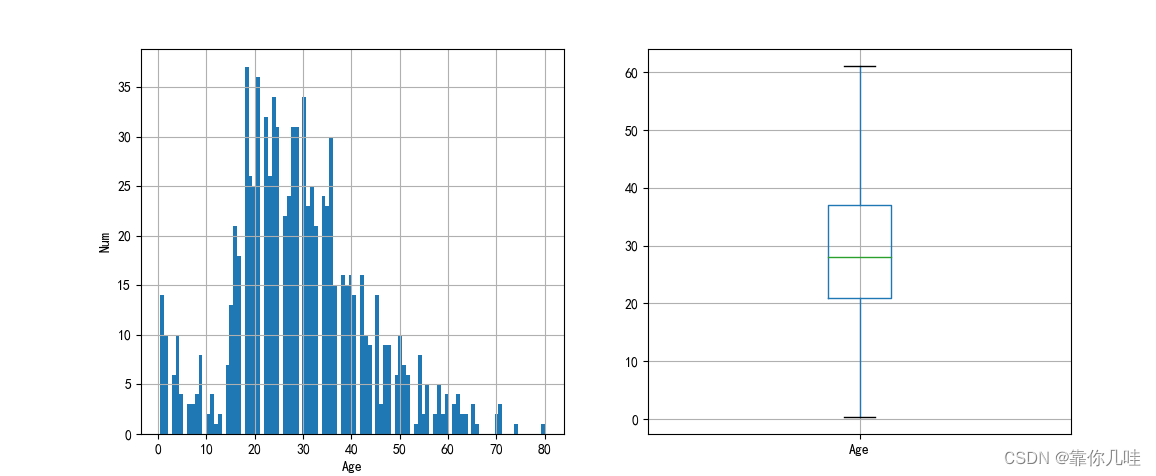
首先将年龄分为四类
统计四类人群下的生还人数以及生还率
#  首先将年龄分为四类
children_df=df[df['Age']<=12]
juvenile_df = df[(df['Age'] > 12) & (df['Age'] < 18)]
adults_df=df[(df['Age']>=18)&(df['Age']<65)]
agedness_df=df[df['Age']>=65]
#  四类年龄下人群生还人数分别统计
children_survived_sum = children_df['Survived'].sum()
juvenile_survived_sum = juvenile_df['Survived'].sum()
adults_survived_sum = adults_df['Survived'].sum()
agedness_survived_sum = agedness_df['Survived'].sum()
print('儿童生还人数为%d人,少年生还人数为%d人,成年人生还人数为%d人,老年人生还人数为%d人'%(children_survived_sum, juvenile_survived_sum, adults_survived_sum , agedness_survived_sum))
#  四类年龄人群生还率统计
children_survived_rate = children_df["Survived"].mean()
juvenile_survived_rate = juvenile_df['Survived'].mean()
adults_survived_rate = adults_df['Survived'].mean()
agedness_survived_rate = agedness_df['Survived'].mean()
print('儿童生还率为%f,少年生还率为%f,成年人生还率为%f,老年人生还率为%f'%(children_survived_rate, juvenile_survived_rate, adults_survived_rate, agedness_survived_rate))

#  年龄数据可视化
x = ['children', 'juvenile', 'adults', 'agedness']
b = [40, 26, 275, 1]  # 各年龄段生还人数
y = [children_survived_rate, juvenile_survived_rate , adults_survived_rate, agedness_survived_rate]  # 各年龄段生还率
plt.figure(figsize=(12, 5))
plt.subplot(121)
plt.bar([0, 1, 2, 3], b, width=0.5, alpha=0.5)
plt.xticks([0, 1, 2, 3], x)
plt.title('各年龄段生还人数')
for i, j in zip([0, 1, 2, 3], b):

    plt.text(i, j, '%i' % j, ha='center', va='bottom')

x = ['children', 'juvenile', 'adults', 'agedness']
y = [children_survived_rate, juvenile_survived_rate , adults_survived_rate, agedness_survived_rate]
plt.subplot(122)
plt.bar([0, 1, 2, 3], y, width=0.5, alpha=0.5)
plt.xticks([0, 1, 2, 3], x)
plt.title('各年龄段生还率')
for i, j in zip([0, 1, 2, 3], y):
    plt.text(i, j,  j, ha='center', va='bottom')
plt.show()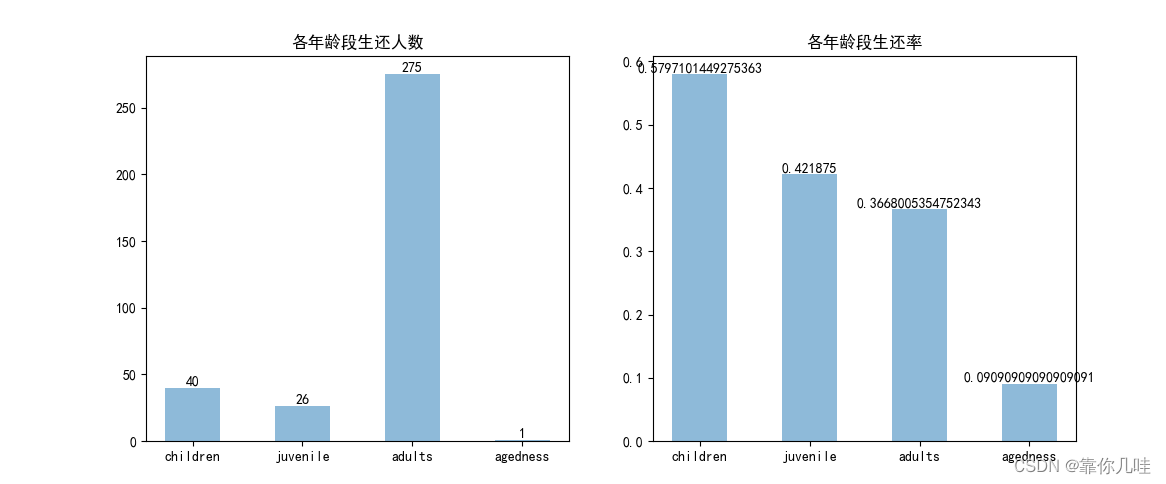
最后看一下父母因素的影响 统计有父母和无父母这两个因素影响
有父母情况下 幸存和死亡状况
#  父母因素分析
parch_df=df[df['Parch']!=0]  # 有父母
no_parch_df=df[df['Parch']==0]  # 无父母
sur_parch_df_sum = parch_df['Survived'].sum()  # 有父母的生存下来的人数
nosur_parch_df_sum = parch_df['Survived'][parch_df['Survived'] == 0].count()  # 有父母的阵亡的人数

plt.figure(figsize=(10,5))
plt.subplot(121)
plt.bar([0, 1], [sur_parch_df_sum, nosur_parch_df_sum], width=0.5, alpha=0.5)
plt.xticks([0, 1], ['幸存', '死亡'])
plt.title('有父母人群生还和死亡情况')
for i, j in zip([0, 1], [sur_parch_df_sum, nosur_parch_df_sum]):
    plt.text(i, j, '%i' % j, ha='center', va='bottom')

plt.subplot(122)
plt.pie([parch_df['Survived'][parch_df['Survived'] == 0].count(),parch_df['Survived'][parch_df['Survived'] == 1].count()],labels=['No Survived', 'Survived'],autopct='%1.0f%%')
plt.show()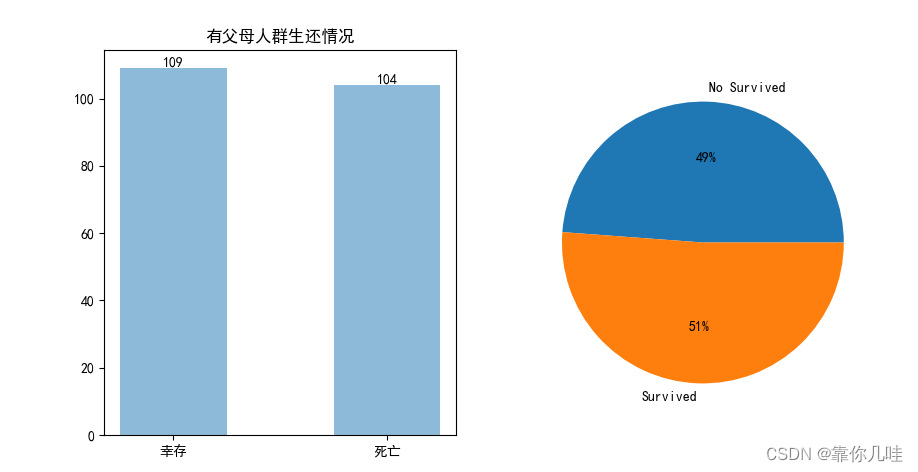
在看一下无父母的情况
# 无父母的生存和死亡状况分析
plt.figure(figsize=(10,5))
plt.subplot(121)
plt.bar([0, 1], [no_parch_df['Survived'][no_parch_df['Survived'] == 0].count(),no_parch_df['Survived'][no_parch_df['Survived'] ==1].count()], width=0.5, alpha=0.5)
plt.xticks([0, 1], ['死亡', '幸存'])
plt.title('无父母人群幸存和死亡人数')
for i, j in zip([0, 1], [no_parch_df['Survived'][no_parch_df['Survived'] == 0].count(),no_parch_df['Survived'][no_parch_df['Survived'] ==1].count()]):
    plt.text(i, j, '%i' % j, ha='center', va='bottom')
plt.subplot(122)
plt.pie([no_parch_df['Survived'][no_parch_df['Survived'] == 0].count(),no_parch_df['Survived'][no_parch_df['Survived'] ==1].count()],labels=['No Survived', 'Survived'],autopct='%1.0f%%')
plt.title('无父母人群幸存和死亡率')
plt.show() 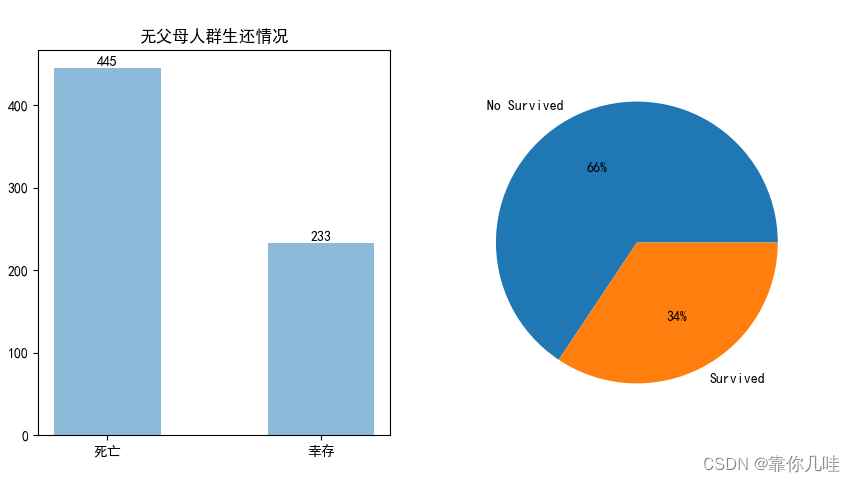
结束 (主要用于巩固基础学习)


 1109
1109

 被折叠的 条评论
为什么被折叠?
被折叠的 条评论
为什么被折叠?
 到【灌水乐园】发言


