


数据分析小笔记
import numpy as np
import pandas as pd
from pandas import Series, DataFrame
import matplotlib.pyplot as plt
from matplotlib import rcParams
import seaborn as sns
Series
①最基本的Series结构:Series(data, index=index)
②data是数据值,是可选参数,不填则创建空Series对象;(列表、元组、ndarray、字典、数字、字符串)
③index是自定义的索引列表,是可选择参数,默认是从0开始的递增序列。
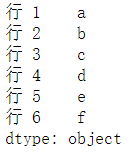
④例:series_obj = Series([‘a’,‘b’,‘c’,‘d’,‘e’,‘f’],index=[‘行 1’,‘行 2’,‘行 3’,‘行 4’,‘行 5’,‘行 6’])
DataFrame
①DataFrame对象有 一个Series.data对象 和 两个索引数组(index和columns)
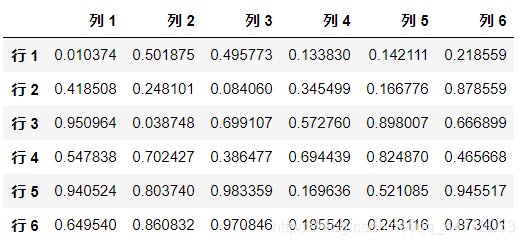
②例:DataFrame(np.random.rand(36).reshape(6,6),index = [‘行 1’,‘行 2’,‘行 3’,‘行 4’,‘行 5’,‘行 6’],columns = [‘列 1’,‘列 2’,‘列 3’,‘列 4’,‘列 5’,‘列 6’])
Numpy
NumPy(Numerical Python)是Python的一种开源的数值计算扩展。这种工具可用来存储和处理大型矩阵,比Python自身的嵌套列表(nested list structure)结构要高效的多(该结构也可以用来表示矩阵(matrix)),支持大量的维度数组与矩阵运算,此外也针对数组运算提供大量的数学函数库 [1] 。
Pandas
pandas 是基于NumPy 的一种工具,该工具是为了解决数据分析任务而创建的。Pandas 纳入了大量库和一些标准的数据模型,提供了高效地操作大型数据集所需的工具。pandas提供了大量能使我们快速便捷地处理数据的函数和方法。你很快就会发现,它是使Python成为强大而高效的数据分析环境的重要因素之一。
利用pandas绘制折线图
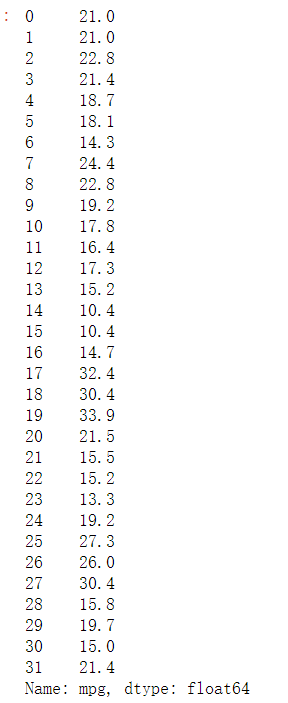
mpg = cars[‘mpg’]
mpg.plot()

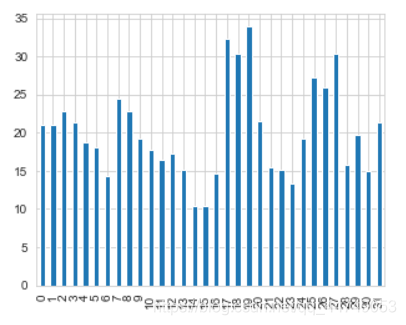
从Pandas对象绘制条形图
mpg.plot(kind=‘bar’)# 纵向
matplotlib
Matplotlib 是一个 Python 的 2D绘图库,它以各种硬拷贝格式和跨平台的交互式环境生成出版质量级别的图形。
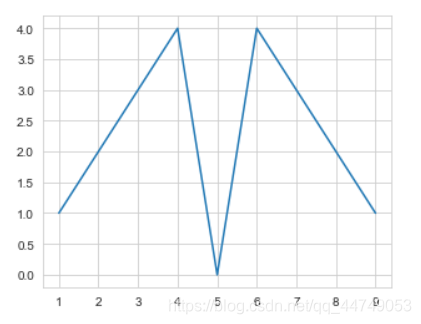
利用matplotlib绘制折线图
x = range(1,10)
y = [1,2,3,4,0,4,3,2,1]
plt.plot(x,y)
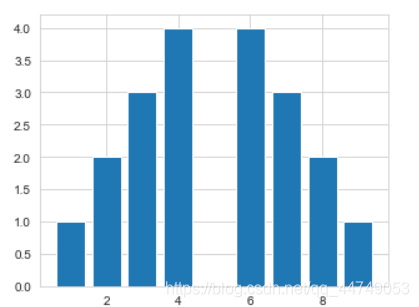
从matplotlib创建条形图
plt.bar(x,y)
利用matplotlib绘制饼图
z=[1,2,3,4,0.5]
plt.pie(z)
plt.show()

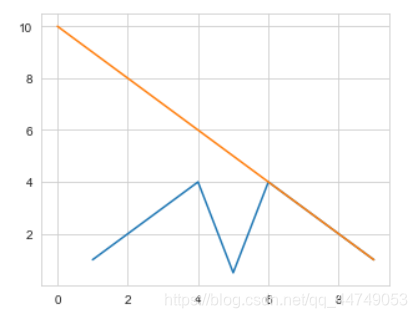
自定义线条样式
x = range(1, 10)
y = [1,2,3,4,0.5,4,3,2,1]
x1 = range(0,10)
y1 = [10,9,8,7,6,5,4,3,2,1]
plt.plot(x,y)
plt.plot(x1,y1)
利用matplotlib绘制散点图
scatter:散点 s:点的大小
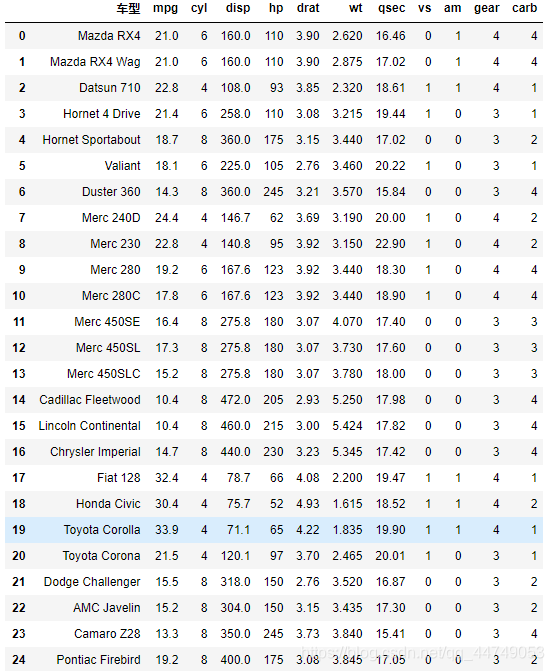
cars
cars.plot(kind=‘scatter’,x=‘hp’,y=‘mpg’,c=‘darkgrey’,s=150)

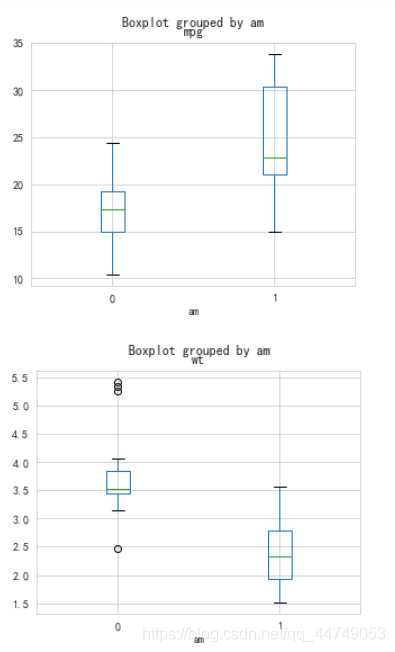
利用matplotlib绘制箱型图
cars.boxplot(column=‘mpg’,by=‘am’)
cars.boxplot(column=‘wt’,by=‘am’)
sns.boxplot(x=‘am’,y=‘mpg’,data=cars,palette=‘hls’)

Seaborn
Seaborn是基于matplotlib的图形可视化python包。它提供了一种高度交互式界面,便于用户能够做出各种有吸引力的统计图表。
Seaborn是在matplotlib的基础上进行了更高级的API封装,从而使得作图更加容易,在大多数情况下使用seaborn能做出很具有吸引力的图,而使用matplotlib就能制作具有更多特色的图。应该把Seaborn视为matplotlib的补充,而不是替代物。同时它能高度兼容numpy与pandas数据结构以及scipy与statsmodels等统计模式。
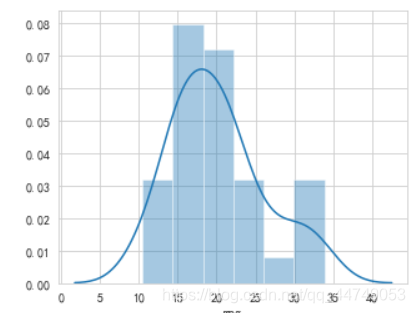
直方图
seaborn中的distplot主要功能是绘制单变量的直方图
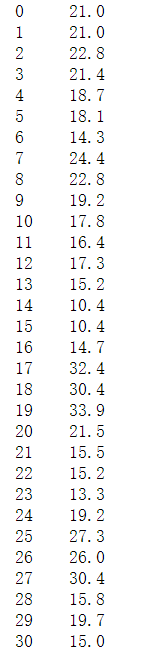
mpg
sns.distplot(mpg)
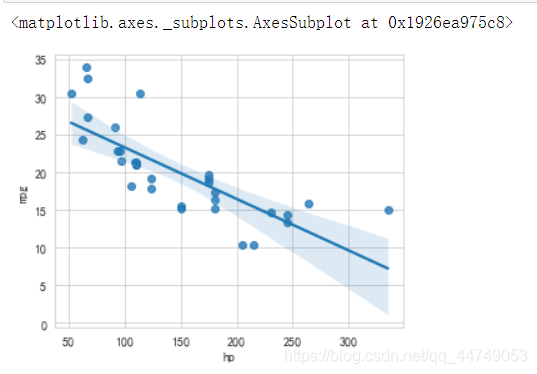
线性回归关系
sns.regplot(x=‘hp’,y=‘mpg’,data=cars,scatter=True)
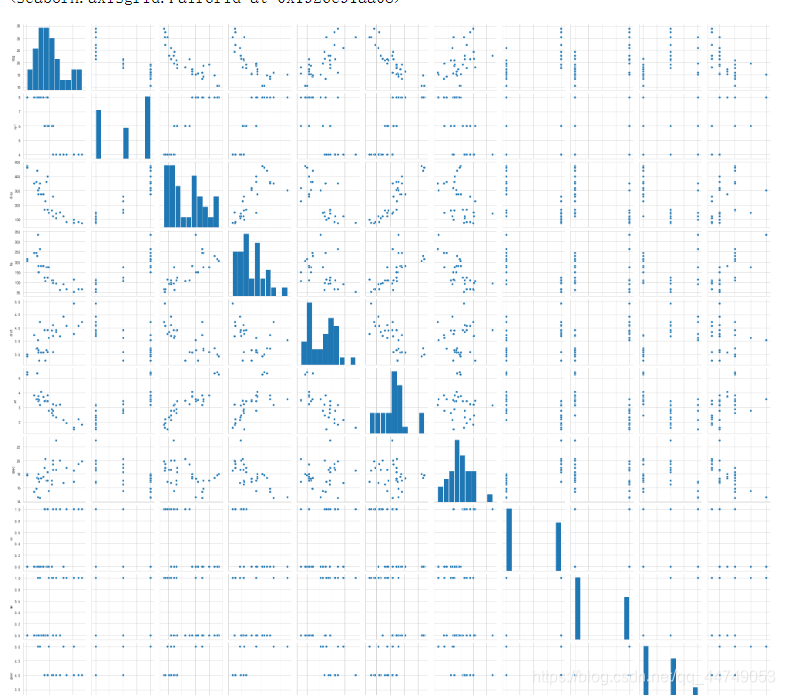
散点图矩阵
sns.pairplot(cars)
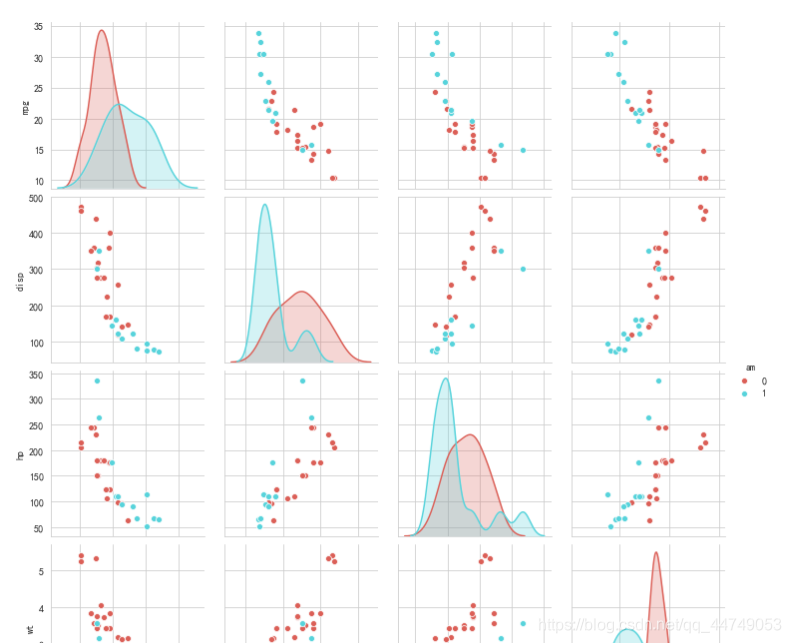
以am作为标准对数据着色
#palette:调色板
sns.pairplot(cars[[‘mpg’,‘disp’,‘hp’,‘wt’,‘am’]],hue=‘am’,palette=‘hls’)


 1373
1373


 被折叠的 条评论
为什么被折叠?
被折叠的 条评论
为什么被折叠?
 到【灌水乐园】发言


