


Objective
To explore the details of Ethernet frames.
Ethernet is a popular link layer protocol that is covered in §4.3 of your text;
modern computers connect to Ethernet switches (§4.3.4) rather than use classic Ethernet (§4.3.2).
Review section §4.3 before doing this lab.
目的
探索以太网帧的细节。
以太网是一种流行的链路层协议,在您的文本§4.3中有介绍;
现代计算机连接到以太网交换机(§4.3.4),而不是使用传统以太网(§4.3.2)。
在做这个实验之前,请复习第4.3节。
Requirements
Wireshark: This lab uses the Wireshark software tool to capture and examine a packet trace.
A packet trace is a record of traffic at a location on the network, as if a snapshot was taken of all the bits that passed across a particular wire.
The packet trace records a timestamp for each packet, along with the bits that make up the packet, from the lower-layer headers to the higher-layer contents.
Wireshark runs on most operating systems, including Windows, Mac and Linux.
It provides a graphical UI that shows the sequence of packets and the meaning of the bits when interpreted as protocol headers and data.
It color-codes packets by their type, and has various ways to filter and analyze packets to let you investigate the behavior of network protocols.
Wireshark is widely used to troubleshoot networks.
You can download it from www.wireshark.org if it is not already installed on your computer.
We highly recommend that you watch the short, 5 minute video “Introduction to Wireshark” that is on the site.
ping: This lab uses “ping” to send and receive messages.
ping is a standard command-line utility for checking that another computer is responsive.
It is widely used for network troubleshooting and comes pre-installed on Window, Linux, and Mac.
While ping has various options, simply issuing the command “ping www.bing.com” will cause your computer to send a small number of ICMP ping requests to the remote computer (here www.bing.com), each of which should elicit an ICMP ping response.
要求
Wireshark:这个实验室使用Wireshark软件工具来捕获和检查包跟踪。
数据包跟踪是网络上某个位置的流量记录,就好像是对通过某条特定线路的所有位进行快照一样。
包跟踪记录每个包的时间戳,以及组成包的位,从低层头到高层内容。
Wireshark运行在大多数操作系统上,包括Windows、Mac和Linux。
它提供了一个图形化的用户界面,当被解释为协议头和数据时,它显示了数据包的序列和位的含义。
它根据数据包的类型对其进行颜色编码,并有各种方法来过滤和分析数据包,以便您研究网络协议的行为。
Wireshark被广泛用于网络故障排除。
你可以从www.wireshark.org如果您的计算机上尚未安装。
我们强烈建议您观看网站上的5分钟短片“Wireshark简介”。
ping:这个实验室使用“ping”来发送和接收消息。
ping是一个标准的命令行实用程序,用于检查另一台计算机是否响应。
它广泛用于网络故障排除,并预装在windows、Linux和Mac上。ping有各种选择,只需发出命令“pingwww.bing.com网站“将导致您的计算机向远程计算机(此处)发送少量ICMP ping请求www.bing.com网站),每一个都应该引发一个ICMP ping响应。
Step 1: Capture a Trace
Proceed as follows to capture a trace of ping packets; alternatively you may use a supplied trace.
We will use ping simply as an easy way to collect a small trace.
Perhaps surprisingly, you can capture a trace for this lab from a computer connected to the Internet using either wired Ethernet or wireless 802.11.
按照以下步骤捕获ping包的跟踪;或者您可以使用提供的跟踪。
我们将简单地使用ping作为收集小跟踪的简单方法。
也许令人惊讶的是,你可以从一台使用有线以太网或无线802.11连接到互联网的计算机上捕捉到这个实验室的踪迹。
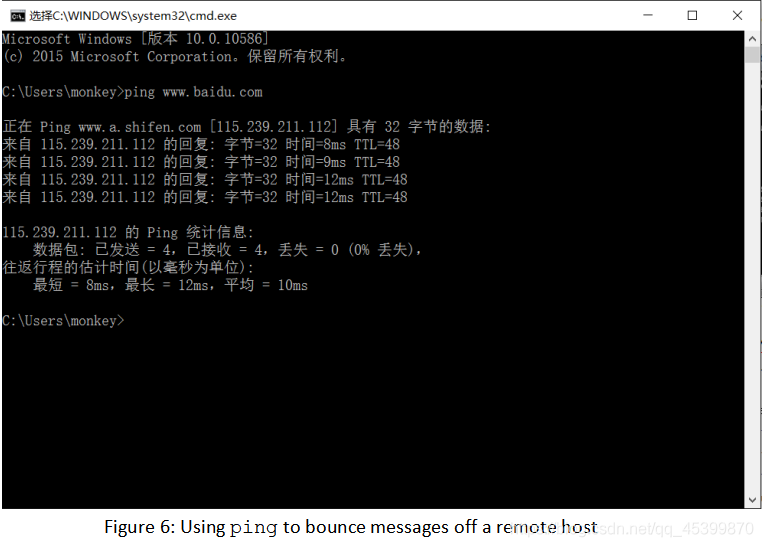
1.Pick a remote web server or other publicly reachable Internet host and use ping to send some ping messages and check that it sends replies.
For example, “ping www.bing.com”.
You should see several replies indicating that the pings reached the remote host and were returned.
The figure below shows a successful example.
Note that some versions of ping will continue to bounce messages off of a remote server until you tell the program to stop by signaling it with ^C.
If your ping test does not succeed then try another server.
1.选择远程web服务器或其他可公开访问的Internet主机,使用ping发送一些ping消息,并检查它是否发送了回复。
例如,“pingwww.bing.com网站”.
您应该会看到几个答复,表明ping已到达远程主机并已返回。
下图显示了一个成功的例子。
请注意,某些版本的ping将继续从远程服务器上弹出消息,直到您用^C发信号通知程序停止为止。
如果ping测试没有成功,请尝试其他服务器。
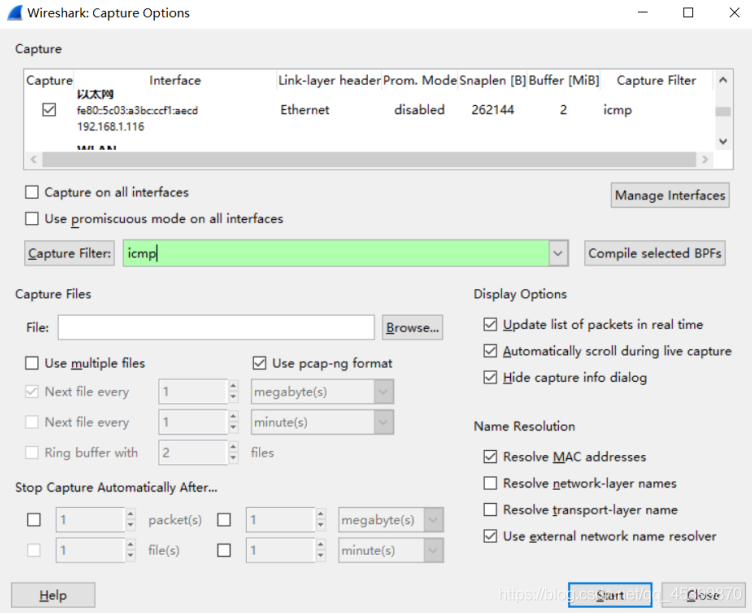
2.Launch Wireshark and start a capture of Ethernet frames with a filter of “icmp”, making sure that “enable MAC name resolution” is checked.
The latter will translate Ethernet (MAC) addresses to provide2. vendor information.
Also check that the Link-layer header type pulldown says “Ethernet”.
Your capture window should be similar to the one pictured below, other than our highlighting.
Select the interface from which to capture as the main wired or wireless interface used by your computer to connect to the Internet.
If unsure, guess and revisit this step later if your capture is not successful.
Uncheck “capture packets in promiscuous mode”.
This mode is useful to overhear packets sent to/from other computers on broadcast networks.
We only want to record packets sent to/from your computer. Leave other options at their default values.
The capture filter, if present, is used to prevent the capture of other traffic your computer may send or receive.
On Wireshark 1.8, the capture filter box is present directly on the options screen, but on Wireshark 1.9, you set a capture filter by double-clicking on the interface.
2.启动Wireshark,用一个“icmp”过滤器开始捕获以太网帧,确保选中了“启用MAC名称解析”,后者将以太网(MAC)地址转换为provide2。供应商信息。
还要检查linklayer header type下拉列表是否显示“Ethernet”。
您的捕获窗口应该类似于下图,而不是我们的突出显示。
选择要从中捕获的接口作为计算机连接到Internet时使用的主要有线或无线接口。
如果不确定,请猜测并在捕获失败后再次访问此步骤。
取消选中“以混杂模式捕获数据包”。
此模式用于偷听广播网络上发送到/来自其他计算机的数据包。
我们只想记录发送到/来自您计算机的数据包。
保留其他选项的默认值。
捕获筛选器(如果存在)用于阻止捕获计算机可能发送或接收的其他流量。
在Wireshark 1.8上,捕获过滤器框直接出现在选项屏幕上,但是在Wireshark 1.9上,您可以通过双击界面来设置捕获过滤器。
3.When the capture is started, repeat the ping command above. This time, the packets will also be recorded by Wireshark.
3.开始抓取时,重复上面的ping命令,这次Wireshark也会记录包。
4.After the ping command is complete, return to Wireshark and use the menus or buttons to stop the trace.
You should now have a short trace similar to that shown in the figure below.
If you do not succeed in capturing a trace then use the supplied one.
Note that the trace we supply begins with ping messages, and then has other kinds of Ethernet frames.
4.ping命令完成后,返回Wireshark,使用菜单或按钮停止跟踪。
现在应该有一个类似下图所示的短跟踪。
如果未能成功捕获跟踪,请使用提供的跟踪。
注意,我们提供的跟踪从ping消息开始,然后有其他类型的以太网帧。
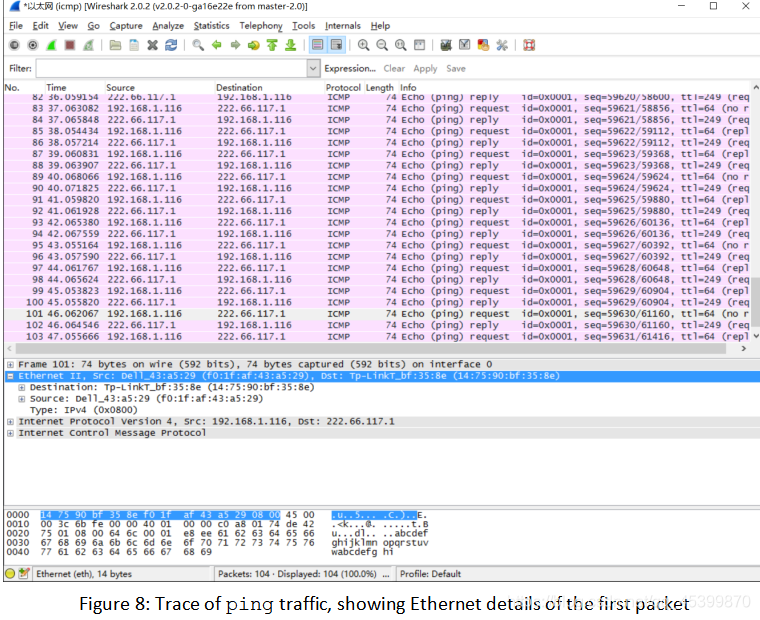
Step 2: Inspect the Trace
Select any packet in the trace (in the top panel) to see details of its structure (in the middle panel) and the bytes that make up the packet (in the bottom panel).
Now we can inspect the details of the packets.
In the figure, we have selected the first packet in the trace.
Note that we are using the term “packet” in a loose way.
Each record captured by Wireshark more correctly corresponds to a single frame in Ethernet format that carries a packet as its payload;
Wireshark interprets as much structure as it can.
第二步:检查痕迹
选择跟踪中的任何数据包(在顶部面板中)以查看其结构的详细信息(在中间面板中)和组成数据包的字节(在底部面板中)。
现在我们可以检查这些数据包的详细信息。
在图中,我们选择了跟踪中的第一个包。
请注意,我们使用的术语“包”是松散的。
Wireshark捕捉到的每个记录更准确地对应于以太网格式的单个帧,该帧携带一个包作为其有效载荷;
Wireshark尽可能多地解释结构。
In the middle panel, expand the Ethernet header fields (using the “+” expander or icon) to see their details.
Our interest is the Ethernet header, and you may ignore the higher layer protocols (which are IP and ICMP in this case).
You can click on the Ethernet header to see the bytes that correspond to it in the packet highlighted in the bottom panel.
We have performed both steps in the figure.
在中间面板中,展开以太网标头字段(使用“+”扩展器或图标)以查看其详细信息。
我们感兴趣的是以太网报头,您可以忽略更高层的协议(在本例中是IP和ICMP)。
您可以单击Ethernet标头,在底部面板中突出显示的数据包中查看与之对应的字节。
我们已经完成了图中的两个步骤。
If you are capturing traffic over an 802.11 interface, you may wonder why you have an Ethernet header at all, instead of an 802.11 header.
This happens because we asked Wireshark to capture packets in Ethernet format on the capture options (in Figure 2).
In this case, the OS software converted the real 802.11 header into a pseudo-Ethernet header.
We are seeing the pseudo-Ethernet header.
如果您要通过802.11接口捕获流量,您可能会想知道为什么您有以太网报头,而不是802.11报头。
之所以会发生这种情况,是因为我们要求Wireshark在捕获选项上以以太网格式捕获数据包(如图2所示)。
在这种情况下,操作系统软件将真正的802.11报头转换为伪以太网报头。
我们看到的是伪以太网报头。
Compare the fields you see with the picture of an Ethernet frame in Fig. 4-14 of your text. You will see both similarities and differences:
- There are two kinds of Ethernet shown in your book, IEEE 802.3 and DIX Ethernet. IEEE 802.3 is rare and you are not likely to see it. The frames in the figure and likely your capture are DIX Ethernet, called “Ethernet II” in Wireshark.
- There is no preamble in the fields shown in Wireshark. The preamble is a physical layer mechanism to help the NIC identify the start of a frame. It carries no useful data and is not received like other fields.
- There is a destination address and a source address. Wireshark is decoding some of these bits in the OUI (Organizationally Unique Identifier) portion of the address to tell us the vendor of the NIC, e.g., Dell for the source address.
- There is a Type field. For the ping messages, the Ethernet type is IP, meaning the Ethernet payload carries an IP packet. (There is no Length field as in the IEEE 802.3 format. Instead, the length of a DIX Ethernet frame is determined by the hardware of a receiving computer, which looks for valid frames that start with a preamble and end with a correct checksum, and passed up to higher layers along with the packet.)
- There is no Data field per se – the data starts with the IP header right after the Ethernet header.
- There is no pad. A pad will be present at the end if the frame would otherwise be less than 64 bytes, the minimum Ethernet frame size.
- There is no checksum in most traces, even though it really does exist. Typically, Ethernet hardware that is sending or receiving frames computes or checks this field and adds or strips it. Thus it is simply not visible to the OS or Wireshark in most capture setups.
- There are also no VLAN fields such as the Tag shown in Fig. 4-49. If VLANs are in use, the VLAN tags are normally added and removed by switch ports so they will not be visible at host computers using the network.
将您看到的字段与文本图4-14中的以太网帧的图片进行比较。您将看到相同点和不同点:
在你的书中有两种以太网,ieee802.3和DIX以太网。ieee802.3很少见,你不太可能看到它。图中的帧和您捕获的可能是DIX以太网,Wireshark中称为“Ethernet II”。
Wireshark中显示的字段中没有序言。前导码是一种物理层机制,用于帮助NIC识别帧的开始。它不携带有用的数据,也不像其他字段那样接收。
有一个目标地址和一个源地址。Wireshark正在对地址的OUI(组织唯一标识符)部分中的一些位进行解码,以告诉我们NIC的供应商,例如,戴尔的源地址。
有一个类型字段。对于ping消息,Ethernet类型是IP,这意味着Ethernet负载携带一个IP包。(在IEEE 802.3格式中没有长度字段。相反,DIX以太网帧的长度是由接收计算机的硬件决定的,它寻找以前导码开头、以正确的校验和结束、并随数据包一起传递到更高层的有效帧。)
本身没有数据字段–数据从IP报头开始,就在以太网报头之后。
没有垫子。如果帧小于64字节(以太网帧的最小大小),则在末尾将出现一个pad。
在大多数跟踪中没有校验和,即使它确实存在。通常,发送或接收帧的以太网硬件会计算或检查此字段,并添加或删除该字段。因此,在大多数捕获设置中,操作系统或Wireshark根本看不到它。
也没有VLAN字段,如图4-49所示的标签。如果VLAN正在使用中,VLAN标记通常由交换机端口添加和删除,因此它们在使用网络的主机上不可见。
Step 3: Ethernet Frame Structure
To show your understanding of the Ethernet frame format, draw a figure of the ping message that shows the position and size in bytes of the Ethernet header fields.
Your figure can simply show the frame as a long, thin rectangle.
The leftmost fields come first in the packet and are sent on the wire first.
On this drawing, show the range of the Ethernet header and the Ethernet payload.
Add a dashed box at the end to represent the 4-byte checksum; we know it is there even if Wireshark does not show us this field.
第三步:以太网帧结构
要显示您对以太网帧格式的理解,请绘制一个ping消息的图,该图显示以太网头字段的位置和大小(以字节为单位)。
您的图形可以简单地将框架显示为一个长而细的矩形。
最左边的字段首先出现在数据包中,并首先在线路上发送。
在此图上,显示以太网标头和以太网有效负载的范围。
在末尾添加一个虚线框来表示4字节的校验和;即使Wireshark没有显示这个字段,我们也知道它在那里。
To work out sizes, observe that when you click on a protocol block in the middle panel (the block itself, not the “+” expander) then Wireshark will highlight the bytes it corresponds to in the packet in the lower panel and display the length at the bottom of the window.
You may also use the overall packet size shown in the Length column or Frame detail block.
要计算大小,请注意,当您单击中间面板中的协议块(块本身,而不是“+”扩展器)时,Wireshark将在下面板的数据包中突出显示它对应的字节,并在窗口底部显示长度。
您也可以使用Length列或Frame detail块中显示的整体数据包大小。
Turn-in: Hand in your drawing of an Ethernet frame.
上交:把你的以太网框架图交上来。
Step 4: Scope of Ethernet Addresses
Each Ethernet frame carries a source and destination address.
One of these addresses is that of your computer.
It is the source for frames that are sent, and the destination for frames that are received.
But what is the other address?
Assuming you pinged a remote Internet server, it cannot be the Ethernet address of the remote server because an Ethernet frame is only addressed to go within one LAN.
Instead, it will be the Ethernet address of the router or default gateway, such as your AP in the case of 802.11.
This is the device that connects your LAN to the rest of the Internet.
In contrast, the IP addresses in the IP block of each packet do indicate the overall source and destination endpoints. They are your computer and the remote server.
步骤4:以太网地址的范围
每个以太网帧携带一个源地址和目标地址。
其中一个地址是你电脑的地址。
它是发送帧的源,也是接收帧的目的地。
但另一个地址是什么?
假设您ping了一个远程Internet服务器,它不能是远程服务器的以太网地址,因为以太网帧的地址只能在一个LAN中进行。
相反,它将是路由器或默认网关的以太网地址,例如802.11中的AP。
这是一个将你的局域网连接到互联网的设备。
相反,每个包的IP块中的IP地址确实指示了整个源和目的地端点。
它们是您的计算机和远程服务器。
Draw a figure that shows the relative positions of your computer, the router, and the remote server.
Label your computer and the router with their Ethernet addresses.
Label your computer and the remote server with their IP addresses.
Show where the Ethernet and the rest of the Internet fit on the drawing.
画一个图来显示你的计算机、路由器和远程服务器的相对位置。
用以太网地址标记你的计算机和路由器。
用IP地址标记您的计算机和远程服务器。
显示以太网和其他Internet在图形上的位置。
Turn-in: Hand in your drawing.
上交:把你的画交上来。
Step 5: Broadcast Frames
The trace that you gathered above captured unicast Ethernet traffic sent between a specific source and destination, e.g., your computer to the router.
It is also possible to send multicast or broadcast Ethernet traffic, destined for a group of computers or all computers on the Ethernet, respectively.
We can tell from the address whether it is unicast, multicast, or broadcast.
Broadcast traffic is sent to a reserved Ethernet address that has all bits set to “1”.
Multicast traffic is sent to addresses that have a “1” in the first bit sent on the wire; broadcast is a special case of multicast.
Broadcast and multicast traffic is widely used for discovery protocols, e.g., a packet sent to everyone in an effort to find the local printer.
第五步:广播帧
您在上面收集的跟踪捕获了在特定源和目标(例如,您的计算机到路由器)之间发送的单播以太网流量。
也可以发送多播或广播以太网通信量,分别发往一组计算机或以太网上的所有计算机。
我们可以从地址判断它是单播、多播还是广播。
广播流量被发送到所有位都设置为“1”的保留以太网地址。
多播通信量被发送到在网上发送的第一位中有“1”的地址;广播是多播的一种特殊情况。
广播和多播通信被广泛用于发现协议,例如,为了寻找本地打印机而发送给每个人的数据包。
Start a capture for broadcast and multicast Ethernet frames with a filter of “ether multicast”, wait up to 30 seconds to record background traffic, and then stop the capture.
If you do not capture any packets with this filter then use the trace that we supplied.
On most Ethernets, there is a steady chatter of background traffic as computers exchange messages to maintain network state, which is why we try to capture traffic without running any other programs.
The capture filter of “ether multicast” will capture both multicast and broadcast Ethernet frames, but not regular unicast frames.
You may have to wait a little while for these packets to be captured, but on most LANs with multiple computers you will see at least a packet every few seconds.
使用“以太多播”过滤器启动对广播和多播以太网帧的捕获,等待30秒以记录背景流量,然后停止捕获。
如果您没有用这个过滤器捕获任何数据包,那么使用我们提供的跟踪。
在大多数以太网上,当计算机交换消息以保持网络状态时,会有一个稳定的背景通信量的抖动,这就是为什么我们不运行任何其他程序而尝试捕获流量的原因。
“以太多播”的捕获过滤器将捕获多播和广播以太网帧,而不是常规的单播帧。
您可能需要等待一段时间才能捕获这些数据包,但在大多数具有多台计算机的局域网上,您至少每隔几秒钟就会看到一个数据包。
Examine the multicast and broadcast packets that you captured, looking at the details of the source and destination addresses.
Most likely one has the broadcast Ethernet address, as broadcast frames tend to be more common than multicast frames.
Look at a broadcast frame to see what address is used for broadcast by Ethernet.
Expand the Ethernet address fields of either broadcast or multicast frames to see which bit is set to distinguish broadcast/multicast or group traffic from unicast traffic.
检查您捕获的多播和广播数据包,查看源地址和目标地址的详细信息。
最有可能的是广播以太网地址,因为广播帧往往比多播帧更常见。
查看广播帧,查看以太网广播使用的地址。
展开广播或多播帧的以太网地址字段,以查看设置了哪个位来区分广播/多播或组通信量与单播通信量。
Answer the following questions:
- What is the broadcast Ethernet address, written in standard form as Wireshark displays it?
- Which bit of the Ethernet address is used to determine whether it is unicast or multicast/broadcast?
回答以下问题:
Wireshark显示的是标准格式的广播以太网地址是什么?
以太网地址的哪一位用于确定它是单播还是多播/广播?
Turn-in: Hand in your answers to the above questions.
上交:把你对上述问题的答案交上来。
Explore on your own (IEEE 802.3)
We encourage you to explore Ethernet on your own once you have completed this lab.
As one possibility, recall that there are two types of Ethernet frame, IEEE 802.3 and DIX Ethernet.
DIX is common and what we considered above, while IEEE 802.3 is rare.
If you are rather lucky, you may see some IEEE 802.3 frames in the trace you have captured.
If not, then there are some of these packets in the trace that we supplied.
To search for IEEE 802.3 packets, enter a display filter (above the top panel of the Wireshark window) of “llc” (that was lowercase “LLC”) because the IEEE 802.3 format has the LLC protocol on top of it.
LLC is also present on top of IEEE 802.11 wireless, but it is not present on DIX Ethernet.
一旦你完成了这个实验,我们鼓励你自己探索以太网。
作为一种可能,回想一下有两种类型的以太网帧,ieee802.3和DIX以太网。
DIX很常见,我们在上面已经考虑过了,而ieee802.3则很少见。
如果您相当幸运,您可能会看到一些ieee802.3帧在您捕获的跟踪。
如果没有,那么在我们提供的跟踪中就有一些包。
要搜索IEEE 802.3数据包,请输入“llc”(小写“llc”)的显示过滤器(位于Wireshark窗口的顶部面板上方),因为IEEE 802.3格式的顶部有llc协议。
有限责任公司也存在于ieee802.11无线之上,但它不存在于DIX以太网上。
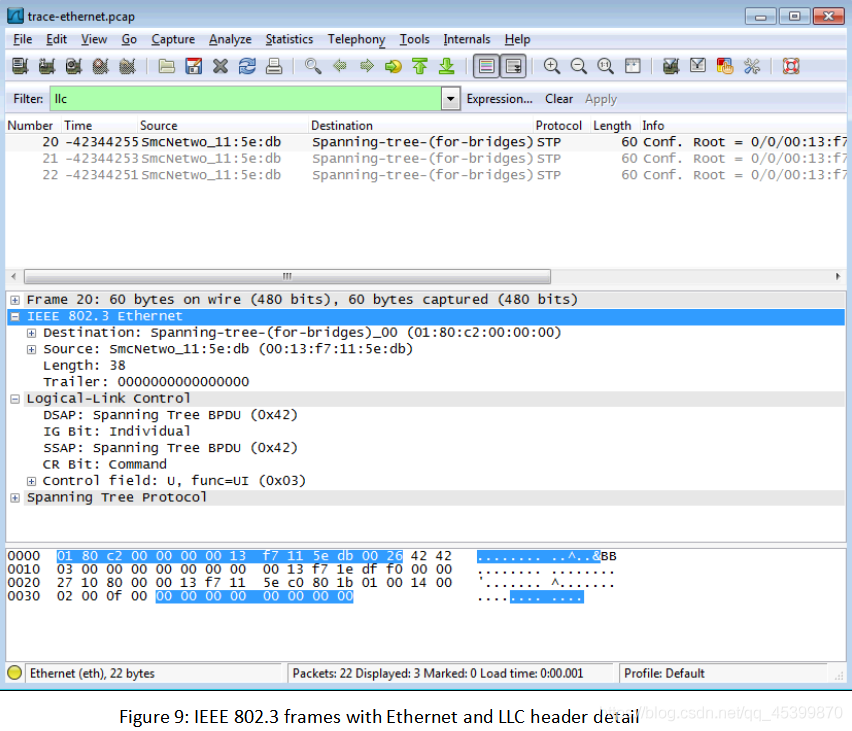
Have a look at the details of an IEEE 802.3 frame, including the LLC header.
The figure shows the details for our trace.
Observe that the Type field is now a Length field.
In our example, the frame is short enough that there is also padding of zeros identified as a Trailer or Padding.
The changes lead to a few questions for you to ponder:
- How long are the combined IEEE 802.3 and LLC headers compared to the DIX Ethernet headers? You can use Wireshark to work this out. Note that the Trailer/Padding and Checksum may be shown as part of the header, but they come at the end of the frame.
- How does the receiving computer know whether the frame is DIX Ethernet or IEEE 802.3? Hint: you may need to both use Wireshark to look at packet examples and read your text near where the Ethernet formats are described.
- If IEEE 802.3 has no Type field, then how is the next higher layer determined? Use Wireshark to look for the demultiplexing key.
看看ieee802.3帧的细节,包括LLC报头。
图中显示了跟踪的详细信息。
请注意,Type字段现在是Length字段。在
我们的示例中,帧足够短,因此还存在被标识为尾部或填充的0的填充。
这些变化引出了一些问题供您思考:
ieee802.3和LLC组合报头与DIX以太网报头相比有多长?你可以用Wireshark来解决这个问题。请注意,尾部/填充和校验和可能显示为标题的一部分,但它们出现在帧的末尾。
接收计算机如何知道帧是DIX以太网还是ieee802.3?提示:您可能需要使用Wireshark查看数据包示例,并在描述以太网格式的位置附近阅读文本。
如果ieee802.3没有类型字段,那么如何确定下一个更高的层?使用Wireshark查找解复用密钥。
Turn-in: Your answers to the above questions.
上交:以上问题的答案。


 341
341


 被折叠的 条评论
为什么被折叠?
被折叠的 条评论
为什么被折叠?
 到【灌水乐园】发言


