


Linux命令大全:云盘链接: https://pan.baidu.com/s/1VIGl3KiS0vAgf3VFvCA3Yg 提取码: 545c
基本命令
CPU相关
Top
作用:显示、管理执行中的程序
语法:
Usage:
	top -hv | -bcHiOSs -d secs -n max -u|U user -p pid(s) -o field -w [cols]
常用参数:
- d:改变显示的更新速度,或是在交谈式指令列(interactive command)按s
- q:没有任何延迟的显示速度,如果使用者是有superuser 的权限,则top将会以最高的优先序执行
- c:切换显示模式,共有两种模式,一是只显示执行档的名称,另一种是显示完整的路径与名称
演示一下:

这个命令想必大家都用过吧,但是很多人都不会分析这个结果。
第一行,这个结果和uptime是一样的。
第二行展示了任务相关的信息,图中,显示目前共有107个任务,有1个在运行,65个是睡眠的,0个停止了,0个僵尸进程。
第三行是Cpu的状态,us是用户态的进程cpu时间的占比,sy是内核态进程cpu时间占比,ni是运行已经调整优先级的用户进程的cpu时间占比,id是空闲的cpu时间占比,wa是用于等待io完成的cpu时间占比,hi是处理硬件终端cpu时间占比,si是处理软件终端cpu时间占比,st是被虚拟机偷去的cpu时间。
第四行是内存的状态,包括全部的内存、空闲的内存、已经使用的内存、缓冲以及缓存的内存
第五行是交换区的状态。
从第七行开始,是各个进程任务的状态监控,PID是进程号,USER是运行这个进程的用户是谁,PR是进程的实时优先级(数字越大优先级越高),NI是进程的nice优先级(数字越小优先级越高),VIRT表示使用的虚拟内存,RES是常驻内存,SHR是共享内存,S是进程状态
S取值有如下几种:
- D不可中断的睡眠状态
- R运行态
- S睡眠态
- T被跟踪或已停止
- Z僵尸态
%CPU表示从上次结果刷新到现在这些进程所使用的CPU时间百分比,%MEM是内存百分比,TIME是这个进程所使用的总CPU时间,COMMAND是这个进程所使用的命令是什么。
top常见用法:
# 展示完整命令
top -c

# 设置更新次数(更新2次后就退出)
top -n 2

# 指定更新周期(每隔3秒刷新一次)
top -d 3

# 查看指定的进程信息
top -p 139

# 显示指定的进程中线程的运行信息
top -Hp 139
进程相关
ps
作用:展示程序运行情况
语法:
Usage:
 ps [options]
Basic options:
 -A, -e               all processes
 -a                   all with tty, except session leaders
  a                   all with tty, including other users
 -d                   all except session leaders
 -N, --deselect       negate selection
  r                   only running processes
  T                   all processes on this terminal
  x                   processes without controlling ttys

Selection by list:
 -C <command>         command name
 -G, --Group <GID>    real group id or name
 -g, --group <group>  session or effective group name
 -p, p, --pid <PID>   process id
        --ppid <PID>  parent process id
 -q, q, --quick-pid <PID>
                      process id (quick mode)
 -s, --sid <session>  session id
 -t, t, --tty <tty>   terminal
 -u, U, --user <UID>  effective user id or name
 -U, --User <UID>     real user id or name

  The selection options take as their argument either:
    a comma-separated list e.g. '-u root,nobody' or
    a blank-separated list e.g. '-p 123 4567'

Output formats:
 -F                   extra full
 -f                   full-format, including command lines
  f, --forest         ascii art process tree
 -H                   show process hierarchy
 -j                   jobs format
  j                   BSD job control format
 -l                   long format
  l                   BSD long format
 -M, Z                add security data (for SELinux)
 -O <format>          preloaded with default columns
  O <format>          as -O, with BSD personality
 -o, o, --format <format>
                      user-defined format
  s                   signal format
  u                   user-oriented format
  v                   virtual memory format
  X                   register format
 -y                   do not show flags, show rss vs. addr (used with -l)
     --context        display security context (for SELinux)
     --headers        repeat header lines, one per page
     --no-headers     do not print header at all
     --cols, --columns, --width <num>
                      set screen width
     --rows, --lines <num>
                      set screen height

Show threads:
  H                   as if they were processes
 -L                   possibly with LWP and NLWP columns
 -m, m                after processes
 -T                   possibly with SPID column

Miscellaneous options:
 -c                   show scheduling class with -l option
  c                   show true command name
  e                   show the environment after command
  k,    --sort        specify sort order as: [+|-]key[,[+|-]key[,...]]
  L                   show format specifiers
  n                   display numeric uid and wchan
  S,    --cumulative  include some dead child process data
 -y                   do not show flags, show rss (only with -l)
 -V, V, --version     display version information and exit
 -w, w                unlimited output width

        --help <simple|list|output|threads|misc|all>
                      display help and exit
可以看到,他的命令非常的多,参数有好几十个。
但是常用参数只有这几个:
- -A或-e:列出所有的行程
- -w:显示加宽较多的咨询
- -f:“全格式”展示,返回的字段较多
- a:展示当前运行的所有程序,包括其他用户的程序。
- …其他的大家看看help吧,没动力翻译了…
示例:
# 全格式展示所有进程
ps -ef

# 显示较详细的信息,比如进程占用的cpu、内存等
ps -au

# 显示所有包含其他使用者的进程
ps -aux
pgrep
作用:根据特定条件查询进程的PID信息
语法:
Usage:
 pgrep [options] <pattern>

Options:
 -d, --delimiter <string>  specify output delimiter
 -l, --list-name           list PID and process name
 -a, --list-full           list PID and full command line
 -v, --inverse             negates the matching
 -w, --lightweight         list all TID
 -c, --count               count of matching processes
 -f, --full                use full process name to match
 -g, --pgroup <PGID,...>   match listed process group IDs
 -G, --group <GID,...>     match real group IDs
 -n, --newest              select most recently started
 -o, --oldest              select least recently started
 -P, --parent <PPID,...>   match only child processes of the given parent
 -s, --session <SID,...>   match session IDs
 -t, --terminal <tty,...>  match by controlling terminal
 -u, --euid <ID,...>       match by effective IDs
 -U, --uid <ID,...>        match by real IDs
 -x, --exact               match exactly with the command name
 -F, --pidfile <file>      read PIDs from file
 -L, --logpidfile          fail if PID file is not locked
 --ns <PID>                match the processes that belong to the same
                           namespace as <pid>
 --nslist <ns,...>         list which namespaces will be considered for
                           the --ns option.
                           Available namespaces: ipc, mnt, net, pid, user, uts

 -h, --help     display this help and exit
 -V, --version  output version information and exit
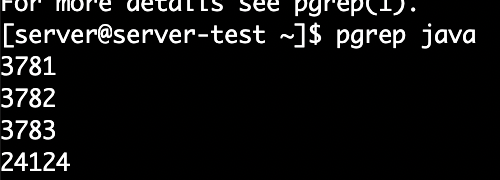
pgrep java可以展示命令为java的所有进程号
pgrep -l java可以展示java的进程号和命令名称
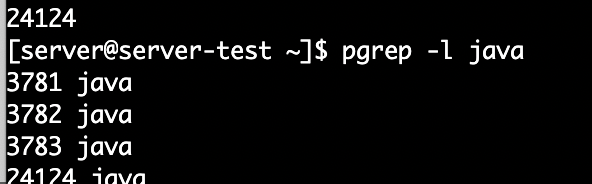
你也可以使用-a展示出完整的名称。

pgrep -U 可以查询指定用户所有的进程。

这样就查询出了server用户的所有进程。
内存相关
meminfo
作用:查看内存信息
使用:
cat /proc/meminfo

可以看到展示的结果非常多,包括总内存、空闲内存、可用内存、Buffer使用的大小、Cache使用大小…大家可以挨个翻译自己看看。
free
作用:查看内存运行情况
语法:
Usage:
 free [options]

Options:
 -b, --bytes         show output in bytes
 -k, --kilo          show output in kilobytes
 -m, --mega          show output in megabytes
 -g, --giga          show output in gigabytes
     --tera          show output in terabytes
     --peta          show output in petabytes
 -h, --human         show human-readable output
     --si            use powers of 1000 not 1024
 -l, --lohi          show detailed low and high memory statistics
 -t, --total         show total for RAM + swap
 -s N, --seconds N   repeat printing every N seconds
 -c N, --count N     repeat printing N times, then exit
 -w, --wide          wide output

     --help     display this help and exit
 -V, --version  output version information and exit

其中total表示物理内存总量;used已经使用了多少内存;free多少内存是空闲的;shared多少内存是被多个进程共享的;buff/cache表示buffer的内存加cache的内存;available表示多少内存是可用的;Swap展示了交换区的信息。
其中free里的信息meminfo里的信息是对应的。
vmstat
作用:全称Virtual Memory Statistics(虚拟内存统计),可对操作系统的虚拟内存、进程、IO读写、CPU等等
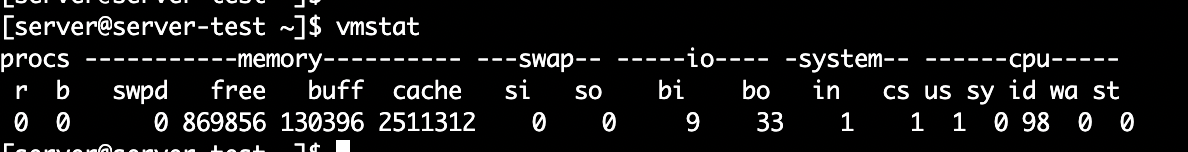
其中procs 表示进程相关的信息,r表示Runable进程数,如果你的r值长期大于逻辑cpu个数的话,那么表示你的cpu可能存在性能瓶颈,应该考虑增加cpu或者通过一些调优手段把r值降下来。
逻辑cpu:物理cpu个数*cpu核心数。b表示处于非中断状态的进程数,它一般指的是被阻塞的进程数。
memory展示内存状态,swpd表示已经使用的虚拟内存大小,free空闲的内存大小,buff用作buffer的内存大小,cache用作cache的内存大小
swap是交换区相关的信息,si全称为swap in 表示每秒从磁盘交换的内存的大小单位kb/s,so 全称为swap out 表示每秒从内存交换到磁盘的大小,单位也是kb/s,当内存够用的时候,这两个值都是0,如果这两个值长期大于0的话就会影响到操作系统的性能。
io,bi全称为block in表示每秒从块存入设备接收到的块数,bo是block out表示每秒发送到块存储设备的块数。一般来说,如果发生了随机io,并且读写是超过1M的这时这两个值会比较大,那一旦这两个值越大,你就会发现cpu在io等待的时间也会越大。
system,in表示每秒的中断数,cs表示每秒上下文的切换数,这两个值也是越小越好的。
cpu,us指的是用户态cpu时间的百分比,sy是内核态cpu时间的百分比,id空闲的cpu时间百分比,wa等待io的cpu时间百分比,st被虚拟机偷去的cpu时间百分比。这一段和top中第三行是一致的。
磁盘相关命令
df
作用:展示磁盘使用情况
语法:
Usage: df [OPTION]... [FILE]...
Show information about the file system on which each FILE resides,
or all file systems by default.

Mandatory arguments to long options are mandatory for short options too.
  -a, --all             include pseudo, duplicate, inaccessible file systems
  -B, --block-size=SIZE  scale sizes by SIZE before printing them; e.g.,
                           '-BM' prints sizes in units of 1,048,576 bytes;
                           see SIZE format below
      --direct          show statistics for a file instead of mount point
      --total           produce a grand total
  -h, --human-readable  print sizes in human readable format (e.g., 1K 234M 2G)
  -H, --si              likewise, but use powers of 1000 not 1024
  -i, --inodes          list inode information instead of block usage
  -k                    like --block-size=1K
  -l, --local           limit listing to local file systems
      --no-sync         do not invoke sync before getting usage info (default)
      --output[=FIELD_LIST]  use the output format defined by FIELD_LIST,
                               or print all fields if FIELD_LIST is omitted.
  -P, --portability     use the POSIX output format
      --sync            invoke sync before getting usage info
  -t, --type=TYPE       limit listing to file systems of type TYPE
  -T, --print-type      print file system type
  -x, --exclude-type=TYPE   limit listing to file systems not of type TYPE
  -v                    (ignored)
      --help     display this help and exit
      --version  output version information and exit

Display values are in units of the first available SIZE from --block-size,
and the DF_BLOCK_SIZE, BLOCK_SIZE and BLOCKSIZE environment variables.
Otherwise, units default to 1024 bytes (or 512 if POSIXLY_CORRECT is set).

SIZE is an integer and optional unit (example: 10M is 10*1024*1024).  Units
are K, M, G, T, P, E, Z, Y (powers of 1024) or KB, MB, ... (powers of 1000).

FIELD_LIST is a comma-separated list of columns to be included.  Valid
field names are: 'source', 'fstype', 'itotal', 'iused', 'iavail', 'ipcent',
'size', 'used', 'avail', 'pcent', 'file' and 'target' (see info page).

GNU coreutils online help: <http://www.gnu.org/software/coreutils/>
For complete documentation, run: info coreutils 'df invocation'

Filesystem指的是文件系统的名称,1K-blocks指的是这个文件系统占用了多少个1K-block ,Used表示使用了多大,Available有多大是可用的,Use%使用了百分之多少,Mounted on表示这个文件系统挂载在哪个路径。
df还可以指定文件:

这样就可以查看这个文件所属的文件系统的信息。
du
作用:显示目录或者文件的大小
语法:
Usage: du [OPTION]... [FILE]...
  or:  du [OPTION]... --files0-from=F
Summarize disk usage of each FILE, recursively for directories.

Mandatory arguments to long options are mandatory for short options too.
  -0, --null            end each output line with 0 byte rather than newline
  -a, --all             write counts for all files, not just directories
      --apparent-size   print apparent sizes, rather than disk usage; although
                          the apparent size is usually smaller, it may be
                          larger due to holes in ('sparse') files, internal
                          fragmentation, indirect blocks, and the like
  -B, --block-size=SIZE  scale sizes by SIZE before printing them; e.g.,
                           '-BM' prints sizes in units of 1,048,576 bytes;
                           see SIZE format below
  -b, --bytes           equivalent to '--apparent-size --block-size=1'
  -c, --total           produce a grand total
  -D, --dereference-args  dereference only symlinks that are listed on the
                          command line
  -d, --max-depth=N     print the total for a directory (or file, with --all)
                          only if it is N or fewer levels below the command
                          line argument;  --max-depth=0 is the same as
                          --summarize
      --files0-from=F   summarize disk usage of the
                          NUL-terminated file names specified in file F;
                          if F is -, then read names from standard input
  -H                    equivalent to --dereference-args (-D)
  -h, --human-readable  print sizes in human readable format (e.g., 1K 234M 2G)
      --inodes          list inode usage information instead of block usage
  -k                    like --block-size=1K
  -L, --dereference     dereference all symbolic links
  -l, --count-links     count sizes many times if hard linked
  -m                    like --block-size=1M
  -P, --no-dereference  don't follow any symbolic links (this is the default)
  -S, --separate-dirs   for directories do not include size of subdirectories
      --si              like -h, but use powers of 1000 not 1024
  -s, --summarize       display only a total for each argument
  -t, --threshold=SIZE  exclude entries smaller than SIZE if positive,
                          or entries greater than SIZE if negative
      --time            show time of the last modification of any file in the
                          directory, or any of its subdirectories
      --time=WORD       show time as WORD instead of modification time:
                          atime, access, use, ctime or status
      --time-style=STYLE  show times using STYLE, which can be:
                            full-iso, long-iso, iso, or +FORMAT;
                            FORMAT is interpreted like in 'date'
  -X, --exclude-from=FILE  exclude files that match any pattern in FILE
      --exclude=PATTERN    exclude files that match PATTERN
  -x, --one-file-system    skip directories on different file systems
      --help     display this help and exit
      --version  output version information and exit

Display values are in units of the first available SIZE from --block-size,
and the DU_BLOCK_SIZE, BLOCK_SIZE and BLOCKSIZE environment variables.
Otherwise, units default to 1024 bytes (or 512 if POSIXLY_CORRECT is set).

SIZE is an integer and optional unit (example: 10M is 10*1024*1024).  Units
are K, M, G, T, P, E, Z, Y (powers of 1024) or KB, MB, ... (powers of 1000).

GNU coreutils online help: <http://www.gnu.org/software/coreutils/>
For complete documentation, run: info coreutils 'du invocation'

展示的是当前目录以及当前目录的子目录一共占用多少空间.
你也可以跟上一个文件:
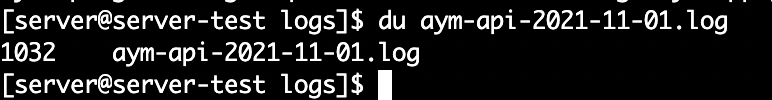
这样指的是这个文件占用多大的空间。
网络相关
netstat
作用:展示网络状态
语法:
usage: netstat [-vWeenNcCF] [<Af>] -r         netstat {-V|--version|-h|--help}
       netstat [-vWnNcaeol] [<Socket> ...]
       netstat { [-vWeenNac] -I[<Iface>] | [-veenNac] -i | [-cnNe] -M | -s [-6tuw] } [delay]

        -r, --route              display routing table
        -I, --interfaces=<Iface> display interface table for <Iface>
        -i, --interfaces         display interface table
        -g, --groups             display multicast group memberships
        -s, --statistics         display networking statistics (like SNMP)
        -M, --masquerade         display masqueraded connections

        -v, --verbose            be verbose
        -W, --wide               don't truncate IP addresses
        -n, --numeric            don't resolve names
        --numeric-hosts          don't resolve host names
        --numeric-ports          don't resolve port names
        --numeric-users          don't resolve user names
        -N, --symbolic           resolve hardware names
        -e, --extend             display other/more information
        -p, --programs           display PID/Program name for sockets
        -o, --timers             display timers
        -c, --continuous         continuous listing

        -l, --listening          display listening server sockets
        -a, --all                display all sockets (default: connected)
        -F, --fib                display Forwarding Information Base (default)
        -C, --cache              display routing cache instead of FIB
        -Z, --context            display SELinux security context for sockets

  <Socket>={-t|--tcp} {-u|--udp} {-U|--udplite} {-S|--sctp} {-w|--raw}
           {-x|--unix} --ax25 --ipx --netrom
  <AF>=Use '-6|-4' or '-A <af>' or '--<af>'; default: inet
  List of possible address families (which support routing):
    inet (DARPA Internet) inet6 (IPv6) ax25 (AMPR AX.25)
    netrom (AMPR NET/ROM) ipx (Novell IPX) ddp (Appletalk DDP)
    x25 (CCITT X.25)
来玩一下:

常见用法:
# 查看全部的socket
netstat -a

# 查看使用tcp协议的网络信息
netstat -t

# 查看使用udp协议的网络信息
netstat -u

# 展示所有状态的tcp监听,并打印程序名称
netstat -natp
route
作用:显示和操作路由表
语法:
Usage: route [-nNvee] [-FC] [<AF>]           List kernel routing tables
       route [-v] [-FC] {add|del|flush} ...  Modify routing table for AF.

       route {-h|--help} [<AF>]              Detailed usage syntax for specified AF.
       route {-V|--version}                  Display version/author and exit.

        -v, --verbose            be verbose
        -n, --numeric            don't resolve names
        -e, --extend             display other/more information
        -F, --fib                display Forwarding Information Base (default)
        -C, --cache              display routing cache instead of FIB

  <AF>=Use -4, -6, '-A <af>' or '--<af>'; default: inet
  List of possible address families (which support routing):
    inet (DARPA Internet) inet6 (IPv6) ax25 (AMPR AX.25)
    netrom (AMPR NET/ROM) ipx (Novell IPX) ddp (Appletalk DDP)
    x25 (CCITT X.25)
使用:参考https://blog.csdn.net/u011857683/article/details/83795435 里面有非常详细的描述
lsof
作用:列出打开的文件
语法:
lsof: illegal option character: -
lsof: -e not followed by a file system path: "lp"
lsof 4.87
 latest revision: ftp://lsof.itap.purdue.edu/pub/tools/unix/lsof/
 latest FAQ: ftp://lsof.itap.purdue.edu/pub/tools/unix/lsof/FAQ
 latest man page: ftp://lsof.itap.purdue.edu/pub/tools/unix/lsof/lsof_man
 usage: [-?abhKlnNoOPRtUvVX] [+|-c c] [+|-d s] [+D D] [+|-f[gG]] [+|-e s]
 [-F [f]] [-g [s]] [-i [i]] [+|-L [l]] [+m [m]] [+|-M] [-o [o]] [-p s]
[+|-r [t]] [-s [p:s]] [-S [t]] [-T [t]] [-u s] [+|-w] [-x [fl]] [--] [names]
Defaults in parentheses; comma-separated set (s) items; dash-separated ranges.
  -?|-h list help          -a AND selections (OR)     -b avoid kernel blocks
  -c c  cmd c ^c /c/[bix]  +c w  COMMAND width (9)    +d s  dir s files
  -d s  select by FD set   +D D  dir D tree *SLOW?*   +|-e s  exempt s *RISKY*
  -i select IPv[46] files  -K list tasKs (threads)    -l list UID numbers
  -n no host names         -N select NFS files        -o list file offset
  -O no overhead *RISKY*   -P no port names           -R list paRent PID
  -s list file size        -t terse listing           -T disable TCP/TPI info
  -U select Unix socket    -v list version info       -V verbose search
  +|-w  Warnings (+)       -X skip TCP&UDP* files     -Z Z  context [Z]
  -- end option scan
  +f|-f  +filesystem or -file names     +|-f[gG] flaGs
  -F [f] select fields; -F? for help
  +|-L [l] list (+) suppress (-) link counts < l (0 = all; default = 0)
                                        +m [m] use|create mount supplement
  +|-M   portMap registration (-)       -o o   o 0t offset digits (8)
  -p s   exclude(^)|select PIDs         -S [t] t second stat timeout (15)
  -T qs TCP/TPI Q,St (s) info
  -g [s] exclude(^)|select and print process group IDs
  -i i   select by IPv[46] address: [46][proto][@host|addr][:svc_list|port_list]
  +|-r [t[m<fmt>]] repeat every t seconds (15);  + until no files, - forever.
       An optional suffix to t is m<fmt>; m must separate t from <fmt> and
      <fmt> is an strftime(3) format for the marker line.
  -s p:s  exclude(^)|select protocol (p = TCP|UDP) states by name(s).
  -u s   exclude(^)|select login|UID set s
  -x [fl] cross over +d|+D File systems or symbolic Links
  names  select named files or files on named file systems
Anyone can list all files; /dev warnings disabled; kernel ID check disabled.
常用最多的命令:lsof -i:8080 这样可以展示占用8080端口的进程。
常见用法:
# 列出所有打开的文件
lsof

# 查看哪些进程正在使用1.txt
lsof 1.txt

# 递归查看test_dir目录及其文件的信息
lsof +D test_dir

# 查看java进程打开的文件
lsof -c java

# 查看java或mysql打开的文件
lsof -c java -c mysql

# 列出所有的网络连接
lsof -i
调优相关命令
我们再来探讨一些Linux调优常用的一些命令,通过这些命令能够帮助我们了解一些linux的运行情况,进而在操作系统前面定位系统瓶颈。
入门级
系统相关
查看操作系统发行版本
不同的Linux发行版(例如CentOS与Debain)、以及不同版本(例如Centos6.x与Centos7.x)查看版本方式不同,下面列出的所有方式,总有一款适用于你的环境。
- 方法1:通过/etc目录下的文件查看
- /etc/os-release
- /etc/system-release
- /etc/redhat-release
- /etc/centos-release
- /etc/issue
- 方法2:执行lsb_release -a

uname
作用:显示操作系统的信息
语法:
Usage: uname [OPTION]...
Print certain system information.  With no OPTION, same as -s.

  -a, --all                打印所有信息
  -s, --kernel-name        打印内核信息
  -n, --nodename           打印网络节点名称
  -r, --kernel-release     打印内核版本
  -v, --kernel-version     打印内核版本
  -m, --machine            打印硬件名称
  -p, --processor          打印处理器名称
  -i, --hardware-platform  打印硬件平台
  -o, --operating-system   打印操作系统
      --help     display this help and exit
      --version  output version information and exit

GNU coreutils online help: <http://www.gnu.org/software/coreutils/>
For complete documentation, run: info coreutils 'uname invocation'
uname -all:

第一列表示操作系统的内核,第二列表示主机名,第三列是内核版本,第四列也是内核版本(但是表示这个linux内核是什么时候发布的),x86_64是硬件的架构名称,第二个x86_64是处理器的类型名称,第三个x86是当前硬件的平台是什么。最后GNU/Linux是操作系统的名称。
uptime
作用:展示系统运行了多久

可以看到,当前时间是21点41分,启动了170天5小时58分钟,当前登录了1个用户,当前平均负载:0.13,0.05,0.01(分别表示最近1分钟、最近5分钟、最近15分钟的平均负载)
用户相关
id
作用:展示用户的ID、以及所属集群组的ID
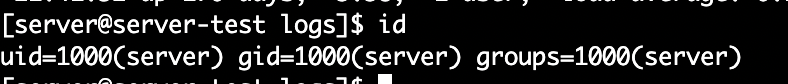
uid 表示当前用户id是1000,登录的用户名称是server。
gid表示server这个用户当前所使用的组,id是1000,组名称也是server。
groups表示server这个用户所拥有的所有组的id以及名称。
w
作用:展示当前登录系统的用户
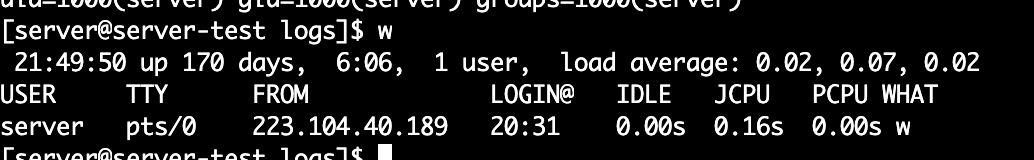
展示了三行结果,第一行类似于uptime
从第二行开始,是当前登录系统的用户信息
USER展示当前登录的用户有哪些。
TTY是当前用户可以使用虚拟终端的别名,可以认为这是一次会话的唯一标识。
FROM标识当前用户从那一台机器登录进来的
LOGIN什么时间点登录的
IDLE空闲时间
JCPU指连接上这个TTY的所有进程所占用的时间
PCPU是指当前进程所占用的时间
WHAT指当前用户所运行的进程是什么
who
作用:展示当前登录用户的信息

展示的结果和w大同小异
whoami
作用:展示自己登录的状态信息
它可以认为是 who am i的简化版
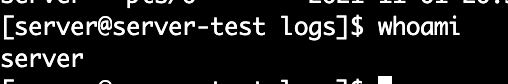
只展示了当前登录的用户名
last
作用:展示用户最近登录的信息
语法:
last: invalid option -- '-'
Usage: last [-num | -n num] [-f file] [-t YYYYMMDDHHMMSS] [-R] [-adioxFw] [username..] [tty..]
常用参数:
- R:结果省略从哪里登录的一栏
- -num/-n/num:展示前num条
- username:展示指定用户的登录信息
- tty:只显示指定虚拟终端的登录信息

可以列出最近这段时间登录的信息。分别表示谁登陆的、虚拟终端别名、从哪里登录的、登录的起止时间、登录持续多久。
last列出的结果是非常多的,你也可以做过滤,比如:

这样只展示最近5条信息。
或者筛选指定用户的登录信息:

CPU相关
cpuinfo
作用:查看cpu相关信息
使用:
cat /proc/cpuinfo
# 概念
1. 物理CPU数:主板上实际插入的CPU数量
2. CPU核心数:单块CPU上面能处理数据的芯片组的数量,如双核、四核等
3. 逻辑CPU数:一般来说:
	逻辑CPU = 物理CPU个数✖️每颗核数    ## 不支持超线程技术或未开启此技术
	逻辑CPU = 物理CPU个数✖️每颗核数✖️2  ##表示服务器的CPU支持超线程技术
常见用法:
# 查看系统有几颗物理CPU(结果有几行说明有几个物理CPU)
cat /proc/cpuinfo | grep "physical id" | sort | uniq

# 查询系统每颗物理CPU的核心数
cat /proc/cpuinfo | grep "cpu cores" | uniq

# 每颗物理CPU核心是否启用了超线程技术。如果启用这个技术,那么每个物理核心又可以分为两个逻辑处理器
cat /proc/cpuinfo | grep -e "cpu cores" -e "siblings" | sort | uniq

# 查询系统具有多少个CPU
cat /proc/cpuinfo | grep "processor" | wc -l


 1万+
1万+


 被折叠的 条评论
为什么被折叠?
被折叠的 条评论
为什么被折叠?
 到【灌水乐园】发言


