


主要先设置 emphasis.scale= true 开启鼠标移入高亮动画,利用dispatchAction方法设置默认高亮组 块, 再检测鼠标的mouseover时间,当检测到鼠标悬停事件,取消默认选中高亮。
实现效果如下: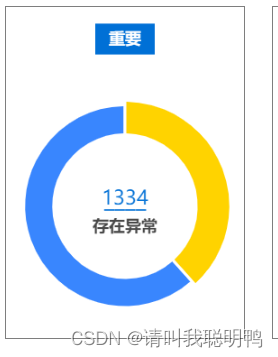
  set_veryImportantChart(get_data) {
      //除了非常重要的数据
      let unnormal_total = get_data.dataSourAbNormalTotal - get_data.count;
      // 判断下划线长度
      let underlin = this.underline_fun(get_data.count);
      this.veryImportantChart.clear();
      this.veryImportantChart.setOption({
        tooltip: {
          trigger: "item",
        },
        //标题
        title: {
          text: get_data.title,
          left: "center",
          top: "5%",
          textStyle: {
            fontSize: 18,
            color: "white",
            fontWeight: "bolder",
            height: 20,
            lineHeight: 22.5,
          },
          backgroundColor: "#0070D6", //背景
          padding: [7, 15, 7, 15],
          show: true, //是否显示
        },
        // 中心文本
        graphic: [
          {
            //环形图中间添加可点击数字
            type: "text", //通过不同top值可以设置上下显示
            left: "center",
            top: "55%",
            style: {
              text: `${get_data.count}`,
              textAlign: "center",
              fill: "#0A75D7", //文字的颜色
              width: 30,
              height: 30,
              fontSize: 22,
              fontWeight: 500,
            },
          },
          {
            //环形图中间添加可点击数字
            type: "text", //通过不同top值可以设置上下显示
            left: "center",
            top: "54%",
            style: {
              text: `${underlin}`,
              textAlign: "center",
              fill: "#0A75D7", //文字的颜色
              fontSize: 26,
              fontWeight: 800,
            },
          },
          {
            //环形图中间添加文字
            type: "text", //通过不同top值可以设置上下显示
            left: "center",
            top: "64%",
            // 表示不响应事件。
            silent: true,
            style: {
              text: "存在异常",
              textAlign: "center",
              fill: "#484848", //文字的颜色
              fontSize: 18,
              fontWeight: 600,
            },
          },
        ],
        series: [
          {
            type: "pie",
            width: "100%",
            height: "100%",
            center: ["50%", "60%"], //圆心
            radius: ["60%", "85%"], //内外半径
            color: ["#FFC000", "#3986FE"], // 圆环图的颜色
            avoidLabelOverlap: false,
            // 饼图图形上的文本标签
            label: {
              show: false,
              position: "center", // 标签的位置。'outside'饼图扇区外侧
              formatter: "{a|存在异常}", // 标签内容
              rich: {
                a: {
                  color: "red",
                  lineHeight: 10,
                  padding: [10, 0, 0, 0],
                },
              },
            },
            itemStyle: {
              borderRadius: 1, //边框圆角
              borderColor: "#fff",
              borderWidth: 3,
            },
            emphasis: {
              scale: true, //鼠标移入变大
              label: {
                show: false,
                fontSize: "20",
                fontWeight: "bold",
              },
            },
            labelLine: {
              show: false,
            },
            data: [
              {
                value: get_data.count,
                name: get_data.title,
              },
              { value: unnormal_total, name: "其他" },
            ],
          },
        ],
      });
      //设置默认选中高亮部分
    this.veryImportantChart.dispatchAction({
        type: "highlight",
        seriesIndex: 0,
        dataIndex: 0,
      });
      //检测鼠标移入后
      this.veryImportantChart.on("mouseover", (e) => {
        if (e.dataIndex == 0) {
          return;
        } else {
          //当检测到鼠标悬停事件,取消默认选中高亮
          this.veryImportantChart.dispatchAction({
            type: "downplay",
            seriesIndex: 0,
            dataIndex: 0,
          });
        }
      });
      //检测鼠标移出后显示之前默认高亮的那块
      this.veryImportantChart.on("mouseout", () => {
        this.veryImportantChart.dispatchAction({
          type: "highlight",
          seriesIndex: 0,
          dataIndex: 0,
        });
      });
           // 页面大小发生改变时Echarts也跟着发生改变
      window.addEventListener("resize", () => {
        this.veryImportantChart.resize();
      });
    },


 被折叠的 条评论
为什么被折叠?
被折叠的 条评论
为什么被折叠?
 到【灌水乐园】发言


