


 本文详细介绍了R语言的基础知识,包括R的官方网站、包和库的管理、数据操作(如向量、矩阵、数组和数据框)、基本命令如查看工作空间、数据可视化、线性回归分析,以及如何在RStudio中安装和管理包,以及与MySQL的交互。此外,还涵盖了绘图选项和C++集成等内容。
R的资源
- R主页:https://www.r-project.org
- R的包和库:https://cran.r-project.org
- R的博客:https://www.r-bloggers.com
- R语言的数据《数据挖掘与R语言》、《R语言实战》、《R语言编程艺术》
R的命令
查看R可以作哪些图
demo(graphics)
R中向量表示
c(1,2,5,5)
R中的赋值
x <- 1
查找帮助
查找帮助文档:help.start()
查找函数的帮助文档:help("函数名") or ? 函数名
R的工作空间
查看当前工作目录
getwd()
修改工作目录
setwd("新的工作目录")
显示最近使用的命令
history()
R包
查看当前所有包
library()
查找包的使用帮助
help(package="包名")
安装包
install.packages("包名")
导入包
library(包名)
- Rstuio中安装包
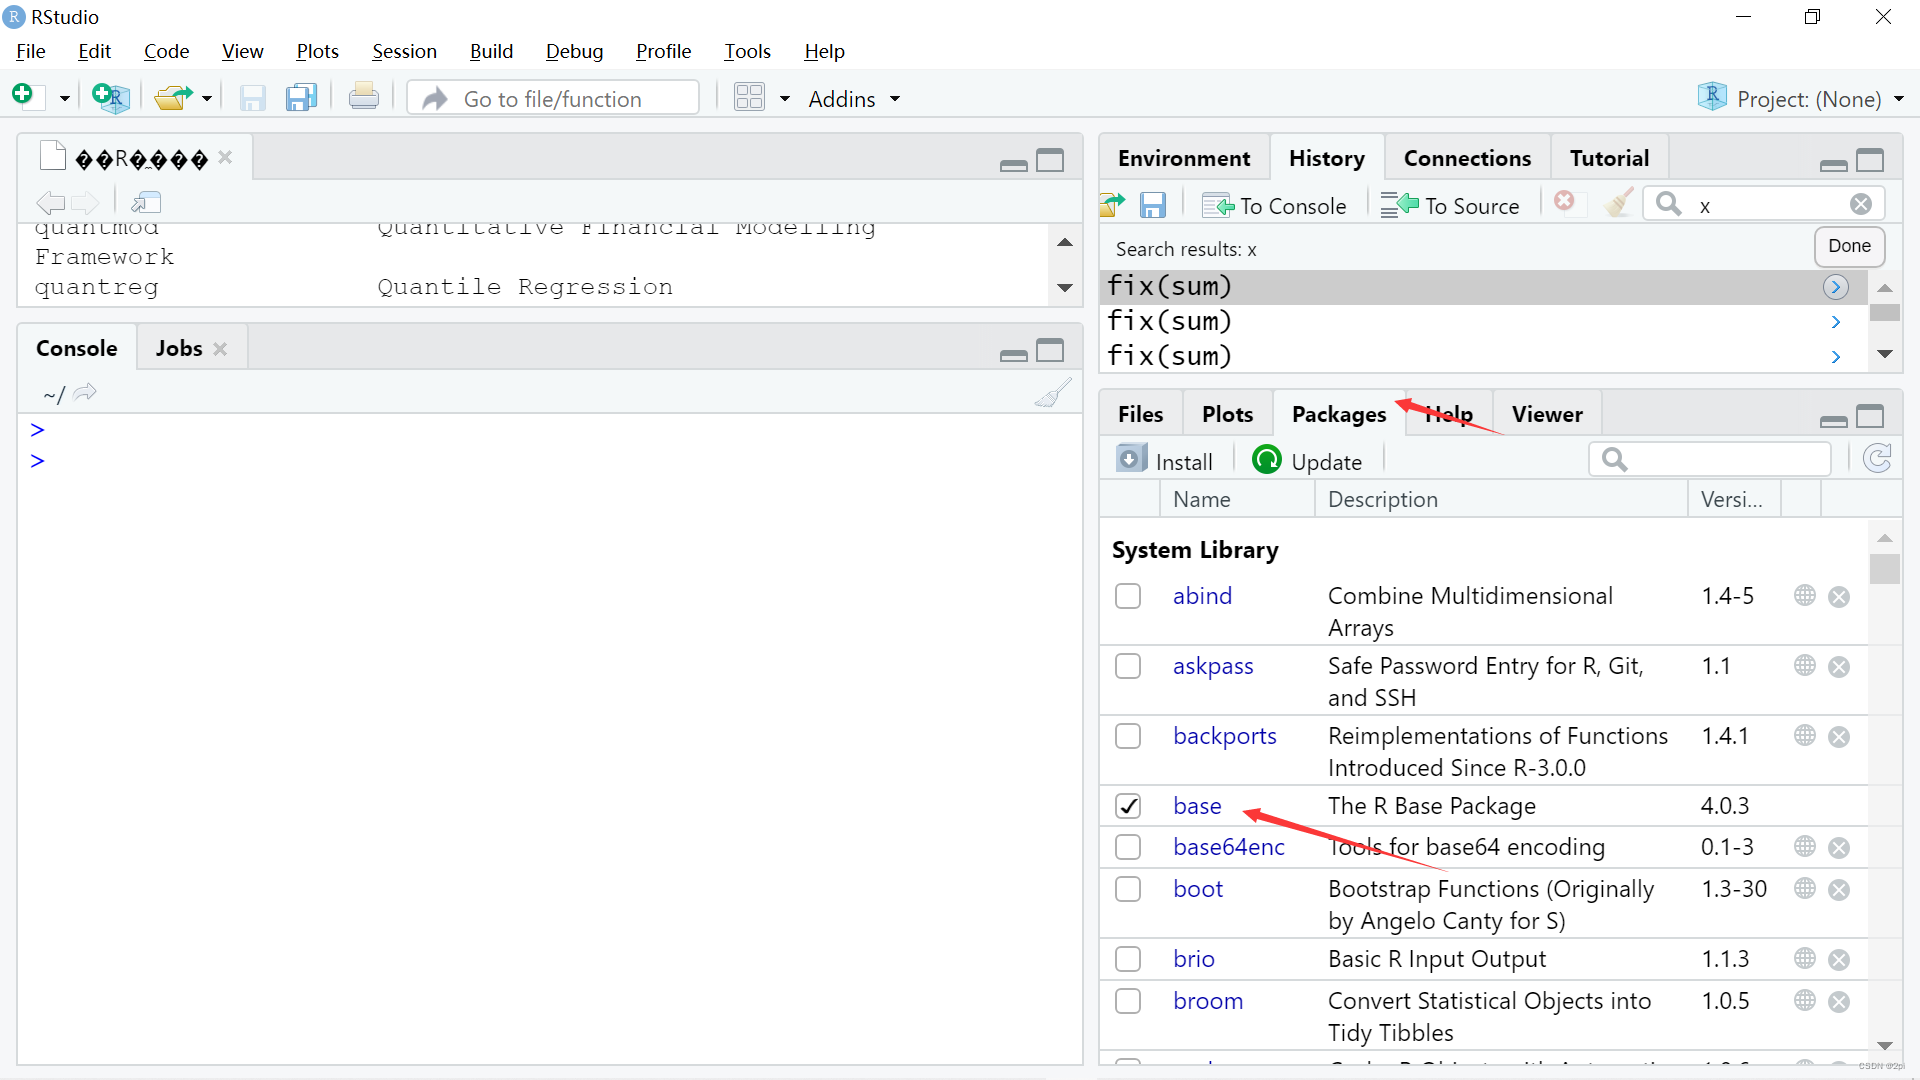
解决包不适用R的版本问题
-
百度搜索该包
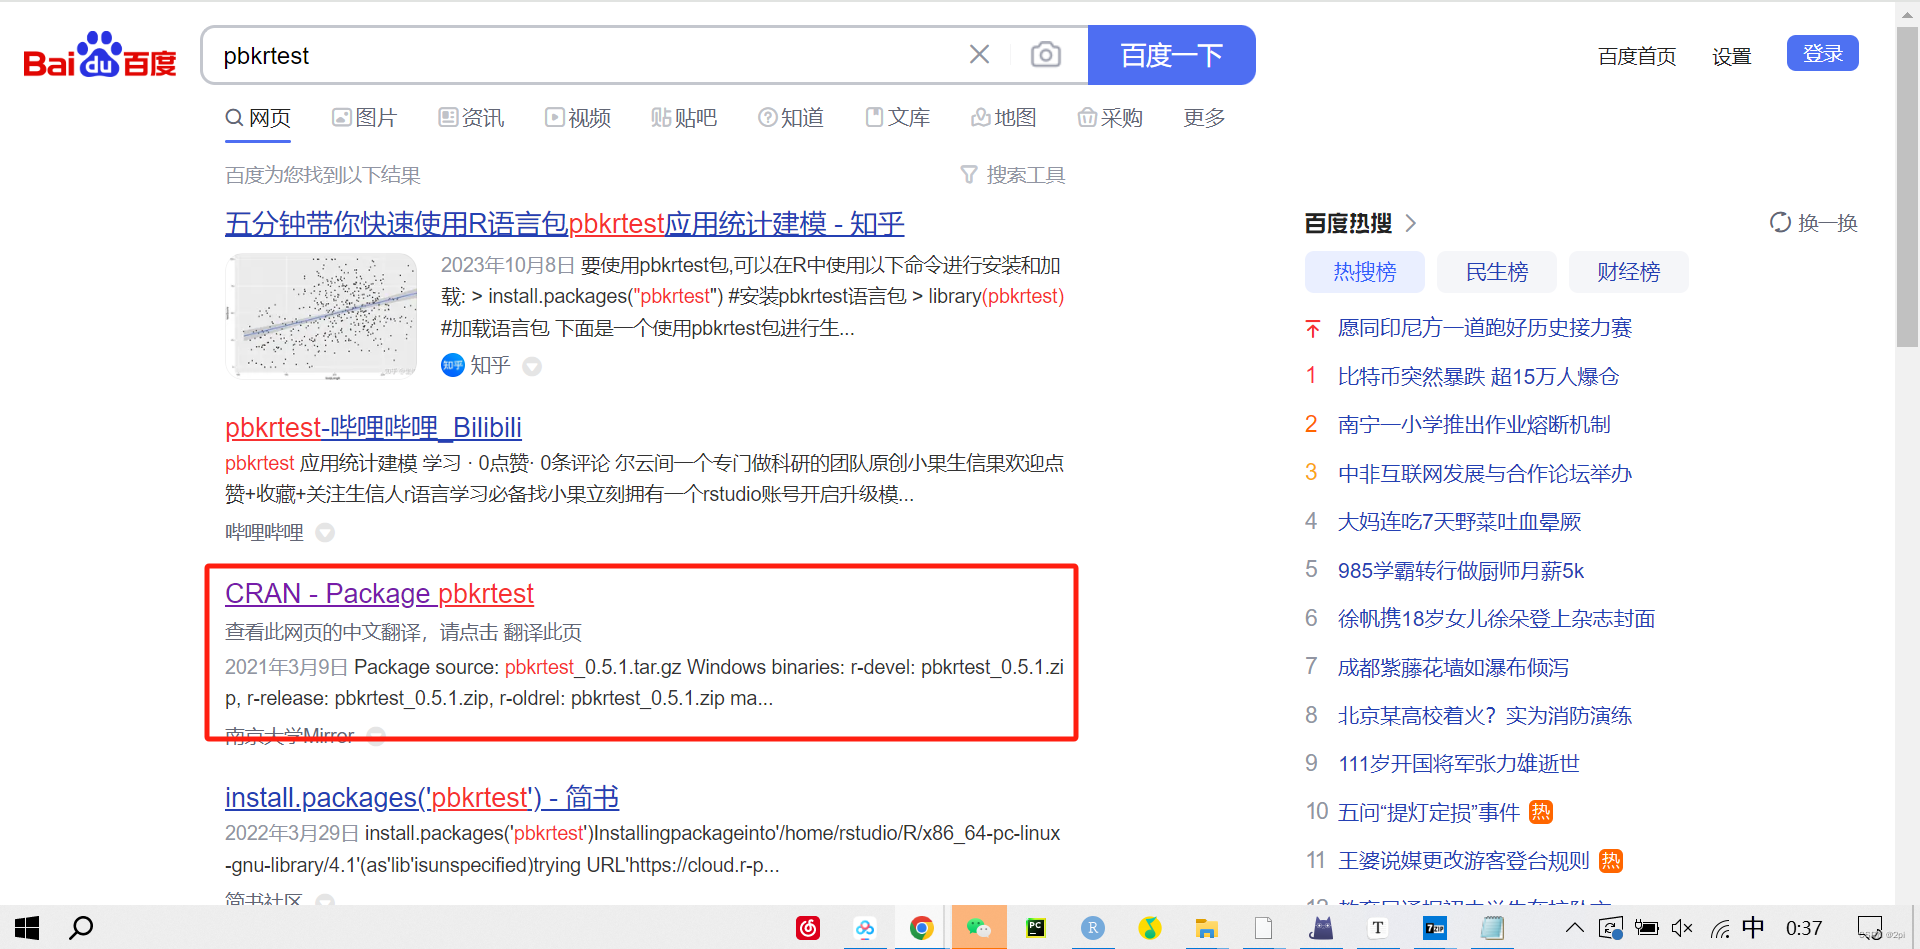
-
下载某个版本的包
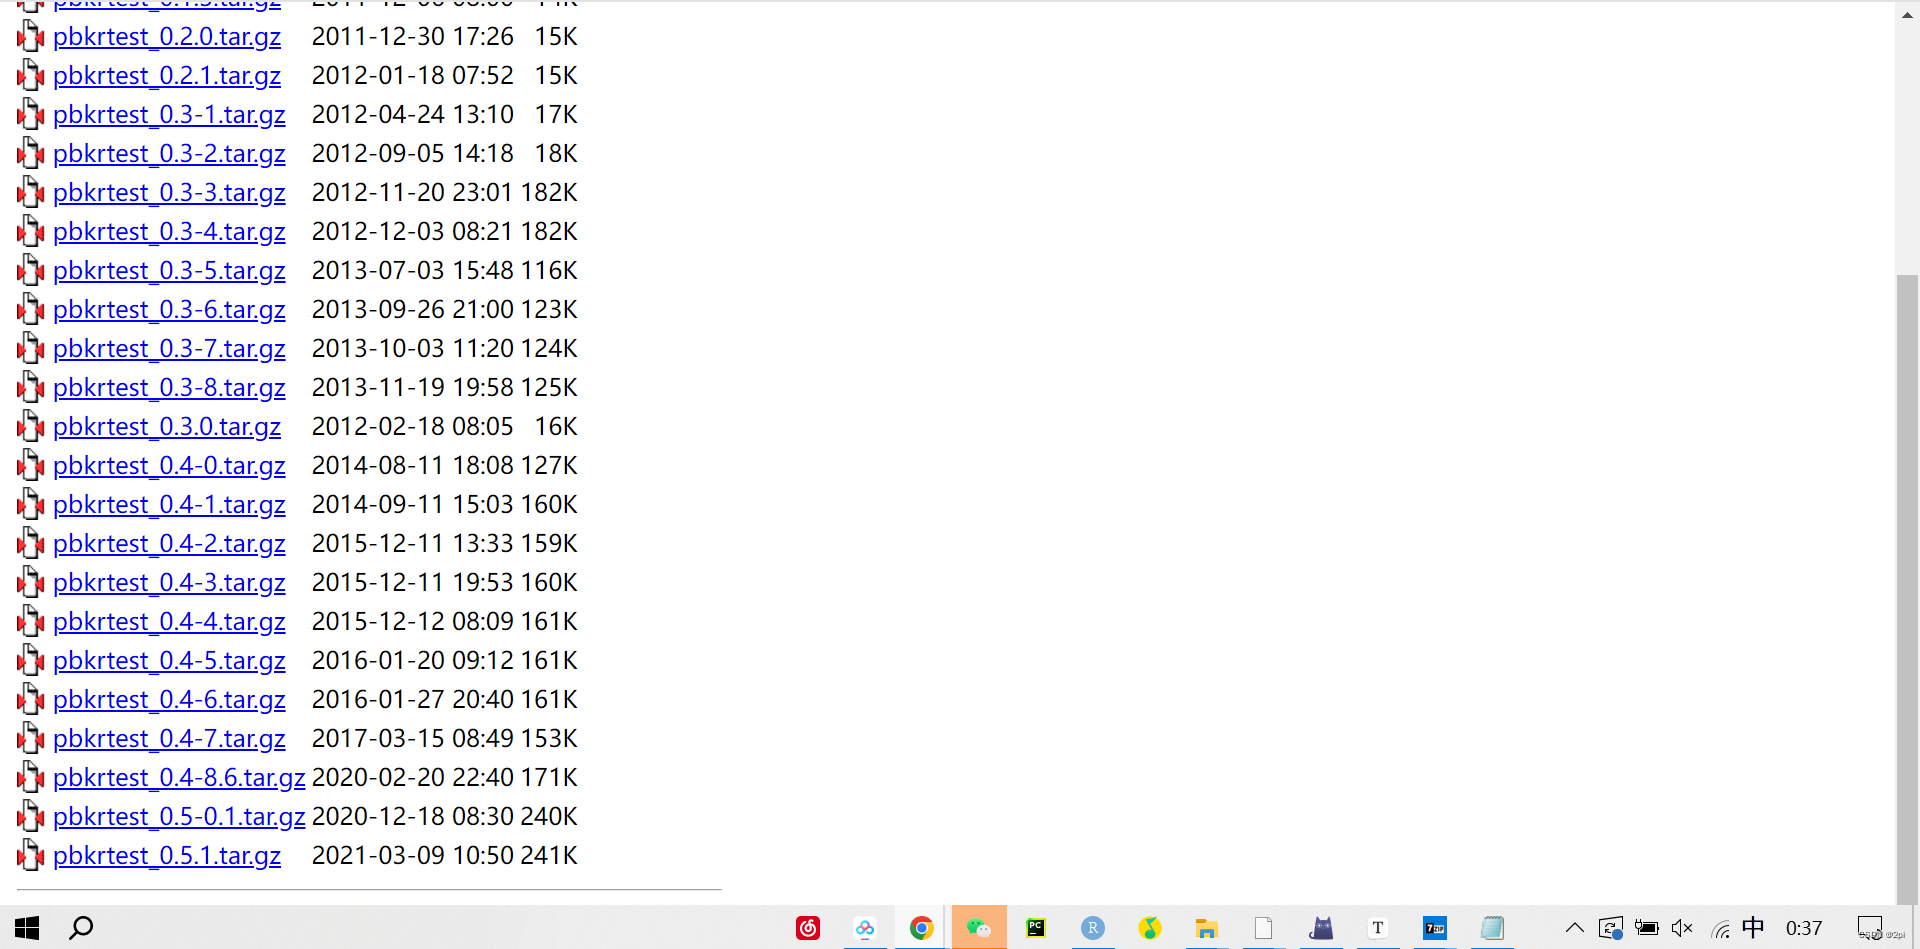
-
打开gz压缩包中的DESCRIPTION,查看适用的R版本
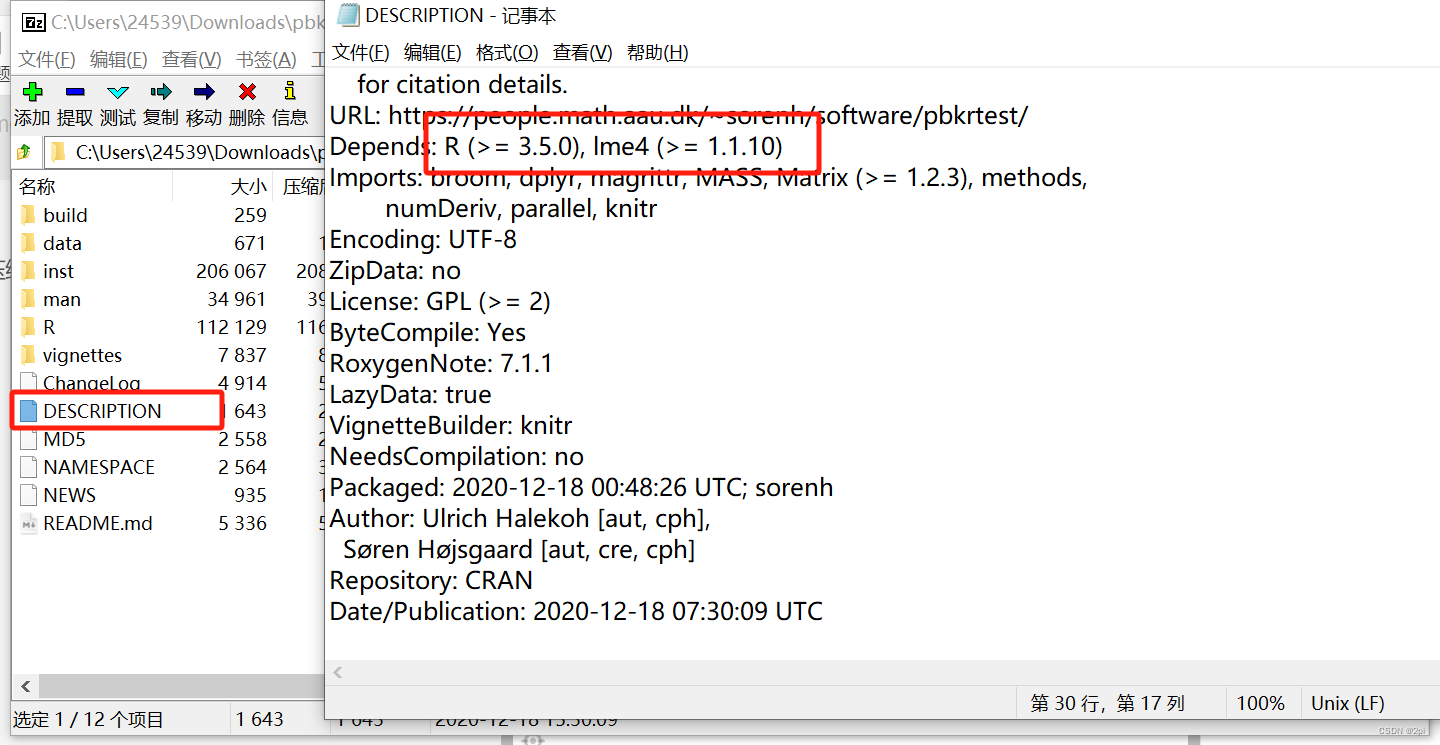
4.本地安装
install.packages(pkgs="C://Users/24539/Downloads/pbkrtest_0.5-0.1.tar.gz",repos=NULL)
更新包
update.packages("包名")
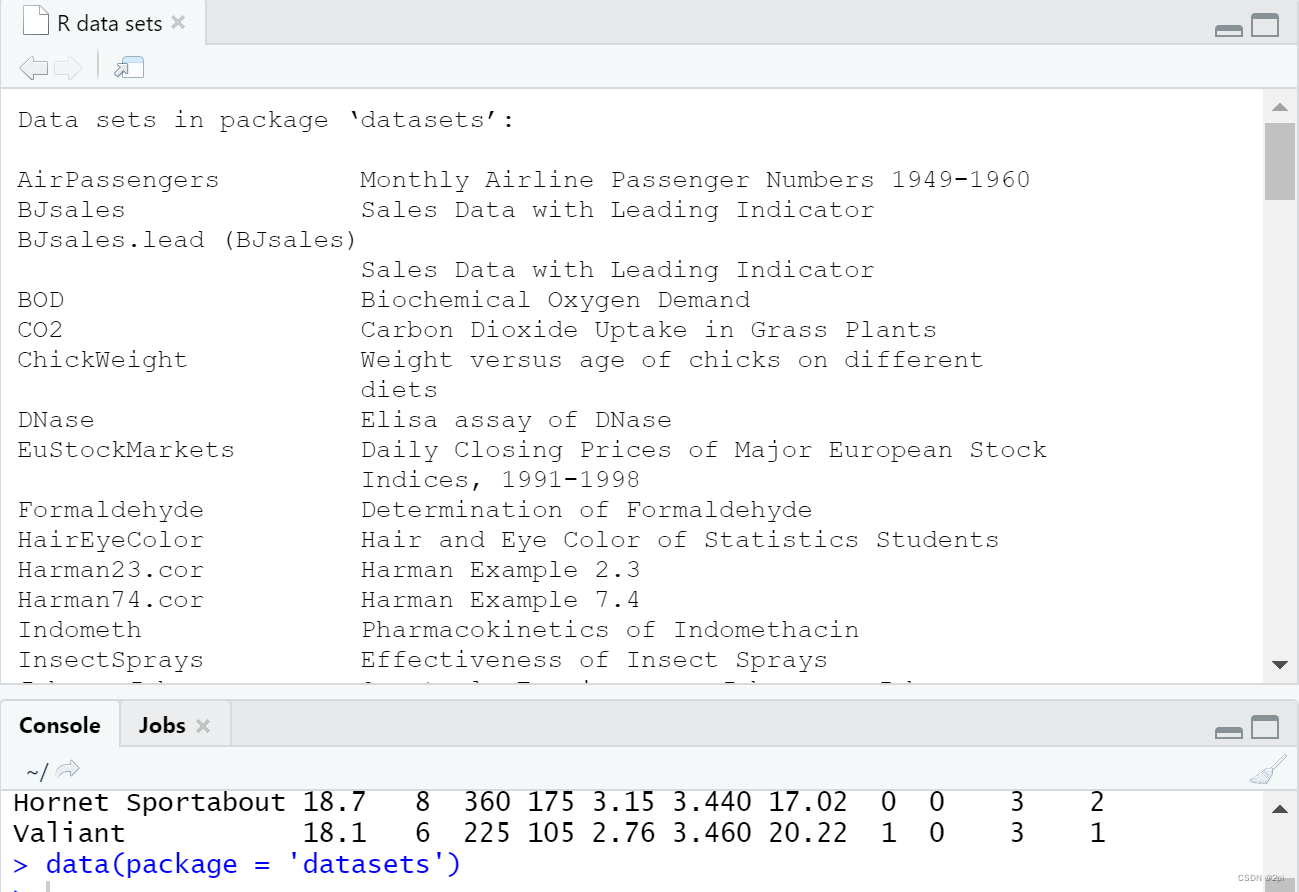
查看R中自带的数据包
data(package = 'datasets')
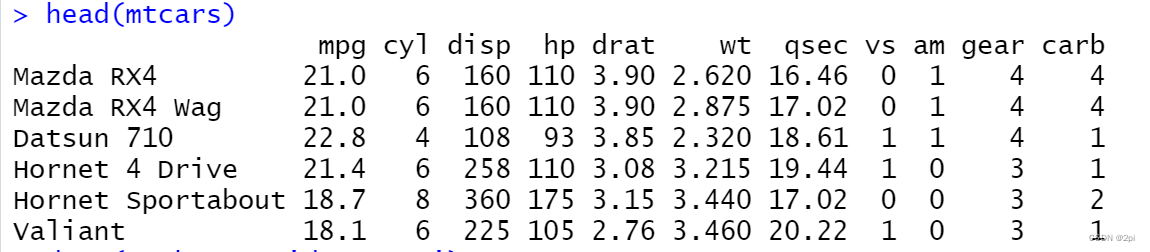
查看数据集前6条
head("数据集名")
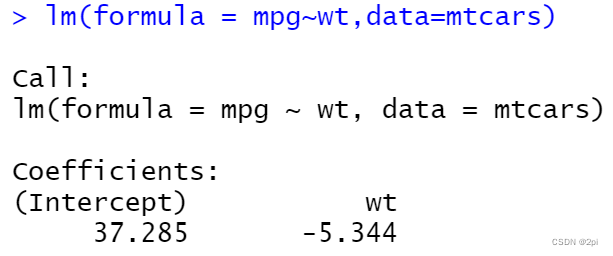
线性回归
对汽车重量和里程做线性回归
head(mtcars)
lm(formula = mpg~wt,data=mtcars)
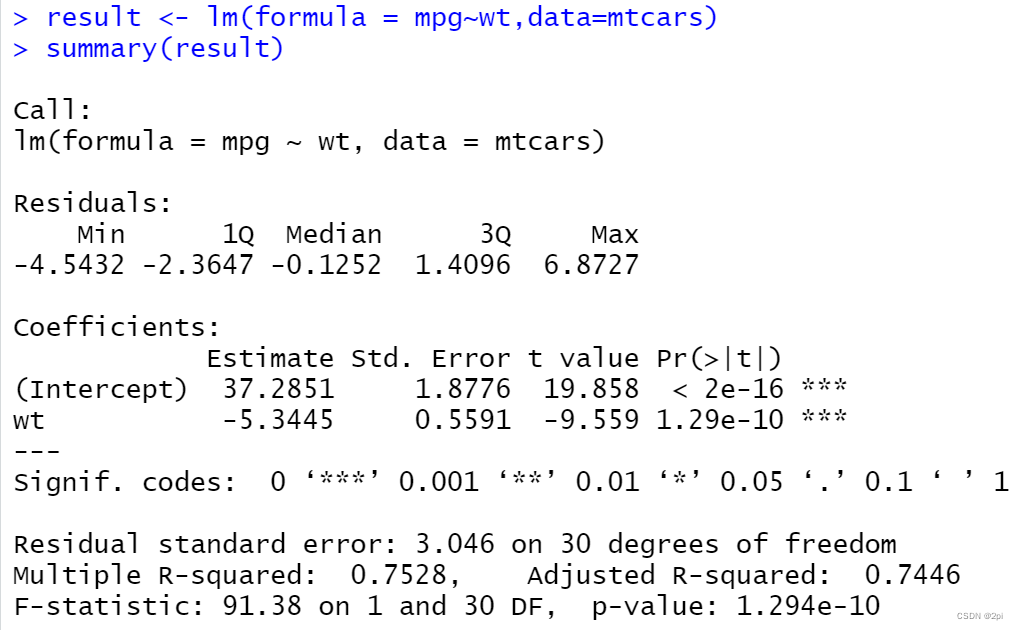
result <- lm(formula = mpg~wt,data=mtcars)
summary(result)
plot(result)
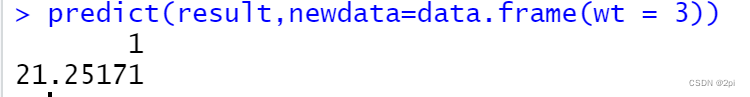
predict(result,newdata=data.frame(wt = 3))
数据集
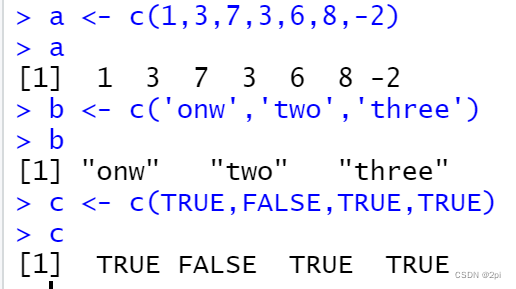
向量
默认创建的列向量
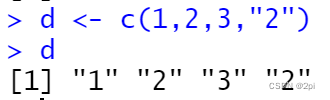
向量中的数据必须拥有相同的类型,不能混用
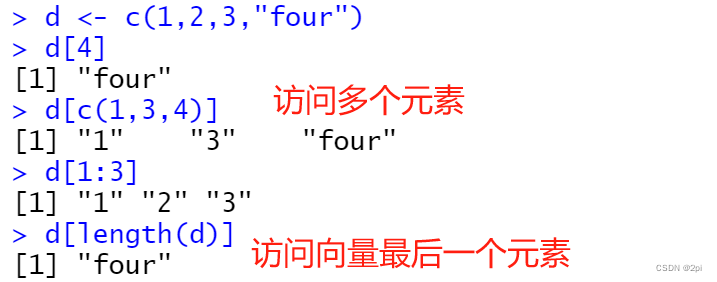
向量的切片
R的下标与python不同是从1开始的
删除向量中特定元素
> x <- c(1,2,3,4,13,5,6)
> x
[1]  1  2  3  4 13  5  6
> x[-5]%删除第五个元素
[1] 1 2 3 4 5 6
> x[-(1:5)]删除1到5元素
[1] 5 6
矩阵
matrix(data = NA, nrow = 1, ncol = 1, byrow = FALSE,
       dimnames = NULL)
'''
data:向量类型
nrow:行数
ncol:列数
byrow表示按行填充,默认False,也就是默认列填充
dimnames:列表类型
'''
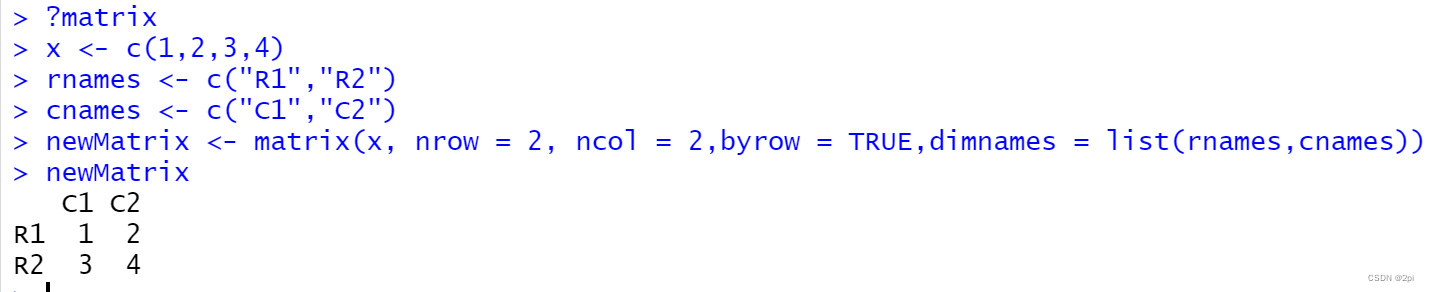
x <- c(1,2,3,4)
rnames <- c("R1","R2")
cnames <- c("C1","C2")
newMatrix <- matrix(x, nrow = 2, ncol = 2,byrow = TRUE,dimnames = list(rnames,cnames))
newMatrix
C1 C2
R1  1  2
R2  3  4
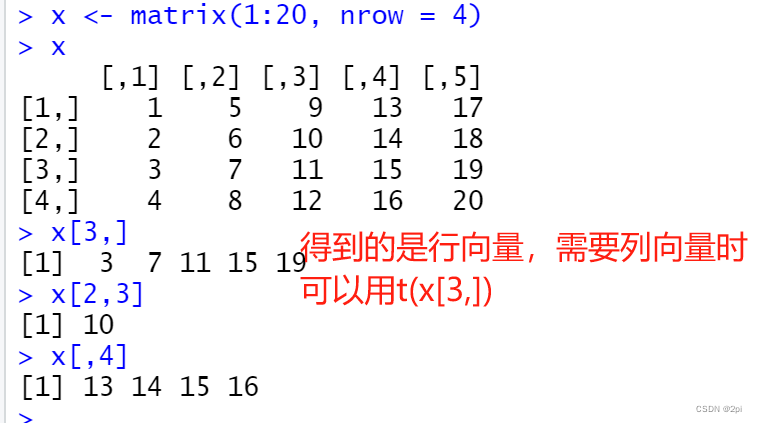
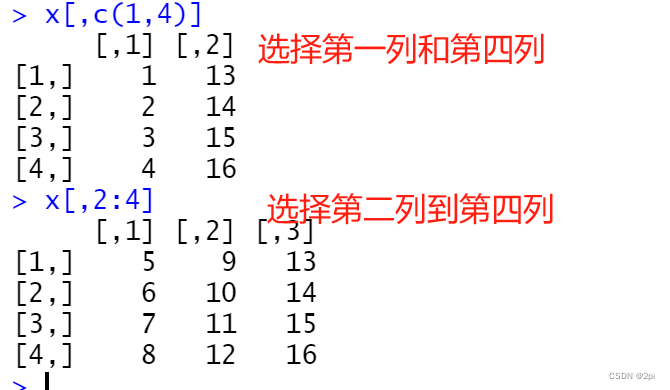
矩阵的切片
数组
array(data = NA, dim = length(data), dimnames = NULL)
data:向量
dim:向量
dimnames:列表
dim1 <- c("A1","A2","A3")
dim2 <- c("B1","B2")
dim3 <- c("C1","C2","C3","C4")
d <- array(1:24,c(3,2,4),list(dim1,dim2,dim3))
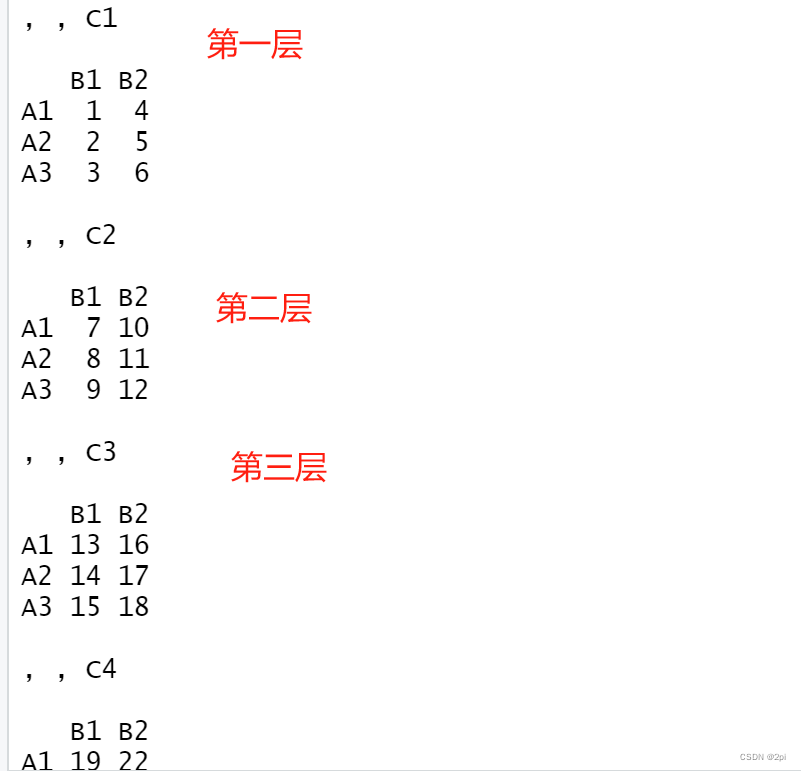
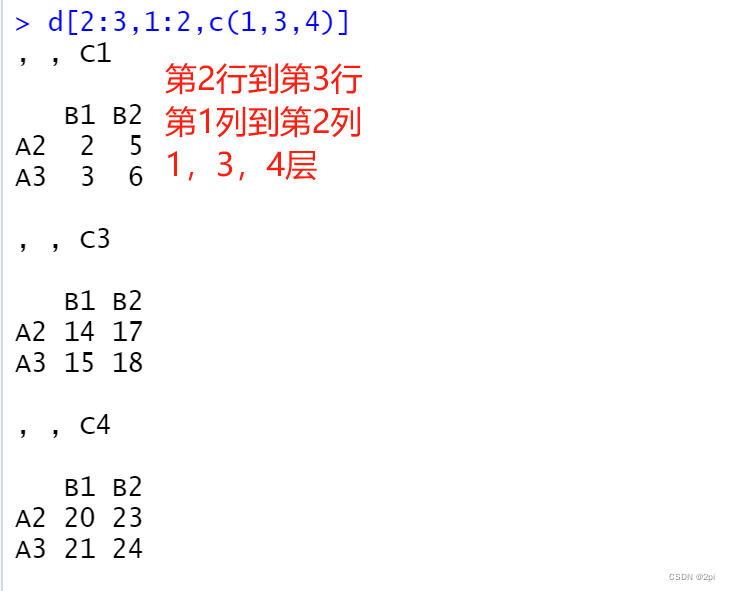
数组的切片
dim1 <- c("A1","A2","A3")
dim2 <- c("B1","B2")
dim3 <- c("C1","C2","C3","C4")
d <- array(1:24,c(3,2,4),list(dim1,dim2,dim3))
-
访问单个元素
d[1,2,3] -
访问多个元素
数据框(DataFrame)
patientID <- c(1,2,3,4)
age <- c(25,34,28,52)
diabetes <- c("Type1","Type2","Type3","Type2")
status <- c("poor","improved","Excellent","poor")
patientData <- data.frame(patientID,age,diabetes,status)
patientData
patientID age diabetes    status
1         1  25    Type1      poor
2         2  34    Type2  improved
3         3  28    Type3 Excellent
4         4  52    Type2      poor
数据框的切片
patientData[1:2]
  patientID age
1         1  25
2         2  34
3         3  28
4         4  52
patientData[c("patientID","status")]
  patientID    status
1         1      poor
2         2  improved
3         3 Excellent
4         4      poor

patientData$age
[1] 25 34 28 52
patientData[‘age’]
age
1 25
2 34
3 28
4 52
data$age 与data[‘age’]区别
前者返回的是向量
后者返回的是数据框
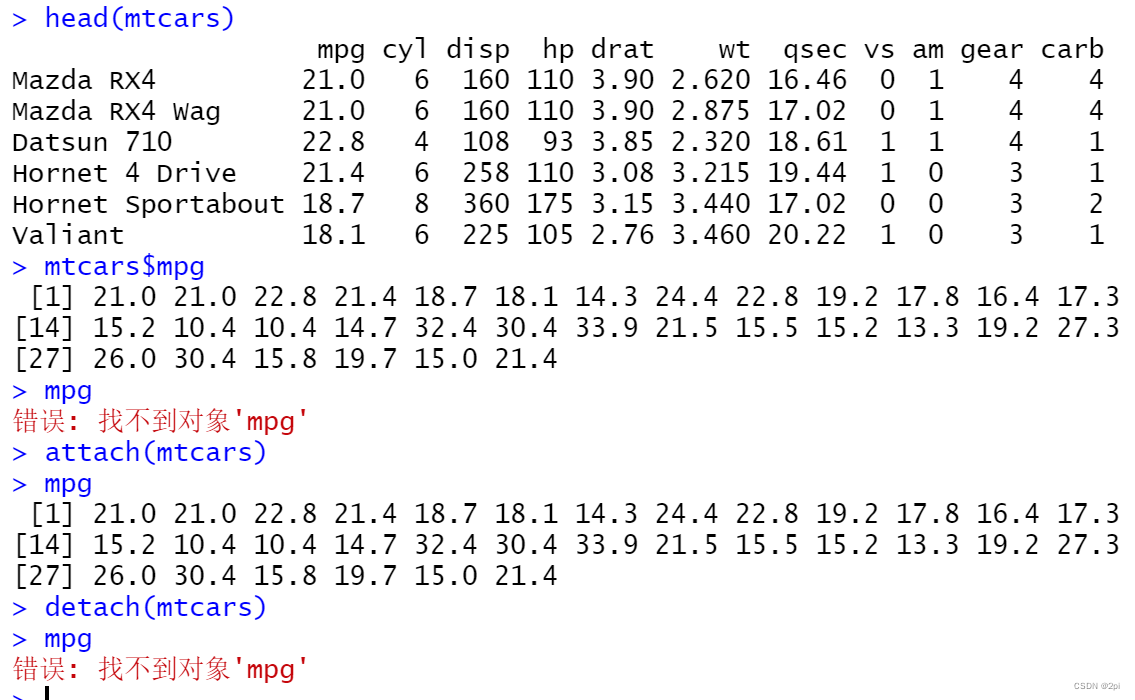
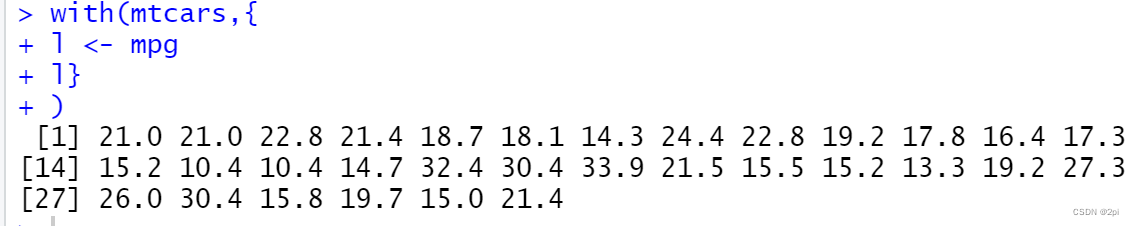
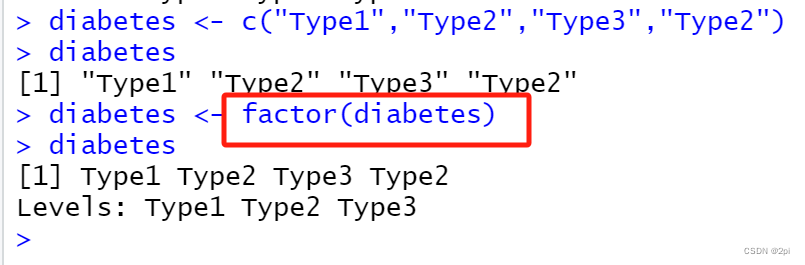
attach、detach、with、factor函数
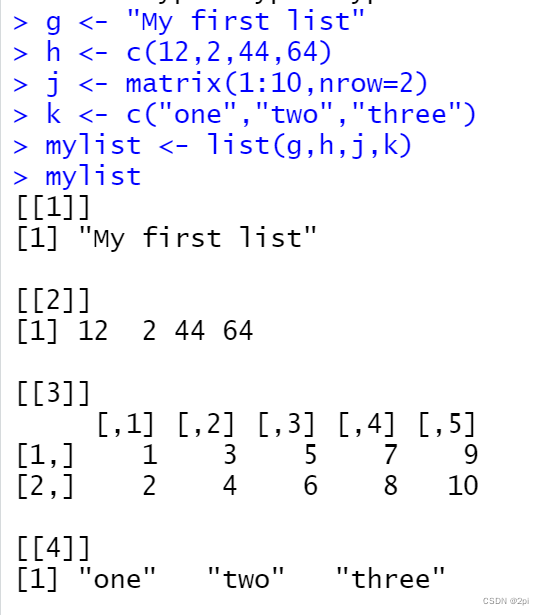
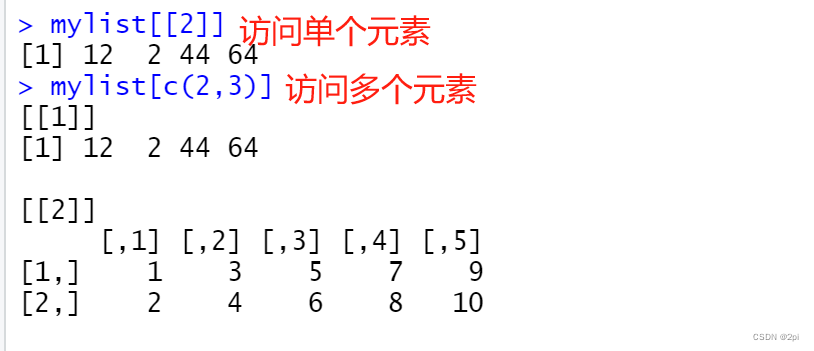
列表
R常用命令
ls()列举当前所有变量,rm(对象)删除变量
ls()
character(0)
data <- c(1,2,3,4)
strings <- "I love R"
ls()
[1] "data"    "strings"
rm(data)
ls()
[1] "strings"
a <- 1
A <- 2
ls()
[1] "a"       "A"       "strings"
R中对象区分大小写
length()向量长度
length(c(1,2,3,4))
[1] 4
mode()查看变量的类型
mode(c(1,2,3,4))
[1] "numeric"
mode(c(1,2,3,"R"))
[1] "character"
更改向量的元素
data <- c(1,2,3,"R")
data[4] <- 4
data
[1] "1" "2" "3" "4"
向量的运算
平方根运算
x <- c(4,8,9,15,24)
y <- sqrt(x)
y
[1] 2.000000 2.828427 3.000000 3.872983 4.898979
z <- x + y
z
[1]  6.00000 10.82843 12.00000 18.87298 28.89898
长度不等向量的运算
x <- c(1,1,1,1,1,1)
y <- c(2,2,2)
z <- x + y
z
[1] 3 3 3 3 3 3
生成向量
x <- 1:10
x
 [1]  1  2  3  4  5  6  7  8  9 10
seq(1,10,2)
[1] 1 3 5 7 9
rep(5,10)
 [1] 5 5 5 5 5 5 5 5 5 5
rep(1:3,3)
[1] 1 2 3 1 2 3 1 2 3
生成标准正态分布随机数
rnorm(10)
 [1] -0.20226547  0.66673655 -0.81028879 -0.03103865  0.44383882
 [6]  0.94295253 -1.10994216 -1.96128614 -1.91200126 -0.32936472
rnorm(6,mean=6,sd=2)
[1] 4.363082 5.859181 7.250305 7.649266 8.320240 8.906344
向量的条件选择
x <- c(-1,2,-6,7,13,53)
x[x>0]
[1]  2  7 13 53
x[x<2]
[1] -1 -6
x[x<2 | x >5]
[1] -1 -6  7 13 53
x[x>2 & x <8]
[1] 7
| 与 | 或 |
|---|---|
| $ | | |
删除向量中特定元素
x[-5]
[1] 1 2 3 4 5 6
x[-(1:5)]
[1] 5 6
R的数据导入方法
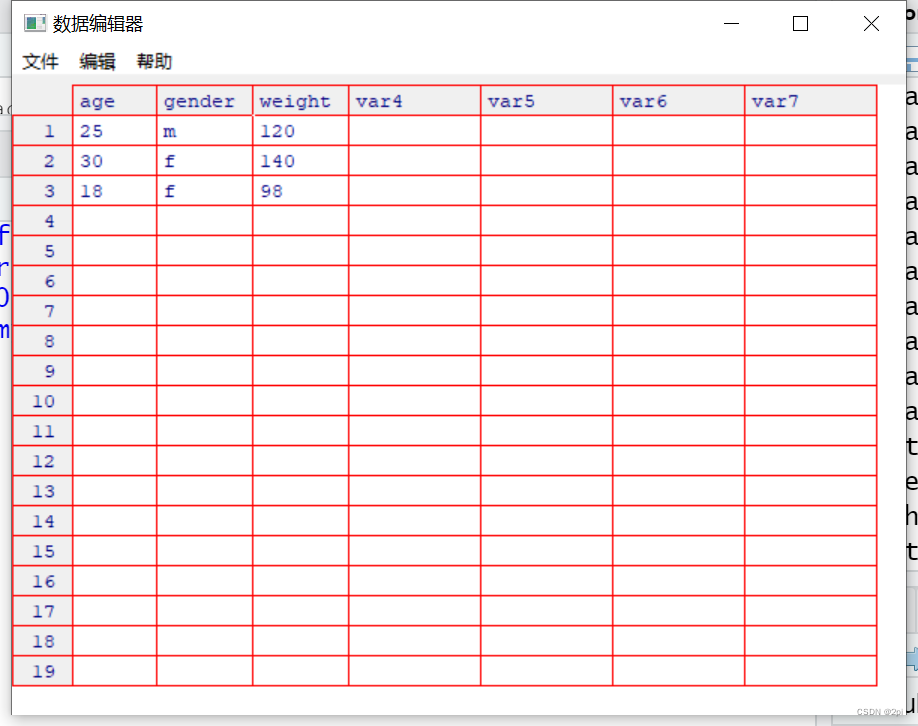
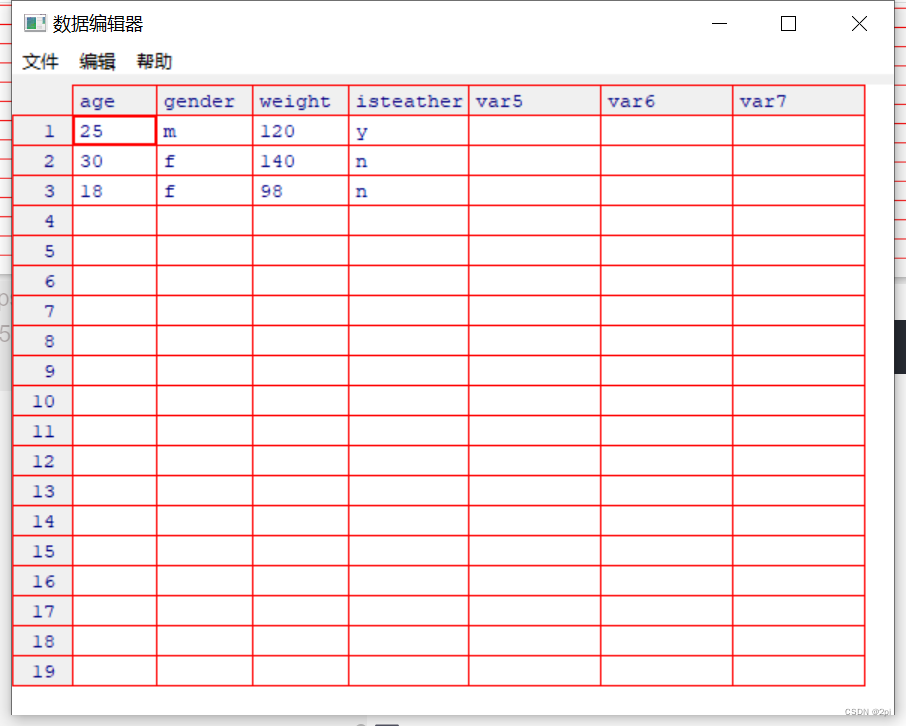
键盘输入
mydata <- data.frame(age=numeric(0),

gender=character(0),

weight=numeric(0))
mydata <- edit(mydata)
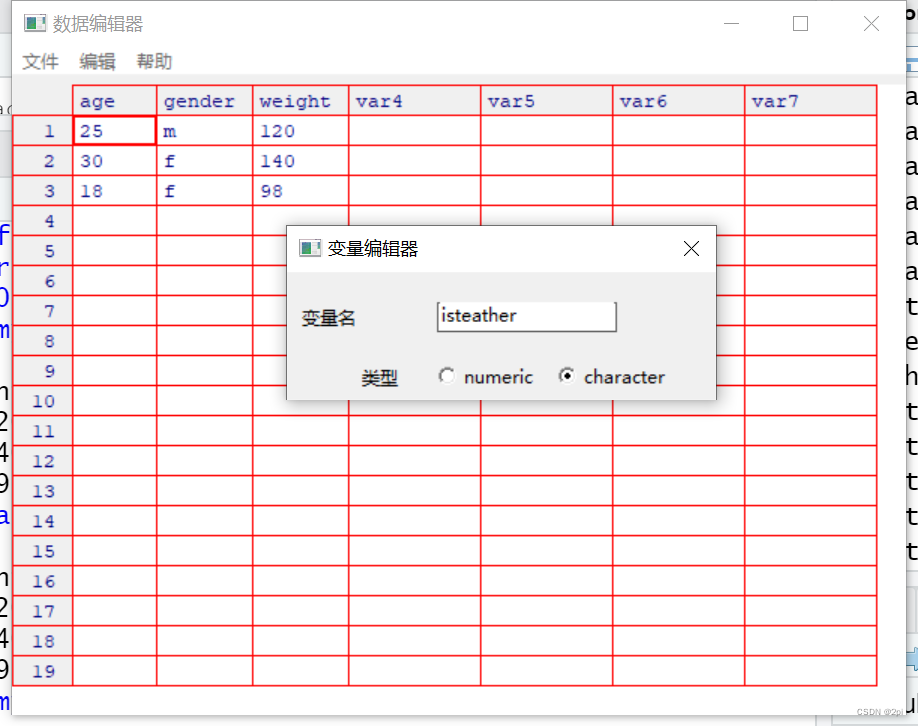
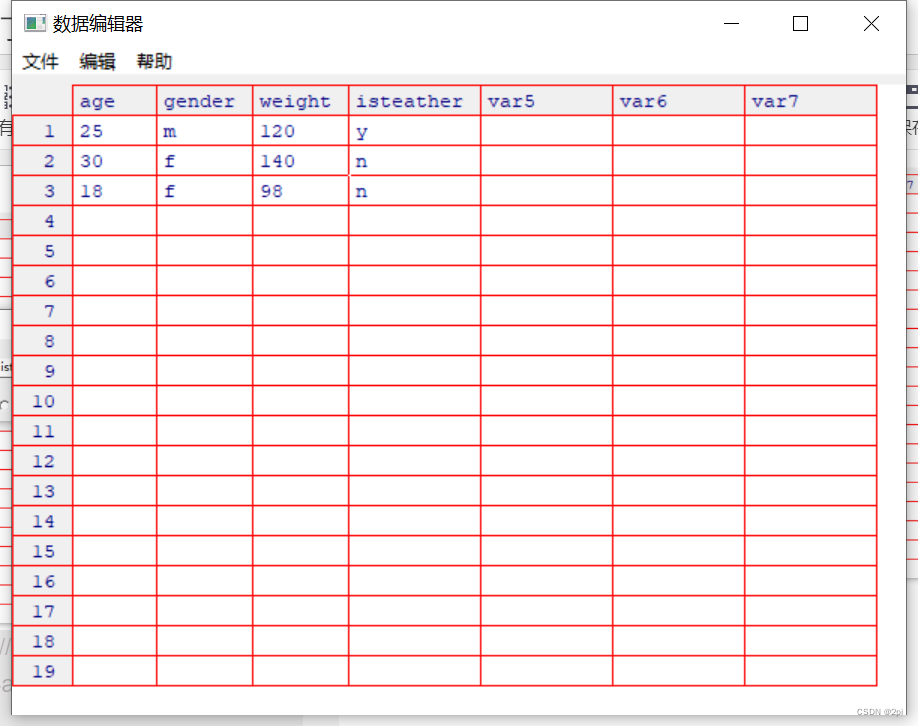
edit()的一种等价写法fix()
fix(mydata)
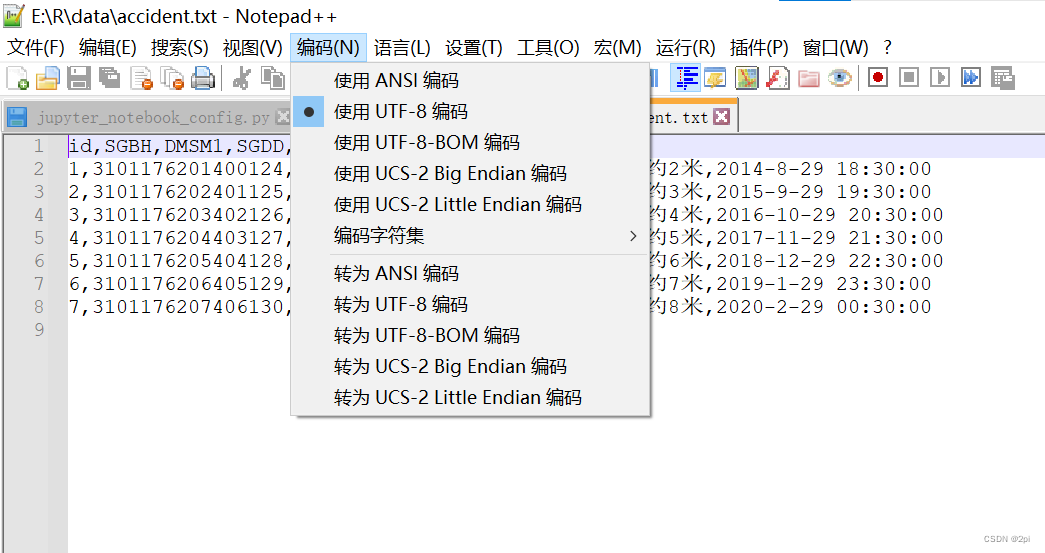
读入txt文件
accident.txt
id,SGBH,DMSM1,SGDD,SGFSSJ
1,3101176201400124,伤亡事故,泗陈公里出余北公路东约2米,2014-8-29 18:30:00
2,3101176202401125,伤亡事故,泗陈公里出余北公路东约3米,2015-9-29 19:30:00
3,3101176203402126,伤亡事故,泗陈公里出余北公路东约4米,2016-10-29 20:30:00
4,3101176204403127,伤亡事故,泗陈公里出余北公路东约5米,2017-11-29 21:30:00
5,3101176205404128,伤亡事故,泗陈公里出余北公路东约6米,2018-12-29 22:30:00
6,3101176206405129,伤亡事故,泗陈公里出余北公路东约7米,2019-1-29 23:30:00
7,3101176207406130,伤亡事故,泗陈公里出余北公路东约8米,2020-2-29 00:30:00
data <- read.table("E:/R/data/accident.txt",header = TRUE,sep=",")
Error in scan(file = file, what = what, sep = sep, quote = quote, dec = dec,  :
line 1 did not have 5 elements
报错原因:R中默认ANSI编码,该文件编码方式utf-8
解决办法:用Notepad++转化为ANSI编码,然后关闭Notepad++保存文件
> data <- read.table("E:/R/data/accident.txt",header = TRUE,sep=",")
 head(data)
  id         SGBH    DMSM1                      SGDD              SGFSSJ
1  1 3.101176e+15 伤亡事故 泗陈公里出余北公路东约2米  2014-8-29 18:30:00
2  2 3.101176e+15 伤亡事故 泗陈公里出余北公路东约3米  2015-9-29 19:30:00
3  3 3.101176e+15 伤亡事故 泗陈公里出余北公路东约4米 2016-10-29 20:30:00
4  4 3.101176e+15 伤亡事故 泗陈公里出余北公路东约5米 2017-11-29 21:30:00
5  5 3.101176e+15 伤亡事故 泗陈公里出余北公路东约6米 2018-12-29 22:30:00
6  6 3.101176e+15 伤亡事故 泗陈公里出余北公路东约7米  2019-1-29 23:30:00
读入excel文件
> data <- read.table("E:/R/data/bus.xlsx",header = TRUE,sep=",")
Warning messages:
1: In read.table("E:/R/data/bus.xlsx", header = TRUE, sep = ",") :
  line 1 appears to contain embedded nulls
2: In read.table("E:/R/data/bus.xlsx", header = TRUE, sep = ",") :
  incomplete final line found by readTableHeader on 'E:/R/data/bus.xlsx'
解决办法,将xlsx文件另存问csv文件,将read.table改为read.csv
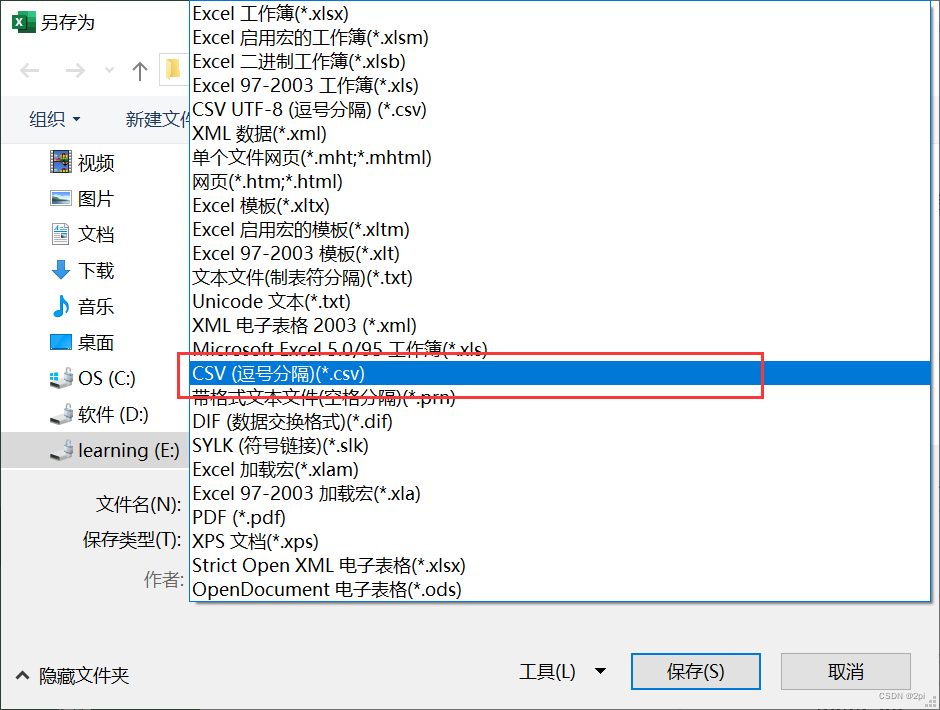
> data <- read.csv("E:/R/data/bus.csv",header = TRUE,sep=",")
> data
  公交车编号 线路编码 站点编码 协议编码 进出站状态 方向     时间
1   059L0809    10065 938A0000       42       进站 下行 2015/4/1
2   059L0809    10065 938A0000       42       出站 下行 2015/4/1
3   059L0809    10065 938A0006       42       进站 下行 2015/4/1
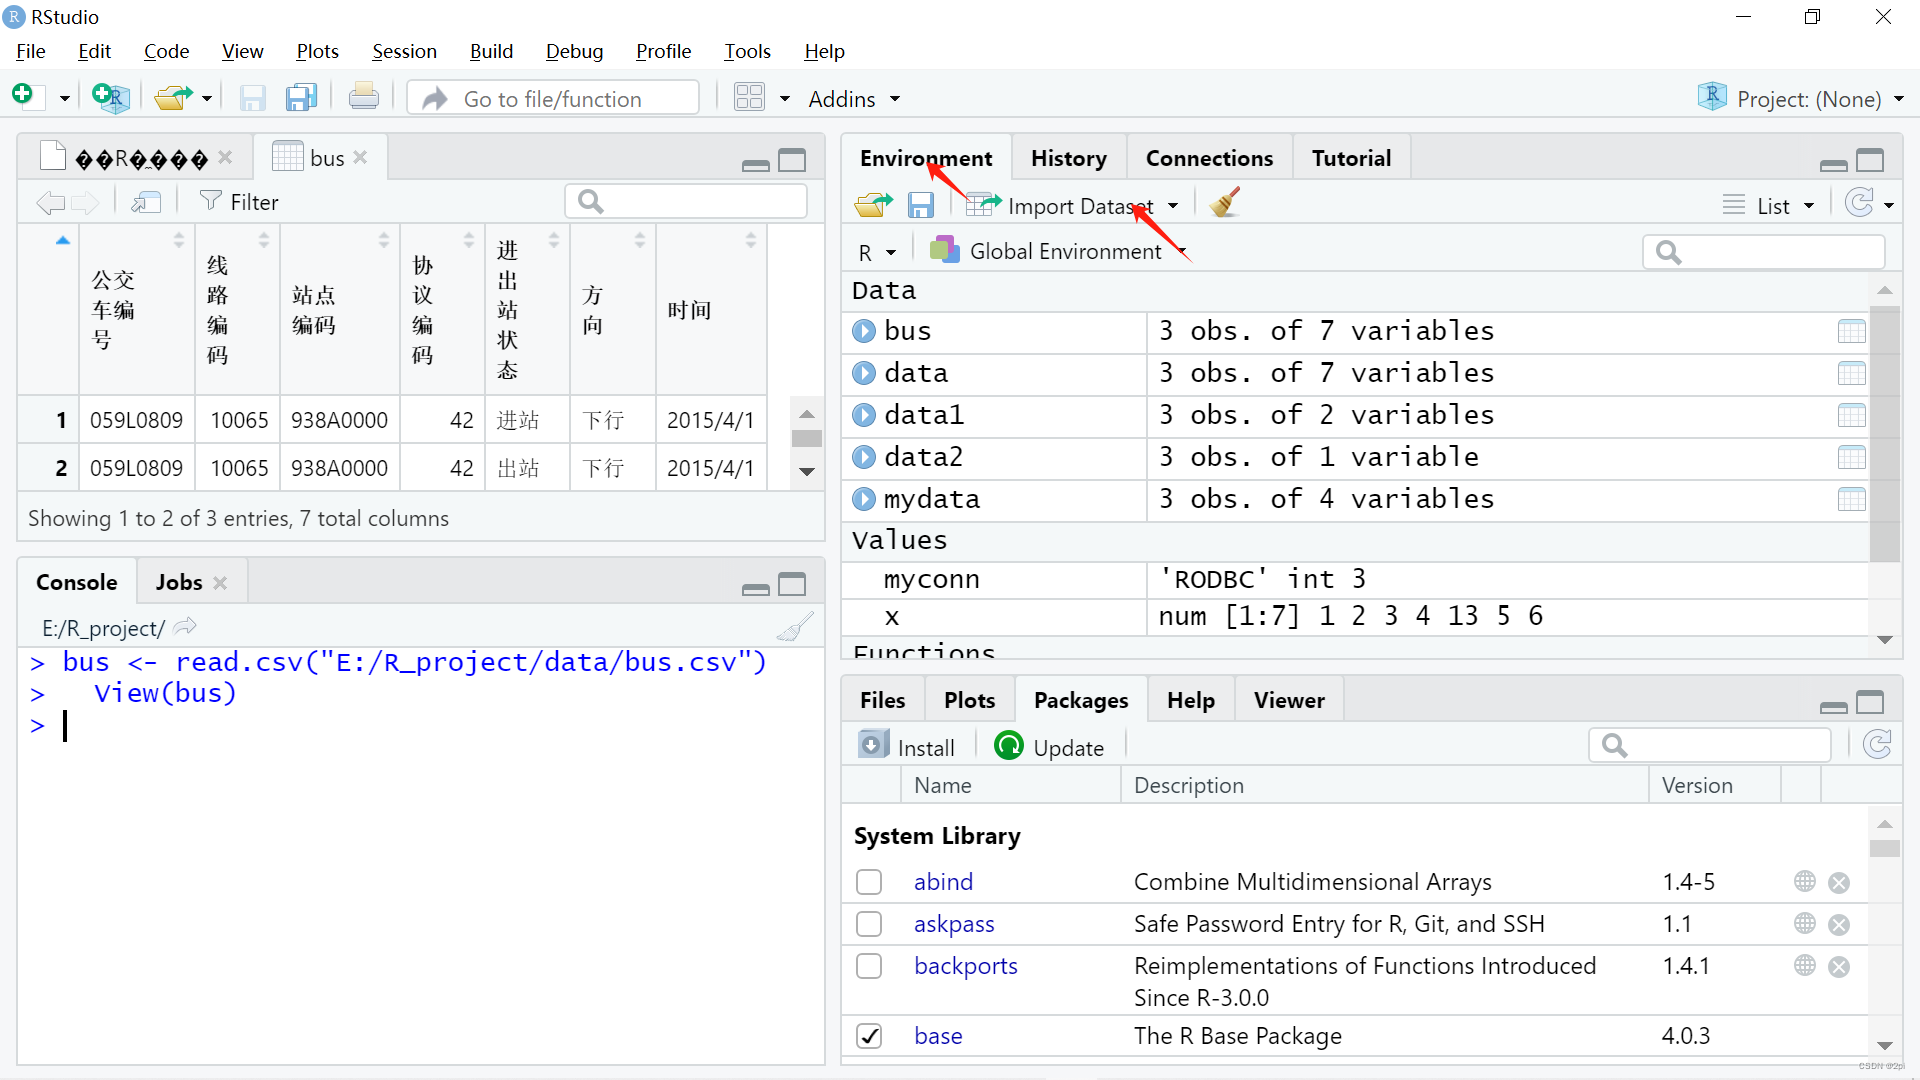
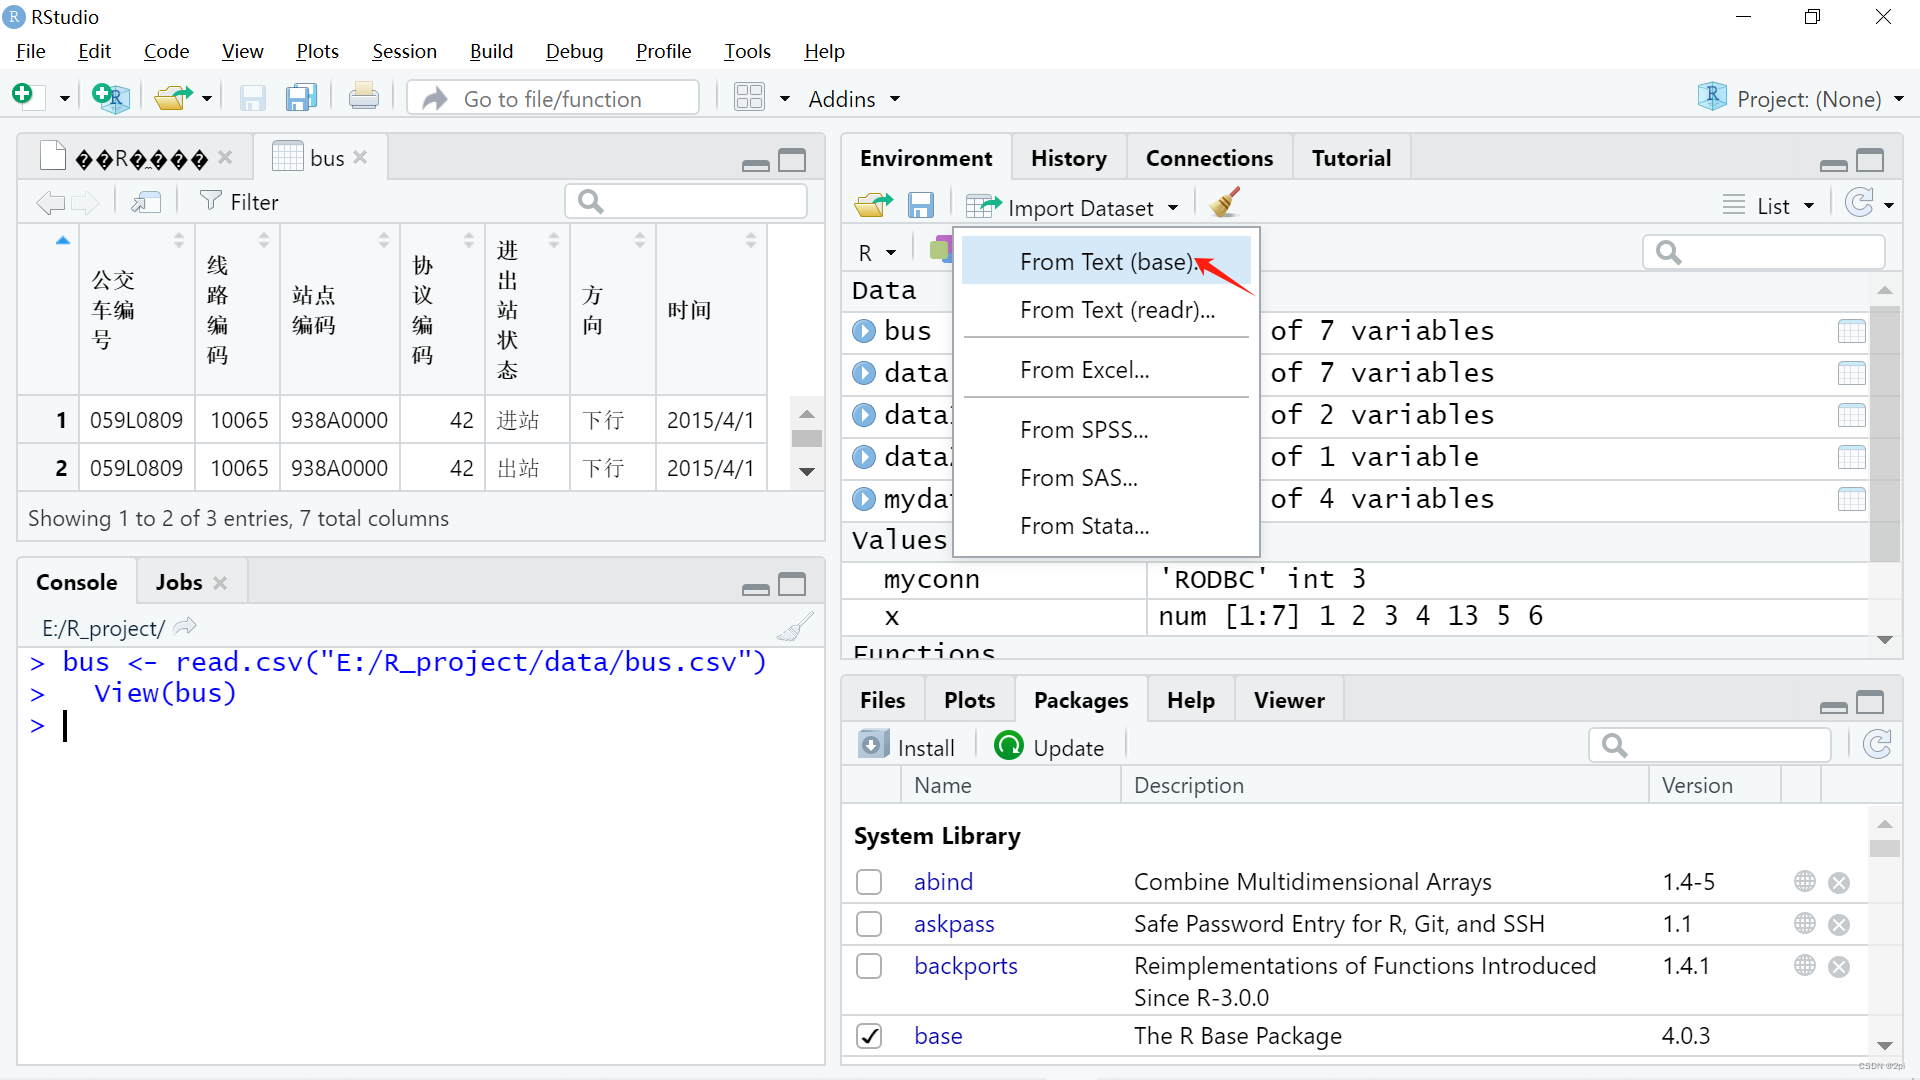
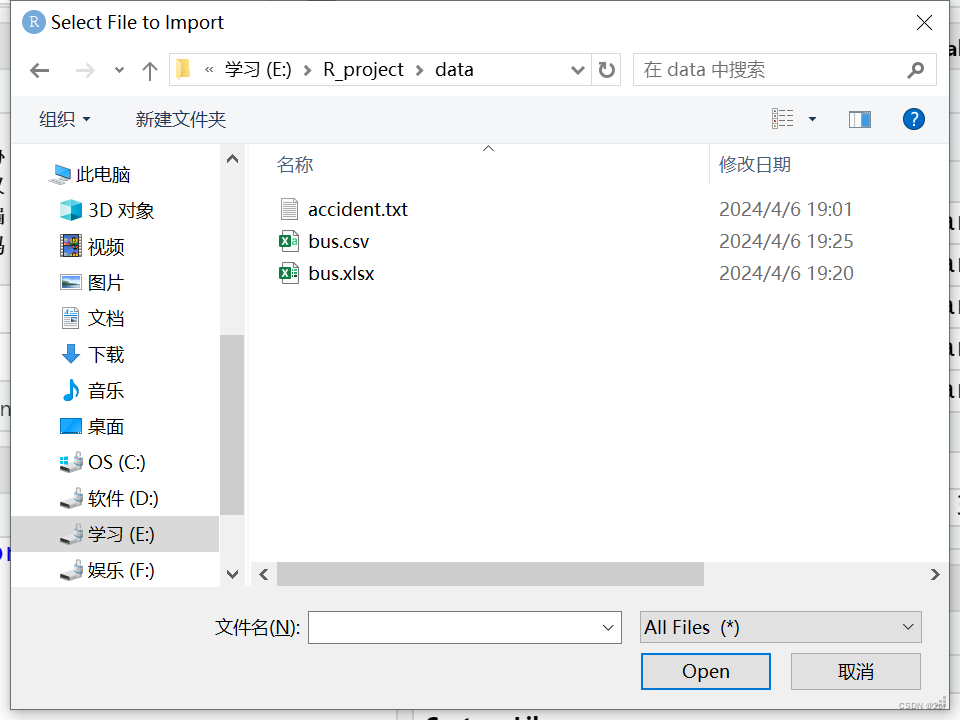
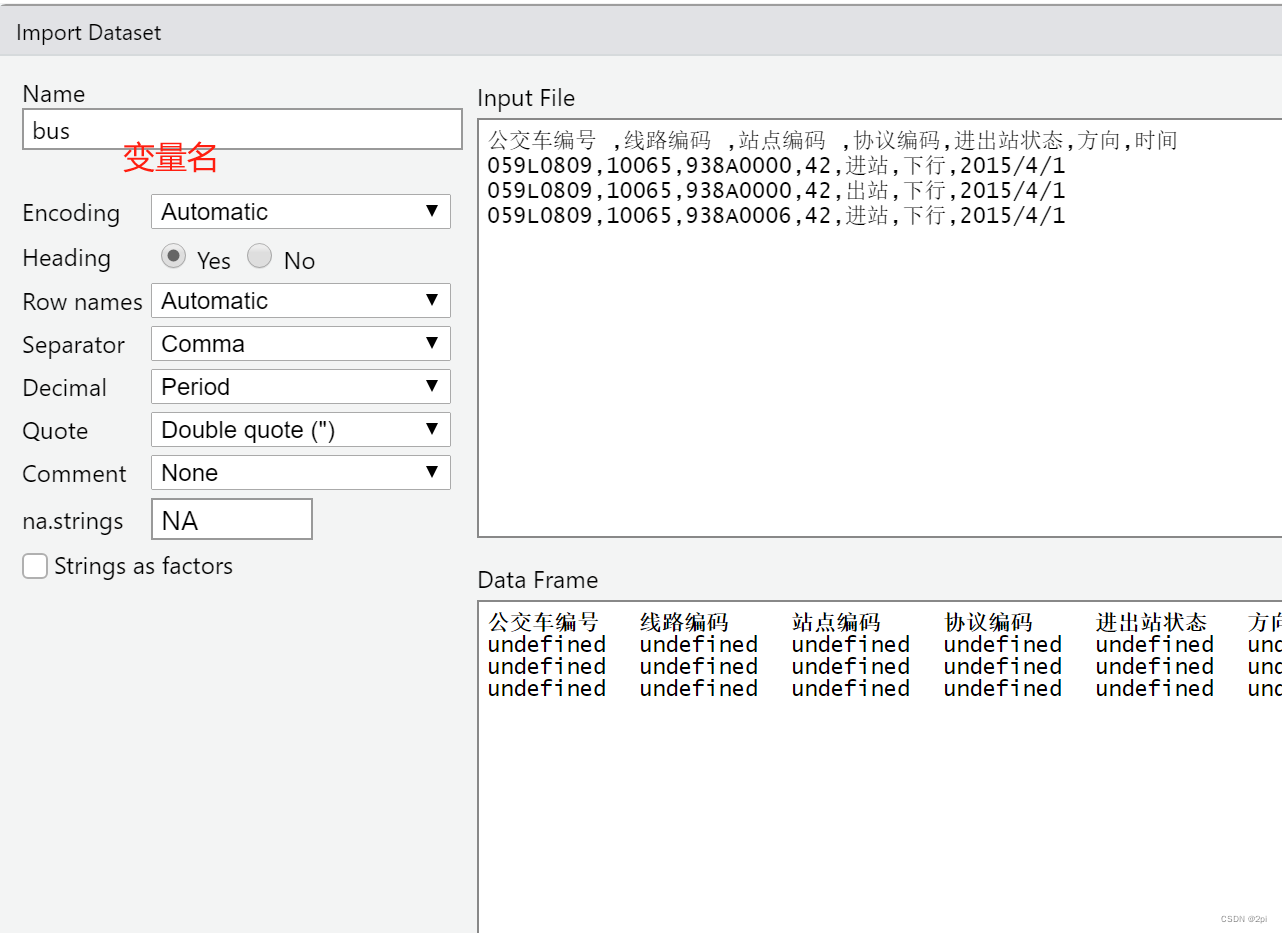
Rstudio导入数据
R定义函数
> mydate <- function(type) {
+ switch(type,
+ long = format(Sys.time(),"%A %B %d %Y"),
+ short = format(Sys.time(),"%m-%d-%y"),
+ cat(type,"is not recognized type\n")
+ )
+ }
> mydate("long")
[1] "星期六 四月 06 2024"
> mydate("short")
[1] "04-06-24"
> mydate("medium")
medium is not recognized type
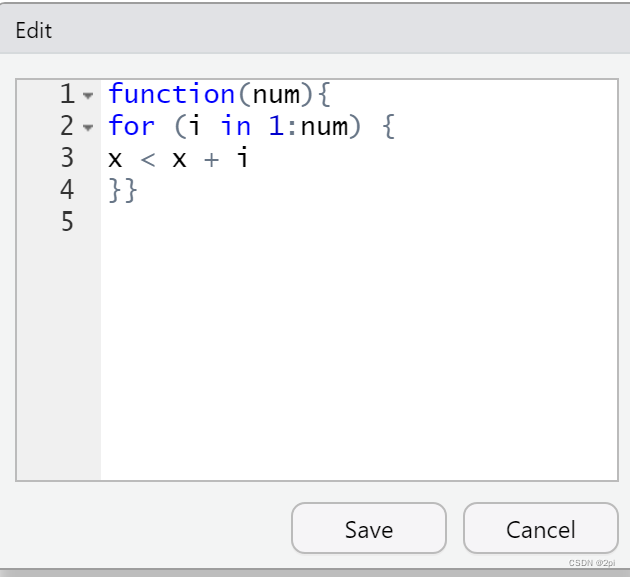
> sum <- function(num){
+ for (i in 1:num) {
+ x < x + i
+ }}
这个函数没有给x初值,如下是如何修改函数
fix(sum)
function(num){
x <- 0
for (i in 1:num) {
x <- x + i
}
return(x)
}
> sum(3)
[1] 6
R访问MySQL
-
安装RODC包
install.packages("RODBC") -
https://dev.mysql.com/downloads/connector/odbc/下载connectors ODBC
-
win10系统操作如下:控制面板->系统和安全->管理工具->数据源(ODBC)->双击->添加->选中mysql ODBC driver
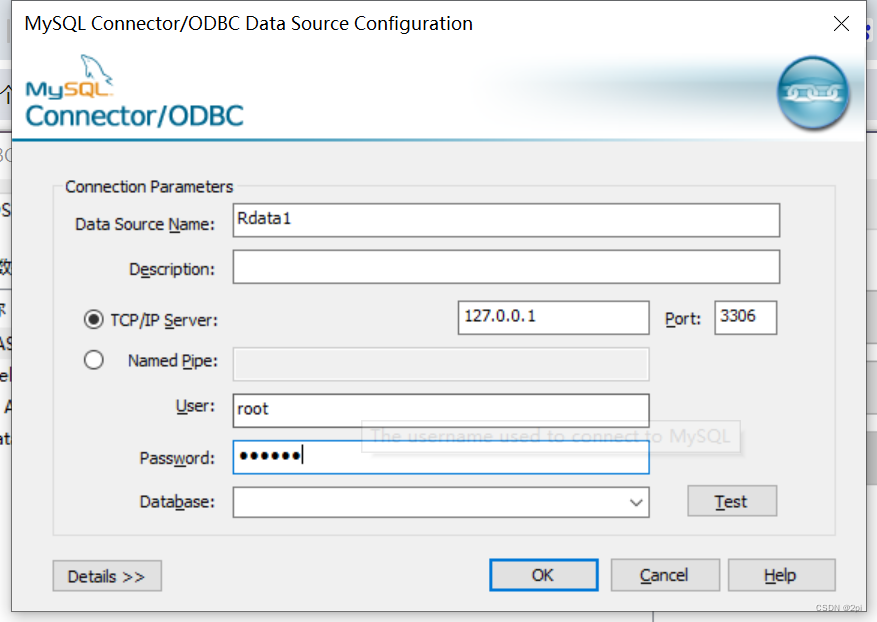
> library(RODBC)
> myconn <- odbcConnect("Rdata",uid="root",pwd="123456")
> data1 <- sqlFetch(myconn,"userinfo")
> head(data1)
         id password
1 211119124   123456
2 211119125   123456
3 211119126    77818
> data2 <- sqlQuery(myconn,"select id from userinfo")
> head(data2)
         id
1 211119124
2 211119125
3 211119126
> close(myconn)
Rstudio
基于C++开发
下载链接http://www.rstudio.com/
Rstudio导入数据
Rstuio中安装包
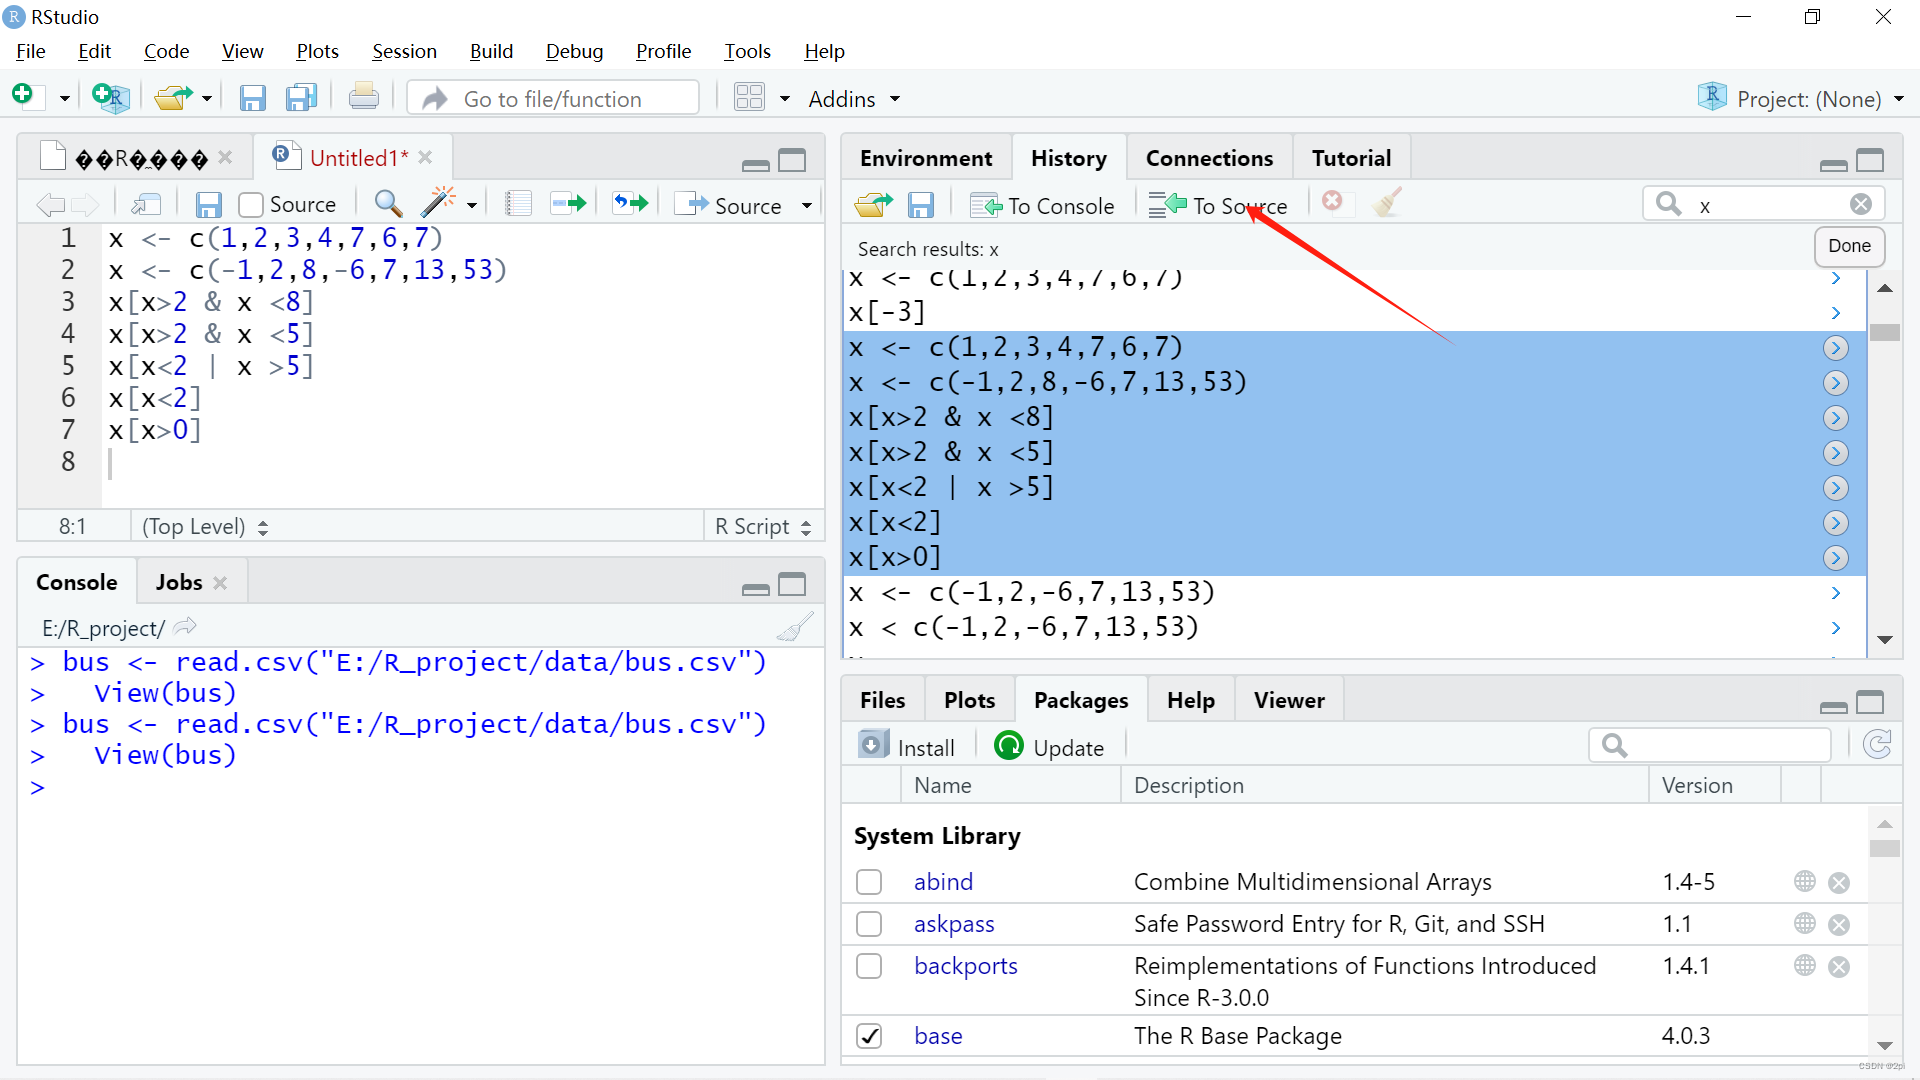
Rstudio将历史命令导入脚本文件
选中历史命令->点击To Source
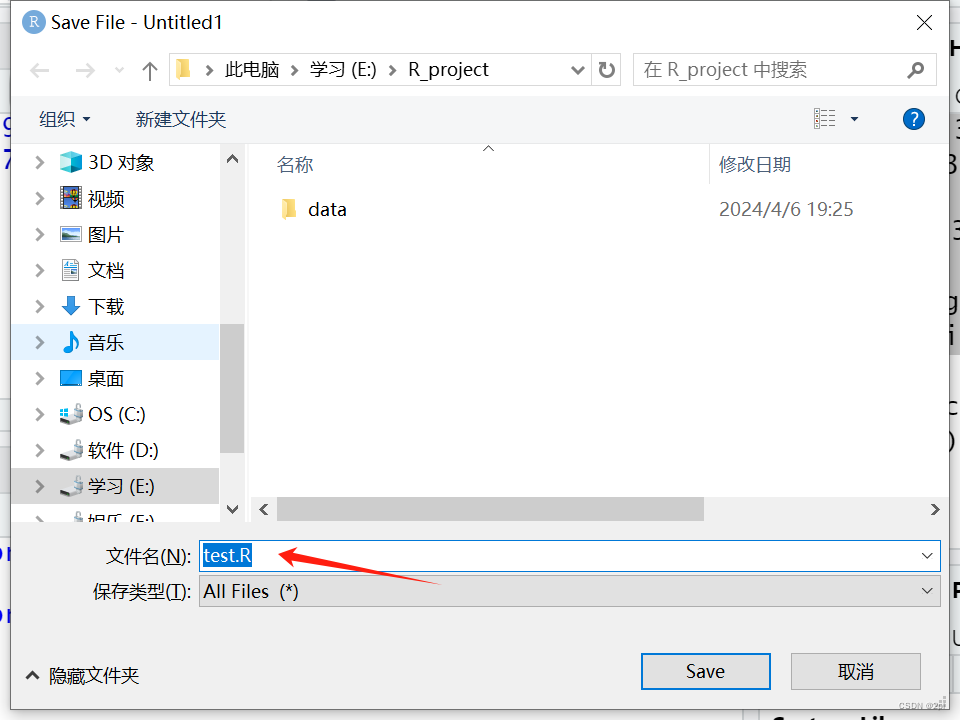
Rstudio保存文件
ctrl+s保存,后缀为.R
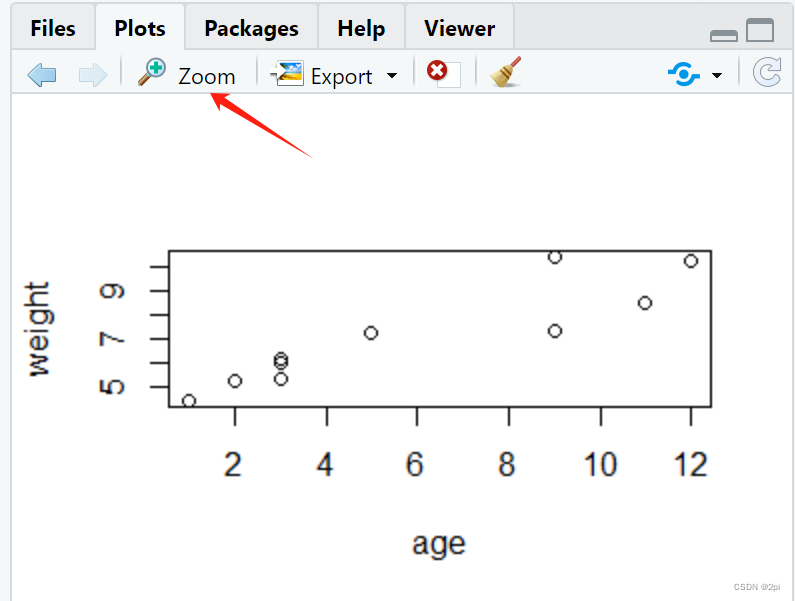
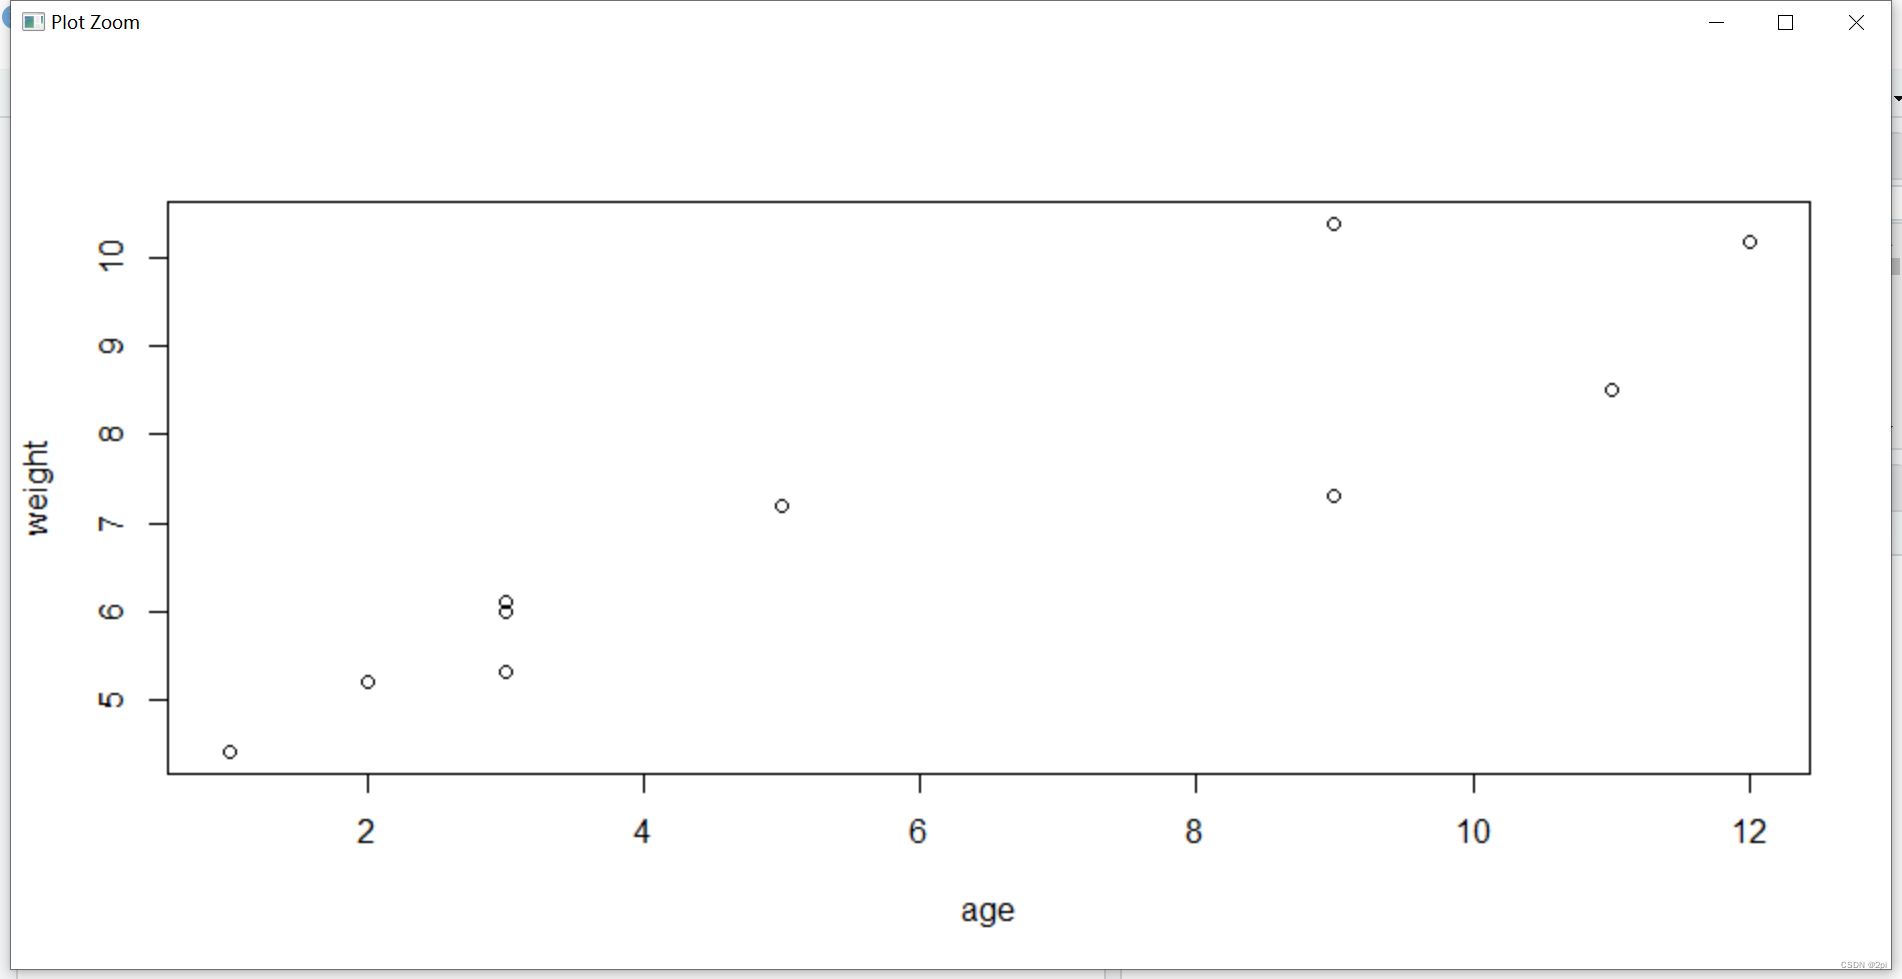
Rstudio画图单独窗口展示
R画图
> dose <- c(20,30,40,45,60)
> drugA <- c(16,20,27,40,60)
> drugB <- c(15,18,25,31,40)
> plot(dose,drugA,type="b")
b是点线图

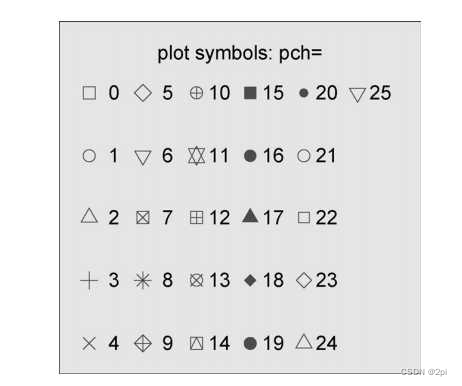
- pch 指定绘制点时使用的符号
- cex 指定符号的大小。cex是一个数值,表示绘图符号相对于默认大小缩放的倍数。
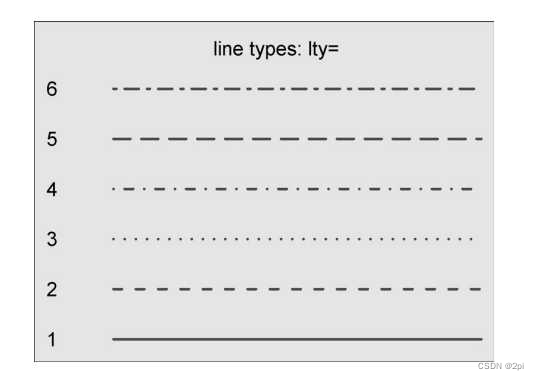
- lty 指定线条类型
- lwd 指定线条宽度,默认值是1.
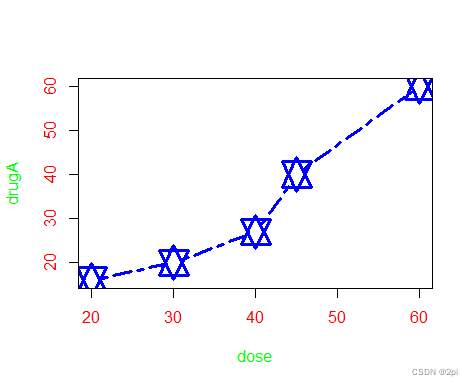
- 颜色参数
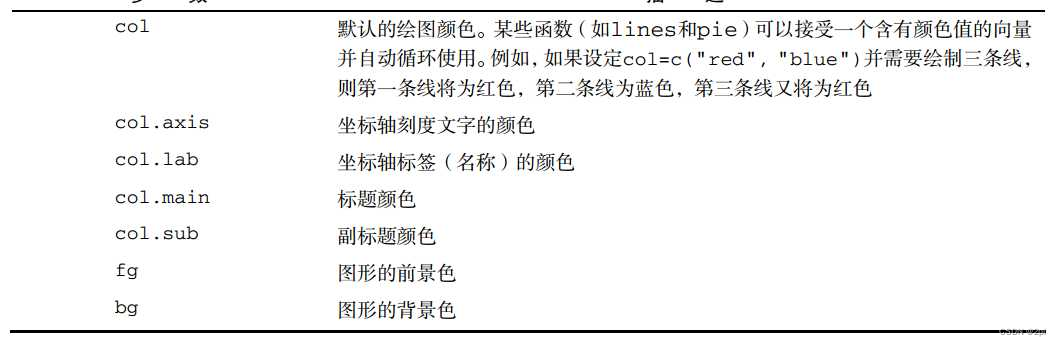
- 查看所有颜色
> colors()
  [1] "white"                "aliceblue"
  [3] "antiquewhite"         "antiquewhite1"
  [5] "antiquewhite2"        "antiquewhite3"
  [7] "antiquewhite4"        "aquamarine"
  [9] "aquamarine1"          "aquamarine2"
 [11] "aquamarine3"          "aquamarine4"
 [13] "azure"                "azure1"
 [15] "azure2"               "azure3"
 [17] "azure4"               "beige"
 [19] "bisque"               "bisque1"
 [21] "bisque2"              "bisque3"
 [23] "bisque4"              "black"
更改线条和点类型
> opar <- par(no.readonly = TRUE)
> par(lty=2,pch=17)
> plot(dose,drugA,type="b")
lty=2虚线pch=17三角符号
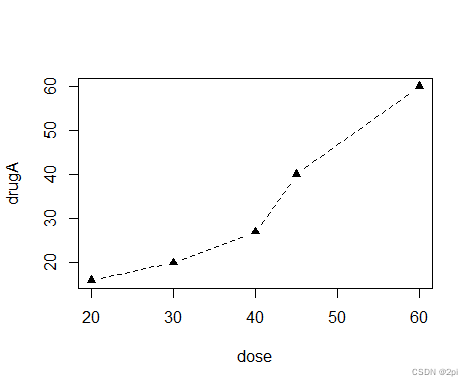
- 恢复回来
> par(opar)
> plot(dose,drugA,type="b")
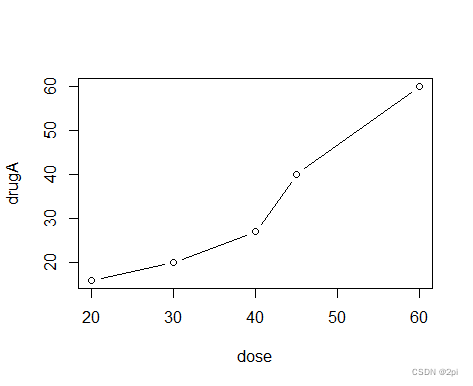
> plot(dose,drugA,type="b",lty=6,lwd=3,pch=11,cex=3,col="blue",col.axis="red",col.lab="green")


 7835
7835

 被折叠的 条评论
为什么被折叠?
被折叠的 条评论
为什么被折叠?
 到【灌水乐园】发言


