


 xArr=['Mon', 'Tue', {
        value:'Wed',
        textStyle:{
          color:'#FFFF00',
        }
      }, 'Thu', 'Fri', 'Sat', 'Sun'];
      yArr=[150, 230,   {
        value: 100,
        symbolSize: 15,
        symbol: "circle",
        itemStyle: {
          normal: {
            color: "#FFFF00",
          },
        },
      }, 218, 135, 147, 260]
    var myChart = echarts.init(document.getElementById('ehcartsModalChart'));
    var option = {
        tooltip: {
            trigger: 'axis',
            formatter: '{b}'+'年销售额:'+' {c}'+unit,
          },
        xAxis: {
          type: 'category',
          data:xArr,
          axisLabel:{
            textStyle:{
                color:'#fff',
              },
              lineStyle: {
                width:2,
                color:'#fff',
            }
          },
          axisLine: {
            lineStyle: {
                color: '#FFFFFF'
            }
        },
        axisTick:{
            show:false //隐藏x轴刻度
          }

        },
        yAxis: {
          type: 'value',
          axisLabel:{
            textStyle:{
                color:'#fff',

              }
          },
          splitLine: {
            lineStyle: {
                width:'5',
                color:['','#475372'],
            }
          },
          name:'单位:'+unit,
          nameTextStyle:{
            color:'#fff',
          },
        },
        series: [
          {
            data: yArr,
            type: 'line',
            symbolSize: 8,
          }
        ]
      };

    myChart.setOption(option);
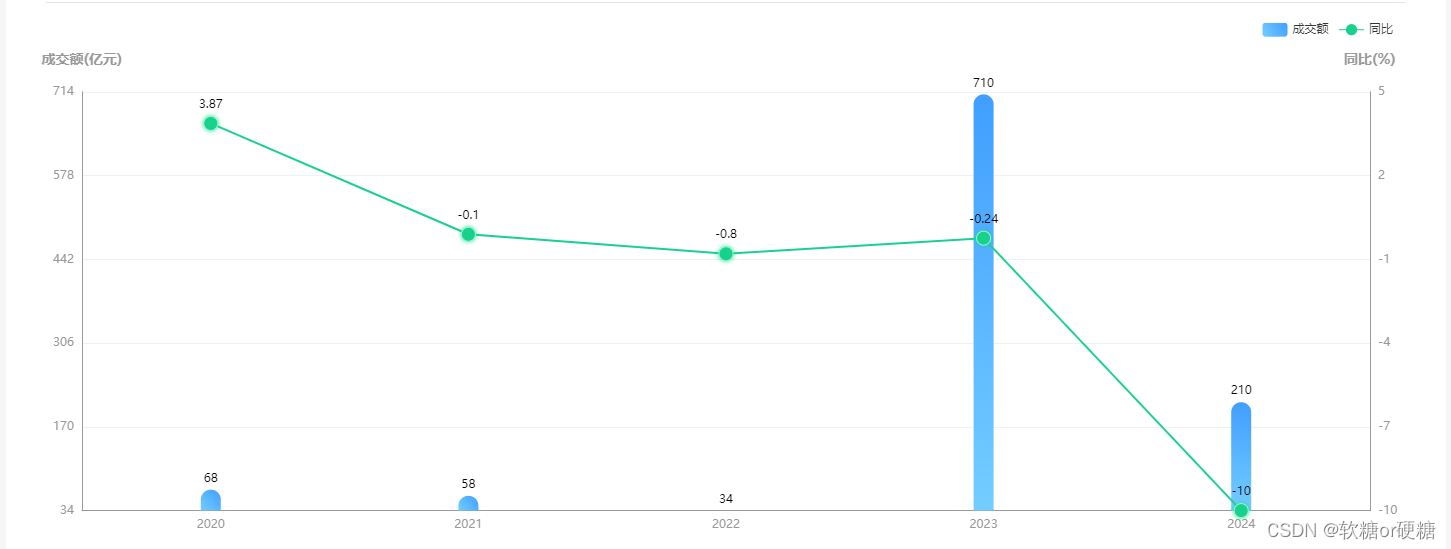
解决双y轴对不齐问题
在yAxis加上以下代码
          interval: Math.abs(Math.ceil((Math.ceil(Math.max(...yArr)) - Math.floor(Math.min(...yArr))) /5)),
          max:Math.floor(Math.min(...yArr)) +Math.abs(Math.ceil((Math.ceil(Math.max(...yArr)) -Math.floor(Math.min(...yArr))) /5)) *5,
          min: Math.floor(Math.min(...yArr)),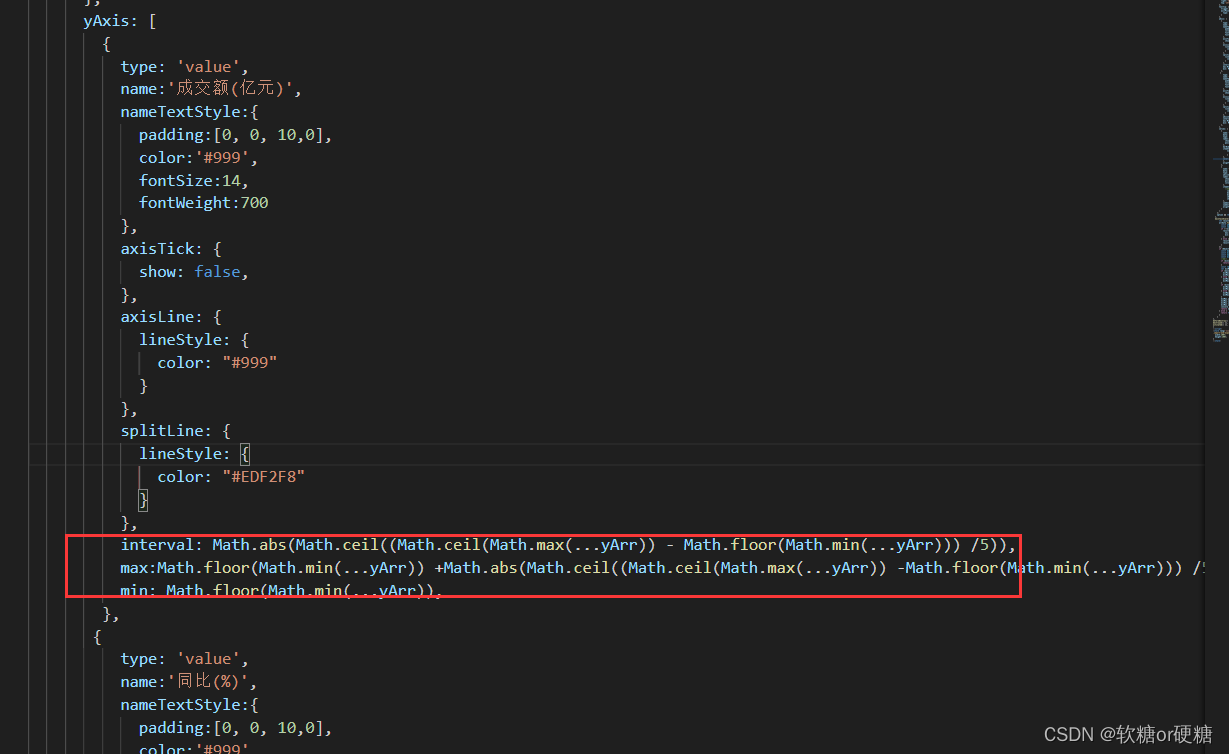
刻度线底部对齐
在xAxis-axisLine 里加 onZero:false


 2912
2912


 被折叠的 条评论
为什么被折叠?
被折叠的 条评论
为什么被折叠?
 到【灌水乐园】发言


