


1.简介
D3.js(Data-Driven Documents)是一个强大且灵活的JavaScript库,用于创建动态、交互式的数据可视化。D3利用HTML、SVG和CSS来显示数据,通过操作文档对象模型(DOM)元素来将数据绑定到网页元素上。以下是对D3.js的一些介绍和关键特性的概述:
2.代码
<!DOCTYPE html>
<html lang="en">
<head>
    <meta charset="UTF-8">
    <meta name="viewport" content="width=device-width, initial-scale=1.0">
    <title>力导图</title>
    <script src="https://d3js.org/d3.v6.min.js"></script>
</head>
<body>
    <svg width="1800" height="920" id="mainsvg" class="svgs"
    style="display: block; margin: 0 auto; "></svg>

    <script>
         let svg = d3.select("svg");
         var width = +svg.attr('width');
         var height = +svg.attr('height');
         let nodes,links;
         let circles,lines;
         let simulation;

         const zoom = d3.zoom()
            .scaleExtent([0.1, 10]) // Define the zoom scale limits
            .on('zoom', zoomed);
         svg.call(zoom); // Apply zoom behavior to the SVG

         // Create a group that will contain all nodes and links
         const g = svg.append('g');

         function zoomed(event) {
             g.attr('transform', event.transform);
    }

         const render_init = function(){
            lines = g.selectAll('line').data(links).join('line')
               .attr('stroke','black')
               .attr('stroke-width',.5)
               .attr('opacity',0.8); //设置透明度 0-1

            // Add text to each line
            texts = g.selectAll('text').data(links).join('text')
            .text('指向')
            .attr('font-size', 10)
            .attr('fill', 'black')
            .attr('opacity',0);

            circles = g.selectAll('circle').data(nodes).join('circle')
               .attr('r',5)
               .attr('title','节点')
               .attr('fill',d => color(d.index))
               .on('mouseover', mouseover)
               .on('mouseout', mouseout)
               .call(d3.drag()
                  .on('start', dragstarted)
                  .on('drag', dragged)
                  .on('end', dragended));
         }
         function ticked(){
            lines.attr('x1', d => d.source.x)
                 .attr('y1' ,d => d.source.y)
                 .attr('x2', d => d.target.x)
                 .attr('y2', d => d.target.y)
            // Update text position to the middle of each line
            texts.attr('x', d => (d.source.x + d.target.x) / 2)
                  .attr('y', d => (d.source.y + d.target.y) / 2);

            circles.attr('cx', d => d.x)
                   .attr('cy', d => d.y)
         }
         function tdistance(link){
            //console.log(link);
            return Math.random()* 100 +50
         }

         // Define the drag functions
         function dragstarted(event, d) {
            if (!event.active) simulation.alphaTarget(0.3).restart();
            d.fx = d.x;
            d.fy = d.y;
         }

         function dragged(event, d) {
            d.fx = event.x;
            d.fy = event.y;
         }

         function dragended(event, d) {
            if (!event.active) simulation.alphaTarget(0);
            d.fx = null;
            d.fy = null;
         }

          // Define the mouseover function to show node info and filter neighbors
         function mouseover(event, d) {
            // Show node information (you can customize this)
            console.log(`Node index: ${d.index}`);

            // Highlight the selected node and its neighbors
            const neighbors = links.filter(link => link.source.index === d.index || link.target.index === d.index);
            const neighborNodes = neighbors.map(link => link.source.index === d.index ? link.target : link.source);

            // Hide all lines and circles
            lines.style('opacity', 0);
            circles.style('opacity', 0);
            texts.style('opacity', 0);

            // Highlight the selected node and its neighbors
            circles.filter(node => node.index === d.index || neighborNodes.includes(node))
                  .style('opacity', 1);

            lines.filter(link => link.source.index === d.index || link.target.index === d.index)
                  .style('opacity', 1); //opacity 0-1

            texts.filter(link => link.source.index === d.index || link.target.index === d.index)
            .style('opacity', 1);
         }

         // Define the mouseout function to reset the view
         function mouseout(event, d) {
            // Reset the opacity of all lines and circles
            lines.style('opacity', 0.8);
            circles.style('opacity', 1);
            texts.style('opacity', 0);
         }


         d3.json('socfb-Caltech36.json').then((data => {
            links = data.links;
            nodes = [];
            console.log(links);

            for(let i = 0; i <= data['#nodes']; i++){
               nodes.push({"index":i});
            }

            color  = d3.scaleSequential(d3.interpolateRainbow)
              .domain([0, nodes.length-1])

            render_init();

            simulation = d3.forceSimulation(nodes)
                .force('manyBody',d3.forceManyBody().strength(-30))
                .force('center', d3.forceCenter(width/2,height/2))
                .force("link",d3.forceLink(links).strength(0.1).distance(tdistance))
                .on('tick',ticked)

         }))

    </script>
</body>
</html>
3.代码解释
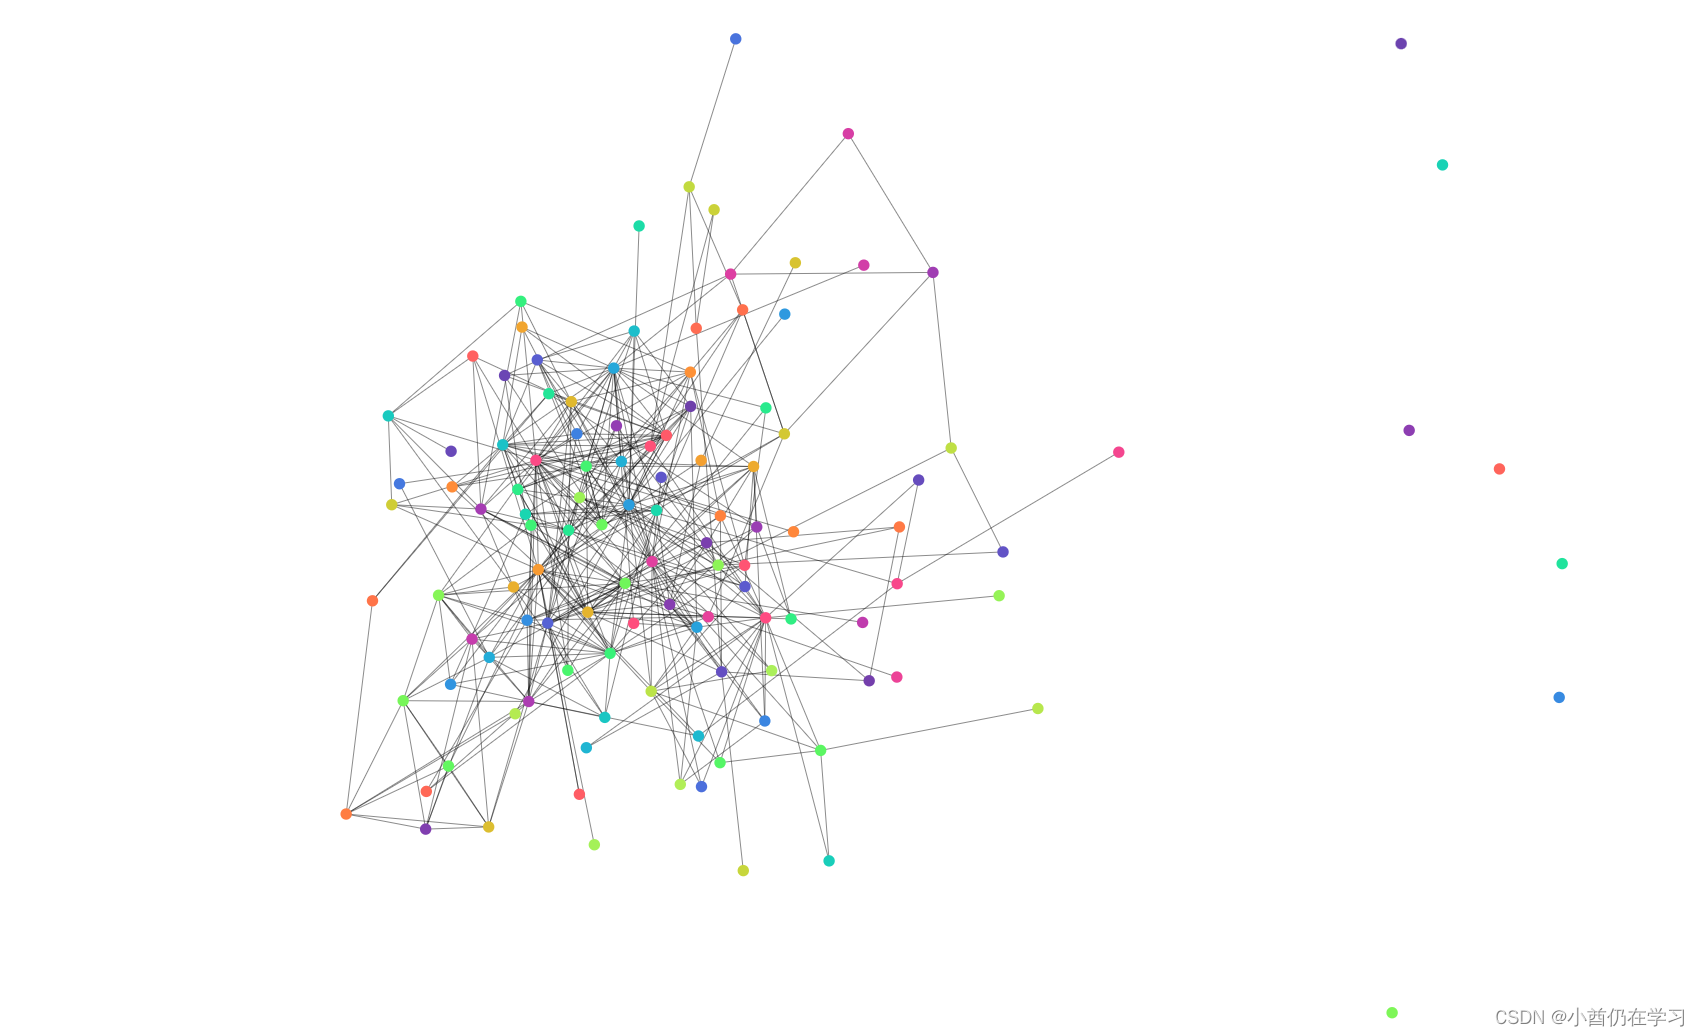
这段代码使用D3.js创建了一个交互式力导图,包含节点拖拽、缩放和鼠标悬停高亮功能。通过加载外部JSON数据,代码可以动态生成和显示图表,展示节点之间的关系。
它从一个名为'socfb-Caltech36.json'的JSON文件中读取数据,然后使用这些数据来生成图形。
以下是代码的主要部分:
1. 首先,它选择SVG元素,并获取其宽度和高度。然后,它定义了一些变量,如nodes、links、circles、lines和simulation。
2. 它定义了一个缩放行为,该行为允许用户通过鼠标滚轮缩放SVG。
3. 它创建了一个组元素,该元素将包含所有的节点和链接。
4. 它定义了一些函数,如render_init、ticked、tdistance、dragstarted、dragged、dragended、mouseover和mouseout。这些函数用于初始化渲染、更新元素的位置、处理拖动事件和鼠标悬停事件等。
5. 它从JSON文件中读取数据,然后使用这些数据来创建节点和链接。然后,它初始化渲染并创建一个力模拟。
6. 最后,它定义了一些力,如多体力、中心力和链接力,并将它们应用到模拟中。然后,它在每个模拟的"tick"事件上调用ticked函数,以更新元素的位置。
注意:这段代码依赖于D3.js库,需要在HTML文件的头部引入。
4.图像
整体图:
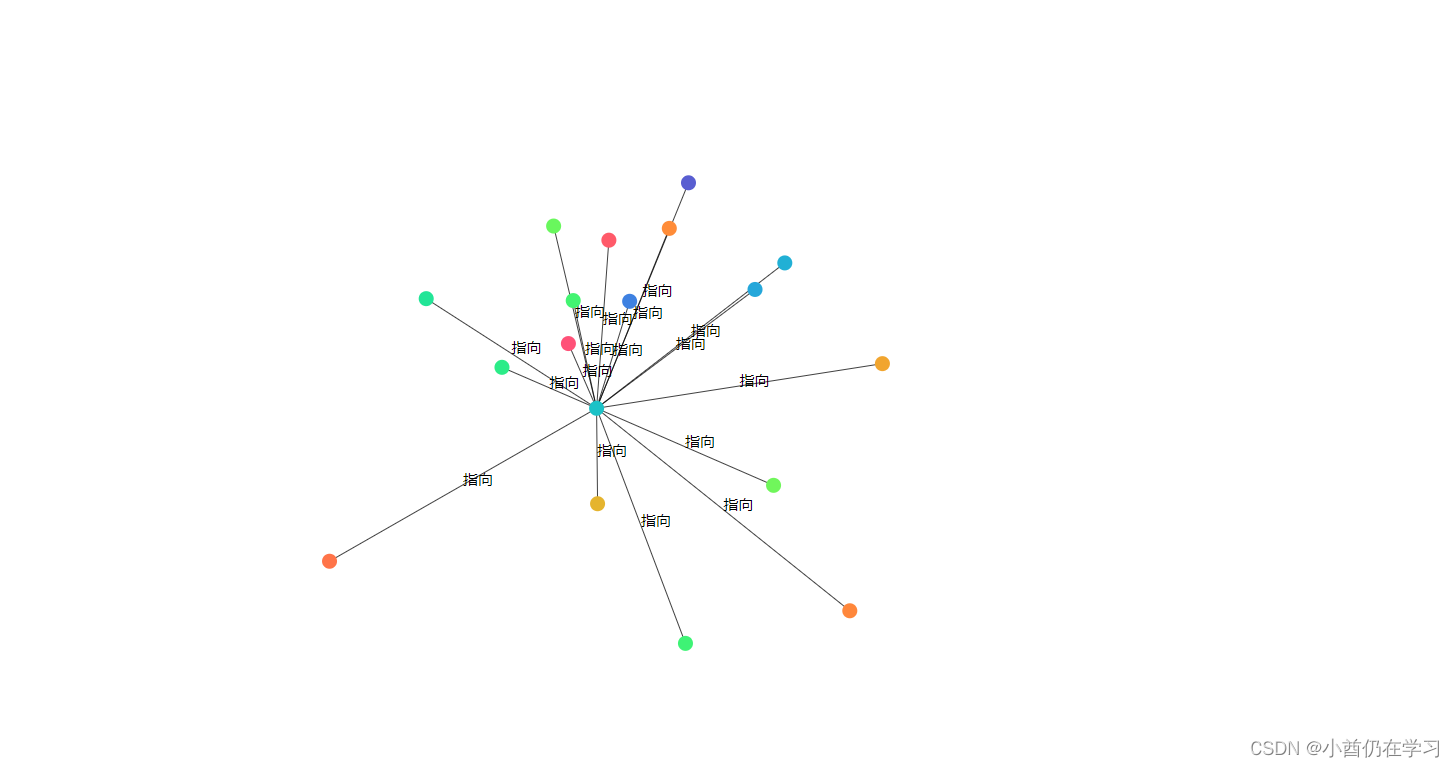
鼠标移入某点,只会显示该节点和邻居节点信息:
5.参考视频
我主要是跟着B站的小魁少爷学的,在源代码基础上增加了一些功能,如缩放、鼠标移入移出等。
https://www.bilibili.com/video/BV1qg411X7bB/?p=3&vd_source=a3bf5c71ab4b3cb2aad2f9e2f09b202c


 1462
1462

 被折叠的 条评论
为什么被折叠?
被折叠的 条评论
为什么被折叠?
 到【灌水乐园】发言


