


2.1 基本概念
- 数据集的行 和 列又称
观测 和 变量
记录 和 字段
示例 和 属性
- 数据结构
标量、向量、矩阵、数组、数据框和列表
- 因子
名义型变量或有序型变量
2.2 向量
- 向量创建
a <- c(1, 2, 5, 3, 6, -2, 4)
b <- c("one", "two", "three")
c <- c(TRUE, TRUE, TRUE, FALSE, TRUE, FALSE)- 向量下标
a <- c("k", "j", "h", "a", "c", "m")
a[3]
[1] "h"

a[c(1, 3, 5)]
[1] "k" "h" "c"

a[2:6]       #使用的冒号用于生成一个数值序列
[1] "j" "h" "a" "c" "m"
注意事项
标量是只含一个元素的向量,R中没有标量,例如f <- 3、g <- "US"和h <- TRUE,它们用于保存常量
2.3 矩阵
- 矩阵创建
myymatrix <- matrix(vector, nrow=number_of_rows, ncol=number_of_columns,
                    byrow=logical_value, dimnames=list(
                    char_vector_rownames, char_vector_colnames))
#vector包含矩阵元素
#nrow和ncol指定行和列的维数
#byrow表示矩阵按行还是按列填充(默认情况下按列)
#dimnames表示行名列名
代码示例
> y <- matrix(1:20, nrow=5, ncol=4)
> y
 [,1] [,2] [,3] [,4]
[1,] 1 6 11 16
[2,] 2 7 12 17
[3,] 3 8 13 18
[4,] 4 9 14 19
[5,] 5 10 15 20

> cells <- c(1,26,24,68)
> rnames <- c("R1", "R2")
> cnames <- c("C1", "C2")

> mymatrix <- matrix(cells, nrow=2, ncol=2, byrow=TRUE,
 dimnames=list(rnames, cnames))
> mymatrix
 C1 C2
R1 1 26
R2 24 68

> mymatrix <- matrix(cells, nrow=2, ncol=2, byrow=FALSE,
 dimnames=list(rnames, cnames))
> mymatrix
 C1 C2
R1 1 24
R2 26 68- 矩阵下标
> x <- matrix(1:10, nrow=2)
> x
 [,1] [,2] [,3] [,4] [,5]
[1,] 1 3 5 7 9
[2,] 2 4 6 8 10

#选取某一行
> x[2,]
 [1] 2 4 6 8 10

#选取某一列
> x[,2]
[1] 3 4

#选取某一个元素
> x[1,4]
[1] 7

#选取多行或多列
> x[1, c(4,5)]
[1] 7 9
2.4 数组
- 数组创建
myarray <- array(vector, dimensions, dimnames)

#vector表示数组中的数据
#dimensions是数值型向量,给出了各个维度下标的最大值(行,列,块数)
#dimnames可选,表示各维度名称标签的向量
代码示例
> dim1 <- c("A1","A2")
> dim2 <- c("B1", "B2", "B3")
> dim3 <- c("C1", "C2", "C3", "C4")
> z <- array(1:24,c(2,3,4),dimnames=list(dim1,dim2,dim3))
> z
, , C1

   B1 B2 B3
A1  1  3  5
A2  2  4  6

, , C2

   B1 B2 B3
A1  7  9 11
A2  8 10 12

, , C3

   B1 B2 B3
A1 13 15 17
A2 14 16 18

, , C4

   B1 B2 B3
A1 19 21 23
A2 20 22 24
- 数组定位
> z[1,2,3]
[1] 15
2.5 数据框
- 数据框创建
与数组的区别在于每一列的数据类型可以是不同的
mydata <- data.frame(col1, col2, col3,...)
#列向量col1、col2、col3等可为任何类型(如字符型、数值型或逻辑型)
#每一列数据的模式必须唯一
代码示例
> patientID <- c(1, 2, 3, 4)
> age <- c(25, 34, 28, 52)
> diabetes <- c("Type1", "Type2", "Type1", "Type1")
> status <- c("Poor", "Improved", "Excellent", "Poor")
> patientdata <- data.frame(patientID, age, diabetes, status)
> patientdata
 patientID age diabetes status
1 1 25 Type1 Poor
2 2 34 Type2 Improved
3 3 28 Type1 Excellent
4 4 52 Type1 Poor - 数据框元素选取
#数字索引选取
> patientdata[1:2]
 patientID age
1 1 25
2 2 34
3 3 28
4 4 52

#列名选取
> patientdata[c("diabetes", "status")]
 diabetes status
1 Type1 Poor
2 Type2 Improved
3 Type1 Excellent
4 Type1 Poor

#$符号选取单一变量
 > patientdata$age
[1] 25 34 28 52

#生成列联表
> table(patientdata$diabetes, patientdata$status)
       Excellent Improved Poor
 Type1     1         0     2
 Type2     0         1     0
attach()、detach()
summary(mtcars$mpg)
plot(mtcars$mpg, mtcars$disp)
plot(mtcars$mpg, mtcars$wt)

#改写如下

attach(mtcars)     #将数据框添加到R的搜索路径中
 summary(mpg)
 plot(mpg, disp)
 plot(mpg, wt)
detach(mtcars)     #将数据框从搜索路径中移除
#detach()并不会对数据框本身做任何处理。这句是可以省略的

> mpg <- c(25, 36, 47)
> attach(mtcars)
The following object(s) are masked _by_ '.GlobalEnv': mpg
> plot(mpg, wt)
Error in xy.coords(x, y, xlabel, ylabel, log) :
 'x' and 'y' lengths differ
> mpg
[1] 25 36 47
#在数据框mtcars被绑定(attach)之前,你们的环境中已经有了一个名为mpg的对象。
#在这种情况下,原始对象将取得优先权,
with()
with(mtcars, {
 print(summary(mpg))
 plot(mpg, disp)
 plot(mpg, wt)
})
#花括号{}之间的语句都针对数据框mtcars执行
#如果仅有一条语句(例如summary(mpg)),那么花括号{}可以省略


#局限性
#赋值仅在此函数的括号内生效
> with(mtcars, {
 stats <- summary(mpg)
 stats
 })
 Min. 1st Qu. Median Mean 3rd Qu. Max.
 10.40 15.43 19.20 20.09 22.80 33.90
> stats
Error: object 'stats' not found


#局限性办法
#使用特殊赋值符<<-替代标准赋值符(<-)
> with(mtcars, {
 nokeepstats <- summary(mpg)
 keepstats <<- summary(mpg)
})
> nokeepstats
Error: object 'nokeepstats' not found
> keepstats
 Min. 1st Qu. Median Mean 3rd Qu. Max.
 10.40 15.43 19.20 20.09 22.80 33.90
2.6 因子
- 变量
变量无法被声明。它们在首次被赋值时生成
名义型变量:没有顺序之分的类别 变量
有序型变量 :表示一种顺序关系,而非数量 关系
连续型变量:呈现为某个范围内的任意值
- 因子的使用
diabetes <- c("Type1", "Type2", "Type1", "Type1")
#转为普通因子
diabetes <- factor(diabetes)

status <- c("Poor", "Improved", "Excellent", "Poor")
#转为有序因子,默认为按字母从小到大排序
status <- factor(status, ordered=TRUE) #或者用order=TRUE

#指定levels选项来覆盖默认排序
status <- factor(status, order=TRUE,
                 levels=c("Poor", "Improved", "Excellent"))

#用标签labels代替数字1和2在结果中的输出
sex <- factor(sex, levels=c(1, 2), labels=c("Male", "Female"))
代码示例
> patientID <- c(1, 2, 3, 4)
> age <- c(25, 34, 28, 52)
> diabetes <- c("Type1", "Type2", "Type1", "Type1")
> status <- c("Poor", "Improved", "Excellent", "Poor")

> diabetes <- factor(diabetes)  #变为因子(无有序)
> status <- factor(status, order=TRUE)  #变为有序型因子,参数order=TRUE默认按字母从小到大
> patientdata <- data.frame(patientID, age, diabetes, status)

> str(patientdata)  #显示数据集的结构
‘data.frame’: 4 obs. of 4 variables:
 $ patientID: num 1 2 3 4
 $ age : num 25 34 28 52
 $ diabetes : Factor w/ 2 levels "Type1","Type2": 1 2 1 1
 $ status : Ord.factor w/ 3 levels "Excellent"<"Improved"<..: 3 2 1 3

> summary(patientdata)  #显示数据集的统计概要
 patientID age diabetes status
 Min. :1.00 Min. :25.00 Type1:3 Excellent:1
 1st Qu.:1.75 1st Qu.:27.25 Type2:1 Improved :1
 Median :2.50 Median :31.00 Poor :2
 Mean :2.50 Mean :34.75
 3rd Qu.:3.25 3rd Qu.:38.50
 Max. :4.00 Max. :52.00
2.7 列表
- 列表定义
列表中的对象可以是任何结构(包括列表本身)
- 列表创建
#生成列表
mylist <- list(object1, object2, ...)
#为列表对象命名
mylist <- list(name1=object1, name2=object2, ...)
代码示例
> g <- "My First List"
> h <- c(25, 26, 18, 39)
> j <- matrix(1:10, nrow=5)
> k <- c("one", "two", "three")
> mylist <- list(title=g, ages=h, j, k)

> mylist
$title
[1] "My First List"
$ages
[1] 25 26 18 39
[[3]]
 [,1] [,2]
[1,] 1 6
[2,] 2 7
[3,] 3 8
[4,] 4 9
[5,] 5 10
[[4]]
[1] "one" "two" "three" - 列表定位
#注意定位要用双中括号
> mylist[[2]]   #采用数字下标定位
[1] 25 26 18 39

> mylist[["ages"]]   #采用对象名称定位
[[1] 25 26 18 39
2.8 导入数据
2.8.1 使用键盘输入数据
#创建一个空数据框
mydata <- data.frame(age=numeric(0), #age=numeric(0)将创建一个指定模式但不含实际数据的变量
gender=character(0), weight=numeric(0))
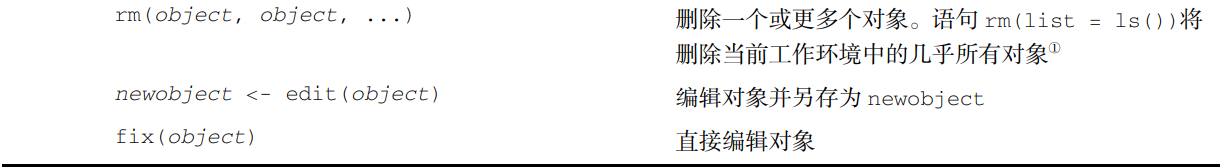
#启动编辑器编辑数据
mydata <- edit(mydata) #在对象的一个副本上进行操作,需将数据赋值到原对象
fix(mydata)
#直接嵌入数据集
mydatatxt <- "
age gender weight
25 m 166
30 f 115
18 f 120
"
#处理字符串并返回数据框
mydata <- read.table(header=TRUE, text=mydatatxt)2.8.2 从带分隔符的文本文件导入数据
options参数选项

mydataframe <- read.table(file, options) #导入文本文件


#文件示例
StudentID,First,Last,Math,Science,Social Studies
011,Bob,Smith,90,80,67
012,Jane,Weary,75,,80
010,Dan,"Thornton, III",65,75,70
040,Mary,"O'Leary",90,95,92

#生成形式一
grades <- read.table("studentgrades.csv", header=TRUE,
 row.names="StudentID", sep=",")

结果如下:
> grades

 First Last Math Science Social.Studies
11 Bob Smith 90 80 67
12 Jane Weary 75 NA 80
10 Dan Thornton, III 65 75 70
40 Mary O'Leary 90 95 92

#生成形式二
grades <- read.table("studentgrades.csv", header=TRUE,
 row.names="StudentID", sep=",",
 colClasses=c("character", "character", "character",
 "numeric", "numeric", "numeric"))

#结果如下
> grades

 First Last Math Science Social.Studies
011 Bob Smith 90 80 67
012 Jane Weary 75 NA 80
010 Dan Thornton, III 65 75 70
040 Mary O'Leary 90 95 92

#参数stringsAsFactors=FALSE对所有的字符变量都去掉转为因子的行为
#参数colClasses指明每一列的数据类型
2.8.3 导入其他类型文件
#EXCEL数据文件
#包xlsx,xlsxjars,rJava
library(xlsx)
workbook <- "c:/myworkbook.xlsx"
mydataframe <- read.xlsx(workbook, 1)  #数字1表示导入第一个工作簿

#对于大型工作簿使用xlsx2()
read.xlsx2()


#导入SPSS文件
#包Hmisc,默认安装foreign
library(Hmisc)
mydataframe <- spss.get("mydata.sav", use.value.labels=TRUE)
#use.value.labels=TRUE表示让函数
#将带有值标签的变量导入为R中水平对应相同的因子


#导入SAS数据
#foreign包中的 read.ssd()
#Hmisc包中的 sas.get()
#sas7bdat包中的 read.sas7bdat()


#导入Stata数据
library(foreign)
mydataframe <- read.dta("mydata.dta")
2.9 处理数据对象的实用函数

注:mode()是指数据在内存中的存储类型,class是指对象的类属性


 2029
2029


 被折叠的 条评论
为什么被折叠?
被折叠的 条评论
为什么被折叠?
 到【灌水乐园】发言


