


Pyplot
基础绘图
每个绘图函数对图形进行一些更改:例如,创建图形,在图形中创建绘图区域,在绘图区域绘制一些线条,使用标签装饰绘图等。
plt.plot()
plt.plot(x,y,‘b-’):通用的绘图函数,x y为numpy数组,第三个参数为线形,‘ro’红色点状,默认为蓝色线形;
一个plot绘制多条线
# evenly sampled time at 200ms intervals
t = np.arange(0., 5., 0.2)
# red dashes, blue squares and green triangles
plt.plot(t, t, 'r--', t, t**2, 'bs', t, t**3, 'g^')#三种线型
plt.show()
线条属性
 linewidth=2.0
 plot(X, C, color="blue", linewidth=2.5, linestyle="-")
plot(X, S, color="red",  linewidth=2.5, linestyle="-")
设置记号的标签
xticks([-np.pi, -np.pi/2, 0, np.pi/2, np.pi],
       [r'$-\pi$', r'$-\pi/2$', r'$0$', r'$+\pi/2$', r'$+\pi$'])

yticks([-1, 0, +1],
       [r'$-1$', r'$0$', r'$+1$'])
#或者
 plt.axis([0, 6, 0, 20])#坐标轴的范围xmin,xmax,ymin,ymax
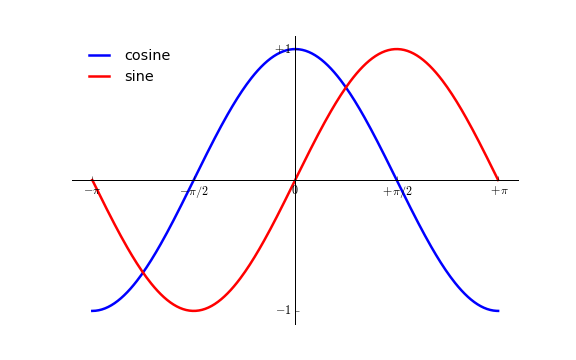
添加图例
plot(X, C, color="blue", linewidth=2.5, linestyle="-", label="cosine")
plot(X, S, color="red",  linewidth=2.5, linestyle="-", label="sine")
legend(loc='upper left')#位置
#法2
 plt.ylabel('some numbers')#label
绘制子图
subplot()
命令指定numrows,numcols,fignum,其中fignum的范围是从1到numrows * numcols。 如果numrows * numcols <10,则subplot命令中的逗号是可选的。
import numpy as np
import matplotlib.pyplot as plt

def f(t):
    return np.exp(-t) * np.cos(2*np.pi*t)

t1 = np.arange(0.0, 5.0, 0.1)
t2 = np.arange(0.0, 5.0, 0.02)

plt.figure(1)
plt.subplot(211)#选择一个子图 下文添加图形绘制
plt.plot(t1, f(t1), 'bo', t2, f(t2), 'k')

plt.subplot(212)#另一个子图
plt.plot(t2, np.cos(2*np.pi*t2), 'r--')
plt.show()
处理文本
text()命令可用于在任意位置添加文本,xlabel(),ylabel()和title()用于在指定的位置添加文本
import numpy as np
import matplotlib.pyplot as plt

mu, sigma = 100, 15
x = mu + sigma * np.random.randn(10000)

# 数据的直方图
n, bins, patches = plt.hist(x, 50, normed=1, facecolor='g', alpha=0.75)

plt.xlabel('Smarts')
plt.ylabel('Probability')
plt.title('Histogram of IQ')
plt.text(60, .025, r'$\mu=100,\ \sigma=15$')
plt.axis([40, 160, 0, 0.03])
plt.grid(True)
plt.show()

数学表达式
plt.title(r'$\sigma_i=15$')
标注文本
参考:https://matplotlib.org/2.0.2/examples/pylab_examples/annotation_demo.html
对数和其它非线性轴
参考:https://wizardforcel.gitbooks.io/matplotlib-user-guide/content/3.1.html
散点图
X = np.random.normal(0,1,n)
Y = np.random.normal(0,1,n)

scatter(X,Y)
更多类型图示
参考:https://www.runoob.com/w3cnote/matplotlib-tutorial.html
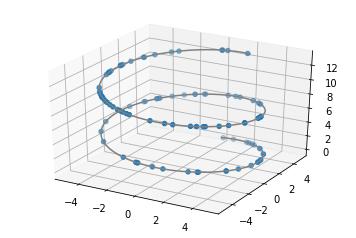
三维绘图
#方法一,利用关键字
from matplotlib import pyplot as plt
from mpl_toolkits.mplot3d import Axes3D

#定义坐标轴
fig = plt.figure()
ax1 = plt.axes(projection='3d')

import numpy as np
z = np.linspace(0,13,1000)
x = 5*np.sin(z)
y = 5*np.cos(z)
zd = 13*np.random.random(100)
xd = 5*np.sin(zd)
yd = 5*np.cos(zd)
ax1.scatter3D(xd,yd,zd, cmap='Blues')  #绘制散点图
ax1.plot3D(x,y,z,'gray')    #绘制空间曲线
plt.show()
三维曲面
参考:https://blog.csdn.net/u014636245/article/details/82799573


 284
284


 被折叠的 条评论
为什么被折叠?
被折叠的 条评论
为什么被折叠?
 到【灌水乐园】发言


