


声明:本篇论文参考 R姑娘 R语言和统计
我们在做研究或者写论文时,常常需要制作一些表格,逐个地输入显得太费时间。
R包{rempsyc}的作者开发出一个符合论文规范的函数,我们一起来看看吧。
###  制作论文表格
library(rempsyc)
library(broom)
library(flextable)
#利用R自带的数据集iris
#iris数据集介绍
#鸢尾花(iris)是数据挖掘常用到的一个数据集,包含150种鸢尾花的信息,每50种取自三个鸢尾花种之一(setosa,versicolour或virginica)。每个花的特征用下面的5种属性描述萼片长度(Sepal.Length)、萼片宽度(Sepal.Width)、花瓣长度(Petal.Length)、花瓣宽度(Petal.Width)、类(Species)。
mydata <- cbind(rownames(iris[1:6,]), iris[1:6,]) # 提取原数据前6行的行名称作为新的变量,并与原数据前6行拼接
colnames(mydata)[1] <- "Number_names" # 修改第一列的名称
mydata
#将mydata作为表格输出
my_table <- nice_table(mydata,title = "Table1.  Some  Features of Iris ",
                       note = c("Each of the 50 species is taken from one of the three iris species."))

my_table#查看结果
#如果想直接输出到word里面可以参考以下代码
flextable::save_as_docx(my_table, path = "R_Learning.docx")
#接下来你就可以在你的R路劲里面直接找到R_Learning的一个word文档,打开就会发现已生成好一个表格
若你想直接打开word的表格,可以按如下代码操作:
print(my_table, preview = "docx")#使用print直接打开word表格
如果想把表格用latex输出可以参考如下
library(xtable)#引用xtable包
xtable(mydata,digits = 3,caption = "Some  Features of Iris")
#digits是精度,也就是给表格中的数据定义小数点位数
得到的结果如下: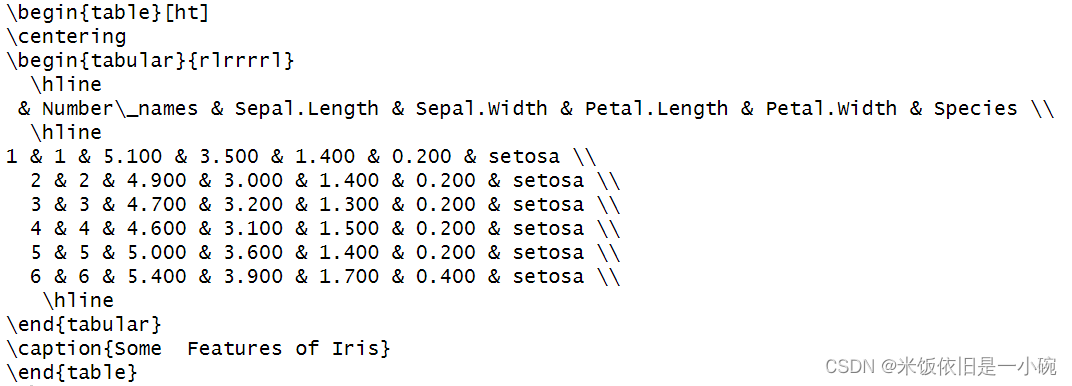
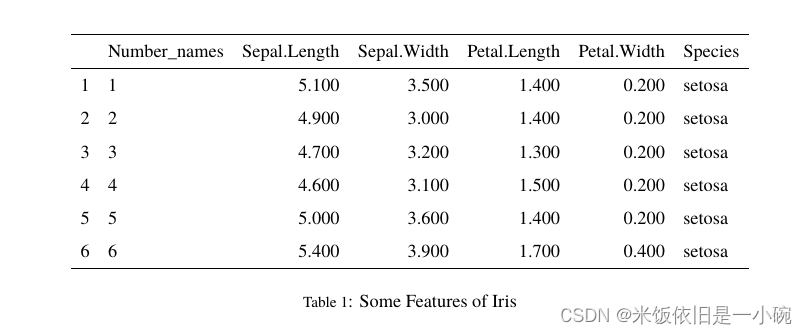
这个是R的输出结果,我们把它复制到latex里面可得如下结果:
欢迎大家交流讨论!


 227
227


 被折叠的 条评论
为什么被折叠?
被折叠的 条评论
为什么被折叠?
 到【灌水乐园】发言


