


5.5 实验五 图像的边缘检测和分割(综合性)
一、实验目的
1.学会使用编程实现不同算法的边缘检测。
2.学会使用编程实现不同算法的图像分割。
3.能够根据实验结果分析各种算法的特点及其应用场合,培养处理实际图像的能力。
二、实验要求
1.实验课前需要写预习实验报告,内容为本次实验要求中的所有程序清单。
2.实验课对预习报告中的编程代码进行上机调试,完成实验指导书中全部实验要求内容。
3.实验课后写出实验报告。报告要求有实验目的,实验内容与步骤,调试完成的准确编程代码,实验小结,回答问题。
三、实验内容(每一个内容编写一个*.m文件)
1.边缘检测:
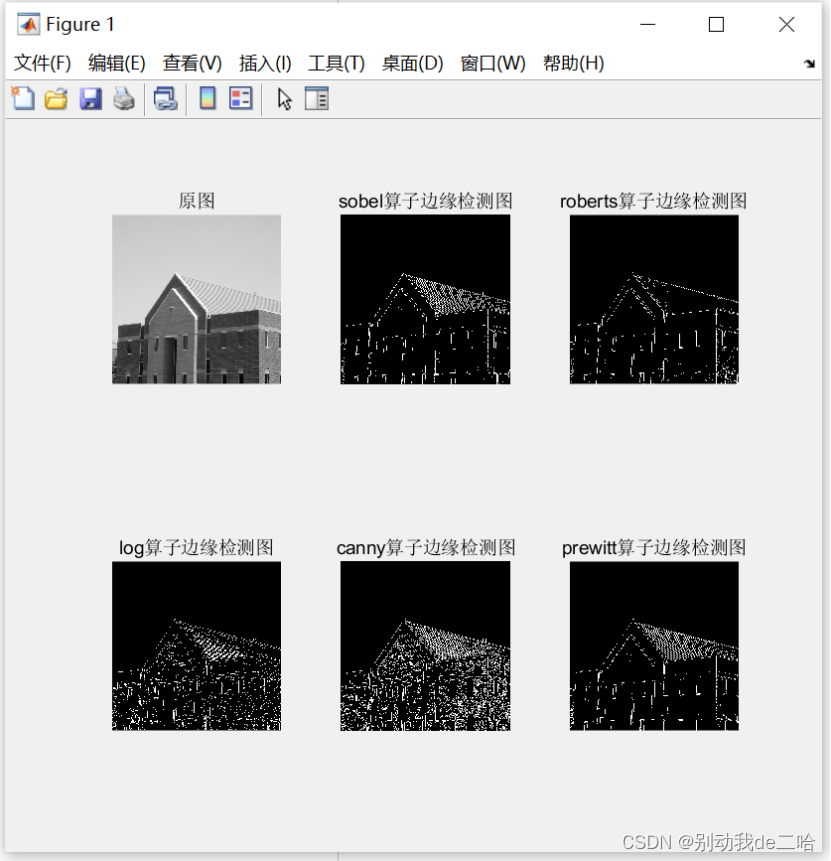
(1)利用边缘检测函数edge ()对灰度图像(house.tif)进行边缘检测,检测算子分别选择’roberts’、‘sobel’、‘prewitt’、LOG、‘Canny’(其他参数选择:default),比较不同检测算子对边缘检测的效果;
1.利用imread()函数分别读入图像trees.tif和ngc6543a.jpg,存入两个数组中,用“whos”命令获取图像的基本信息。
实验代码:
clc;
clf;
I = imread("C:/Users/25023/Desktop/图像识别文件/实验五用到的图像/house.tif");
imshow(I)

BW1=edge(I,'sobel');
BW2=edge(I,'roberts');
BW3=edge(I,'log');
BW4=edge(I,'canny');
BW5=edge(I,'prewitt');

figure(1)
subplot(2,3,1);
imshow(I);
title('原图');

subplot(2,3,2);
imshow(BW1);
title('sobel算子边缘检测图');

subplot(2,3,3);
imshow(BW2);
title('roberts算子边缘检测图');

subplot(2,3,4);
imshow(BW3);
title('log算子边缘检测图');

subplot(2,3,5);
imshow(BW4);
title('canny算子边缘检测图')

subplot(2,3,6);
imshow(BW5);
title('prewitt算子边缘检测图')
实验结果:
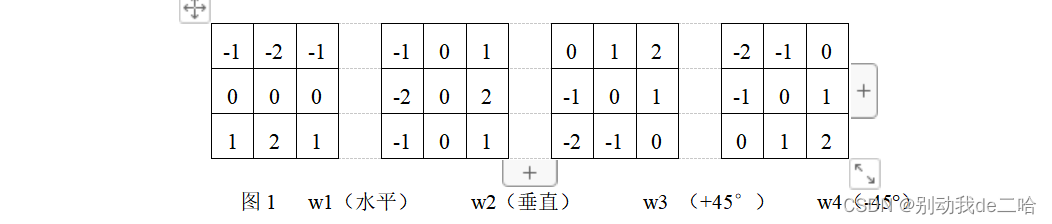
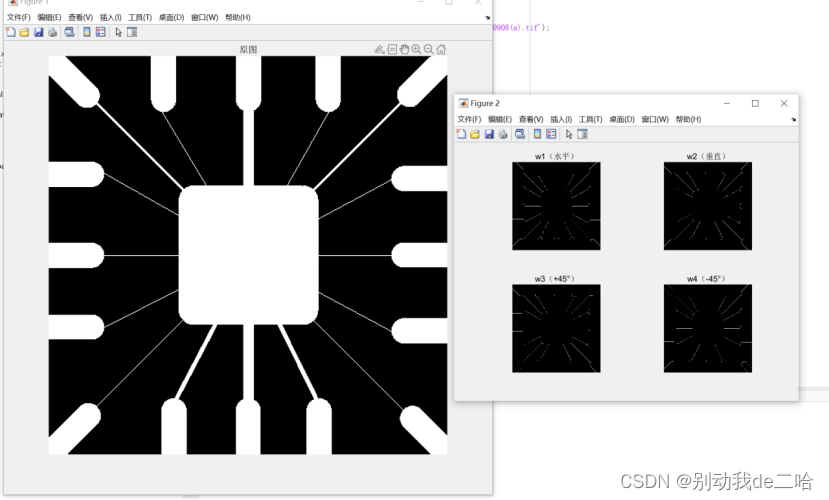
(2)利用工具箱函数imfilter()和如图1所示四种不同方向的线检测模板w1/w2/w3/w4对图像(Fig0908(a).tif)进行边缘检测,比较不同方向的检测算子对边缘检测的效果;
实验代码:
clc;
clf;
a=imread('C:/Users/25023/Desktop/图像识别文件/实验五用到的图像/Fig0908(a).tif');
h1=[-1 -2 -1; 0 0 0; 1 2 1 ];
h2=[-1 0 1; -2 0 2; -1 0 1 ];
h3=[0 1 2; -1 0 1; -2 -1 0 ];
h4=[-2 -1 0; -1 0 1; 0 1 2 ];
b=imfilter(a,h1);  %其他参数选择default
c=imfilter(a,h2);
d=imfilter(a,h3);
e=imfilter(a,h4);

figure(1);
imshow(a);
title('原图');

figure(2);
subplot(2,2,1);
imshow(b);
title('w1(水平)');
subplot(2,2,2);
imshow(c);
title('w2(垂直)');
subplot(2,2,3);
imshow(d);
title('w3(+45°)');
subplot(2,2,4);
imshow(e);
title('w4(-45°)');
实验结果:
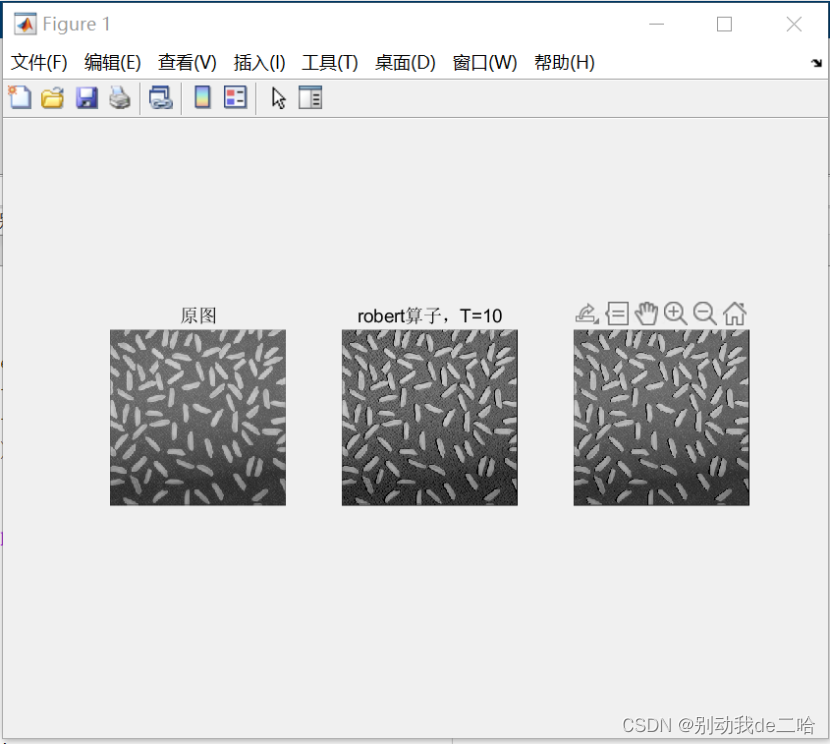
2.对灰度图像(rice.tif)编程实现图像锐化增强(算子如图2所示):
(1)利用robert算子检测图像边缘,并采用门限法得到锐化增强图像(T=10,T=50);
实验代码:
I = imread('C:/Users/25023/Desktop/图像识别文件/实验五用到的图像/rice.tif');

[x,y] = size(I);
Q = double(I);
robert10 = I;
robert50 = I;
T1=10;    T2=50;
%定义robert算子
for i = 1:x-1
    for j = 1:y-1
        Gx = ( Q(i+1,j+1) - I(i,j) );    %固定模板
        Gy = ( Q(i,j+1) - I(i+1,j) );
        if ( abs(Gx) + abs(Gy) ) >= T1    %门限法T=10;
            robert10(i, j) = abs(Gx) + abs(Gy);   %差分
        else
            robert10(i, j) = 0;          %不符合设为0
        end
        if ( abs(Gx) + abs(Gy) ) >= T2     %门限法T=50;
            robert50(i, j) = abs(Gx) + abs(Gy);
        else
            robert50(i, j) = 0;
        end
    end
end
M=(I-robert10);
N=(I-robert50);
subplot(1,3,1);imshow(I);title('原图');
subplot(1,3,2);imshow(M);title('robert算子,T=10');
subplot(1,3,3);imshow(N);title('robert算子,T=50');
实验结果:
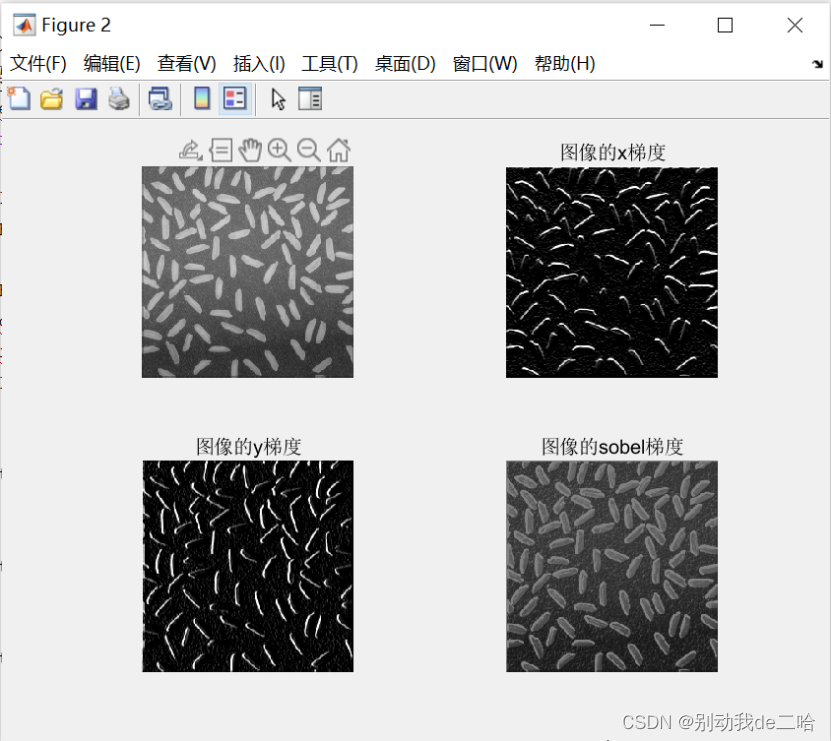
(2)利用sobel算子检测图像边缘并得到锐化增强图像;
实验代码:
s1=[-1,-2,-1;0,0,0;1,2,1];
s2=[-1,0,1;-2,0,2;-1,0,1];
gradx=imfilter(f,s1);
grady=imfilter(f,s2);
grad=abs(gradx)+abs(grady);

figure(2);
subplot(2,2,1);imshow(f);title('原始图像');
subplot(2,2,2);imshow(gradx);title('图像的x梯度');
subplot(2,2,3);imshow(grady);title('图像的y梯度');
subplot(2,2,4);imshow((grad+I)/2);title('图像的sobel梯度');
实验结果:
(3)利用Laplacian算子检测图像边缘,分H1和H2两种情况,并得到锐化增强图像;
实验代码:
I1=imread("C:/Users/25023/Desktop/图像识别文件/实验五用到的图像/rice.tif");

L0=[0 1 0;1 -4 1;0 1 0];
MotionBlur1 = imfilter(I1,L0);
L=[1 1 1;1 -8 1;1 1 1];
MotionBlur2 = imfilter(I1,L);
w=fspecial('laplacian',0);
g1=imfilter(I1,w,'replicate');
g=I1-g1;

figure(3);
subplot(2,2,1);
imshow(I1);
title('原始图像');
subplot(2,2,2);
imshow(MotionBlur1);
title('H1Laplacian算子');
subplot(2,2,3);
imshow(MotionBlur2);
title('H2Laplacian算子');
subplot(2,2,4);
imshow(g);
title('matlab自带函数锐化');
实验结果:

(4)比较采用不同边缘检测算子锐化增强图像的不同效果。
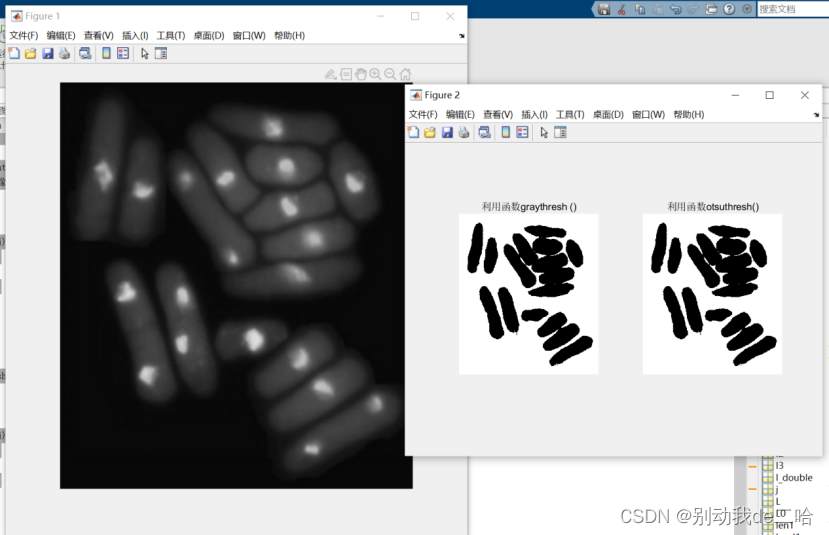
- 对灰度图像(Fig1018(a).tif)实现基于阈值处理的图像分割(1为必做内容,2-4为选做内容):
(1)利用函数graythresh ()和otsuthresh()找到全局阈值,对图像进行分割;
代码:
clc;
clf;

I = imread("C:/Users/25023/Desktop/图像识别文件/实验五用到的图像/Fig1018(a).tif");
figure(1);
imshow(I);

figure(2);
level1 = graythresh(I) ;     %计算基于Otsu方法的灰度图像全局阈值
counts=imhist(I);
level2 = otsuthresh(counts);   %计算基于Otsu方法的灰度图像全局直方图阈值
[wid1,len1]=size(I);%图像的大小
I_double=im2double(I);
for i=1:wid1
     for j=1:len1
         if I_double(i,j)>level1 %大于所设定的均值 则为目标
             BW1(i,j)=0;
         else
             BW1(i,j)=1;
         end
     end
end
subplot(1,2,1);
imshow(BW1);
title("利用函数graythresh ()");

for i=1:wid1
     for j=1:len1
         if I_double(i,j)>level2 %大于所设定的均值 则为目标
             BW2(i,j)=0;
         else
             BW2(i,j)=1;
         end
     end
end
subplot(1,2,2);
imshow(BW2);
title("利用函数otsuthresh()");
实验结果:
(2)采用迭代阈值选取方法,编程实现基于图像数据自动地选择阈值,对图像进行全局阈值分割;
(3)使用Otsu阈值选取方法,编程实现对图像进行最佳全局阈值分割;
(4)比较迭代法和Otsu法两种不同的阈值处理方法对图像进行分割的效果。


 961
961


 被折叠的 条评论
为什么被折叠?
被折叠的 条评论
为什么被折叠?
 到【灌水乐园】发言


