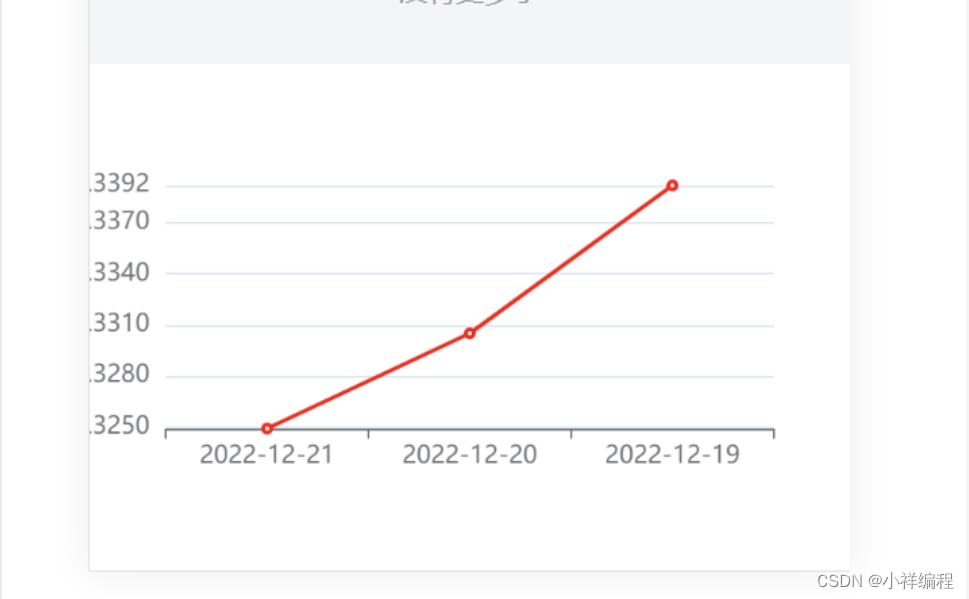
项目场景: 在使用echart绘制图表的过程中,y轴刻度标签显示不全,效果如下图所示: 问题描述 在项目中使用echart绘制图表,y轴刻度标签显示不全,代码如下: const getChartsData = () => { const myChart = echarts.init(document.getElementById('myChart123')) // 绘制图表 const xData = state.arrHistoryList.map(item => { return item.valueDate


 最低0.47元/天 解锁文章


 519
519

 被折叠的 条评论
为什么被折叠?
被折叠的 条评论
为什么被折叠?
 到【灌水乐园】发言


 被折叠的 条评论
为什么被折叠?
到【灌水乐园】发言
被折叠的 条评论
为什么被折叠?
到【灌水乐园】发言


