


介绍:实现省级(河南为例)下探,且在数据不变的情况下展示散点
完成图:

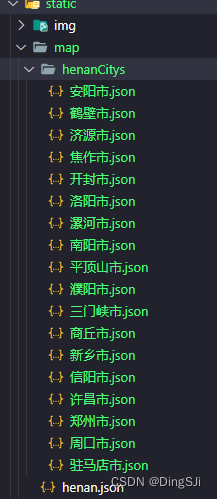
1,准备地图geoJSON,DataV.GeoAtlas地理小工具系列
创建工具函数:引入目录下的所有文件,实现传入地名返回该地方的geoJson(这里使用了动态引用)
// util.js
const modulesFiles = require.context('../../static/map/henanCitys', true, /\.json$/)
const lib = {}
modulesFiles.keys().forEach(item => {
  let str = item.replace(/^\.\/(.*)\.\w+$/, '$1')
  lib[str] = require(`../../static/map/henanCitys/${str}.json`)
})

export function getMap(mapName) {
    const cityJson = lib[mapName]
    if(cityJson){
        return cityJson
    }
}
2, 初始化地图组件
<template>
  <div id="dpmap" />
</template>
import geoJson from "static/map/henan.json";
export default {
  props: {
    value: {
      type: Array,
      default: [],
    },
    resizeChange: "",
  },
  data() {
    return {
      chart: null,
      provinceOption: null,
      cityOption: null,
      mapArr: [],//散点数据
    };
  },
  watch: {
    value: {
      deep: true,
      handler(val) {
          this.setProvinceOptions(val);
      },
    },
    resizeChange: {
      deep: true,
      handler(val) {
        this.chart.resize();
      },
    },
  },
  mounted() {
    //注册地图
    echarts.registerMap("henan", geoJson);
    this.chart = echarts.init(document.getElementById("dpmap"));
  },
  beforeDestroy() {
    if (!this.chart) {
      return;
    }
    this.chart.dispose();
    this.chart = null;
  },
3,渲染省级地图和散点 (定义点击事件,为下探操作做准备)
setProvinceOptions(val) {

      this.mapArr=val.map(item=>{
        return {
          name: item.orgName,
          value: [item.longitude||112.540918, item.latitude||32.999082, item.consNum||0],
        }
      })
      this.provinceOption = {
        tooltip: this.publicOption.tooltip,
        geo: [
          {
            map: "henan",
            aspectScale: 1,
            top: 20,
            bottom: 20,
            zlevel: 0,
            label: this.publicOption.geo.label,
            itemStyle: this.publicOption.geo.itemStyle,
          },

        ],
        series: [
          {
            type: "scatter",
            animationDurationUpdate: 0,
            zlevel: 2,
            coordinateSystem: "geo",
            data: this.mapArr,
            symbolSize:function(value){
              return value[2]<10?5:value[2]<20?10:20
            },
            label: {
              show: false,
            },
            itemStyle: {
              color: "#ffaa67",
            },
          },
          {
            map: "henan",
            type: "map",
            zlevel: -1,
            left: -5,
            right: 5,
            top: 30,
            bottom: 10,
            silent: true,
            itemStyle: this.publicOption.series.itemStyle,
          },
        ],
      }

      this.chart.setOption(this.provinceOption);

      this.chart.on('click', (params) => {
        this.setCityOptions(params)

      })
    },
4,渲染下一级地图和散点
setCityOptions(params) {
      // 如果点击返回
      if(params.componentType == "graphic") {
        return this.chart.setOption(this.provinceOption, true);
      }
      let cityJson = getMap(params.name)

      /* 判断数据是否在地图内 */
      // 加载地图的多边形
      let polygons = [];
      cityJson.features.forEach(item => {
        polygons.push(turf.polygon(...item.geometry.coordinates))
      })
      let mapArr = this.mapArr.filter(item => {
        // 判断点是否在多边形内
        return polygons.some(item1 => {
          return turf.booleanPointInPolygon(turf.point([item.value[0],item.value[1]]), item1)
        })

      })

      // 点击城市
      if(cityJson){
        echarts.registerMap(params.name, cityJson);
        this.cityOption = {
          title: {
            text: '河南省-' + params.name,
            top: "5%",
            left: "5%",
          },
          tooltip: this.publicOption.tooltip,
          geo: [
            {
              map: params.name,
              top: 50,
              left: 50,
              bottom: 30,
              right: 50,
              zlevel: 0,
              clip: true,
              label: this.publicOption.geo.label,
              itemStyle: this.publicOption.geo.itemStyle,
            },
          ],
          series: [
            {
              name: params.name,
              type: "map",
              map: params.name,
              data: cityJson,
              clip: true,
              zlevel: -1,
              top: 60,
              bottom: 20,
              left: 60,
              right: 40,
              silent: true,
              itemStyle: this.publicOption.series.itemStyle,
            },
            {
              type: "scatter",
              animationDurationUpdate: 0,
              zlevel: 2,
              coordinateSystem: "geo",
              data: mapArr,
              symbolSize:function(value){
                return value[2]<10?5:value[2]<20?10:20
              },
              clip: true,
              label: {
                show: false,
              },
              itemStyle: {
                color: "#ffaa67",
              },
            },
          ],
          graphic: {
            type: "text",
            top: "5%",
            right: "5%",
            zlevel: 9,
            style: {
              text: "←返回",
              fill: '#fff',
              fontSize: "20px"
            }
          },
        }
        this.chart.setOption(this.cityOption, true)
      }
    }
与省级不同的是,需要一个返回按钮(graphic定义),创建对应返回事件,再用setOption重新渲染页面(true代表与原有的配置不合并)。
调工具函数getMap() 注册地图。
此时会发现一个难处理的点,在只有一组原始数据this.mapArr不去调任何接口,散点图会超出地图外,我们需要把超出地图外的点去除。

如何去除?引入truf.js库,来帮助我们计算。
还记得开头的geoJSON吗?它的数据格式是这样的
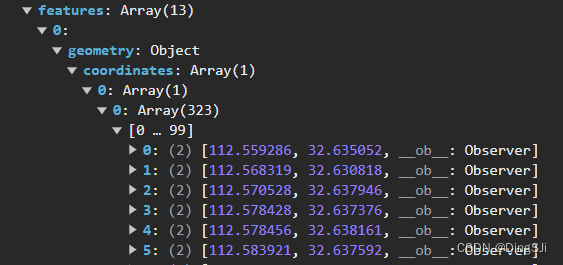
我们根据坐标点用polygon转换为多边形,再用booleanPointInPolygon判断一个点是否在其多边形内,对所有的多边形遍历去筛选数据。然后再进行配置渲染,至此,功能完成。


 6209
6209


 被折叠的 条评论
为什么被折叠?
被折叠的 条评论
为什么被折叠?
 到【灌水乐园】发言


