


实验内容:
绘制显示局部整体关系的饼图和圆环图,观察数据不同分类的占比情况。
实验要求:
自选局部整体型数据集,绘制饼图和圆环图。要求说明数据集来源,详细介绍数据集内容,绘制前将数据排序。
实验目的:
掌握饼图和圆环图的绘制方法,理解局部整体数据的可视化方法。
import pandas as pd
import numpy as np
import matplotlib.pyplot as plt
from matplotlib import cm,colors
df=pd.DataFrame(dict(labels =['LVS','SJM','MCE','Galaxy','MGM','Wynn'],sizes = [24.20,75.90,12.50,12.30,8.10,12.10]))
df=df.sort_values(by='sizes',ascending=False)
df=df.reset_index()
cmap=cm.get_cmap('Reds_r',6)
color=[colors.rgb2hex(cmap(i)[:3]) for i in range(cmap.N)]
fig, ax = plt.subplots(figsize=(6, 3), subplot_kw=dict(aspect="equal"))
wedges, texts = ax.pie(
df['sizes'].values,
startangle=90,
# shadow=True,
counterclock=False,
colors=color,
wedgeprops =dict(linewidth=0.5, edgecolor='k'))
bbox_props = dict(boxstyle="square,pad=0.3", fc="w", ec="k", lw=0.72)
kw = dict(xycoords='data', textcoords='data', arrowprops=dict(arrowstyle="-"),bbox=bbox_props, zorder=0, va="center")
for i, p in enumerate(wedges):
# print(i)
ang = (p.theta2 - p.theta1)/2. + p.theta1
y = np.sin(np.deg2rad(ang))
x = np.cos(np.deg2rad(ang))
horizontalalignment = {-1: "right", 1: "left"}[int(np.sign(x))]
connectionstyle = "angle,angleA=0,angleB={}".format(ang)
kw["arrowprops"].update({"connectionstyle": connectionstyle})
ax.annotate(df['labels'][i], xy=(x, y), xytext=(1.2*x, 1.2*y),
horizontalalignment=horizontalalignment,
arrowprops=dict(arrowstyle='-'))
plt.show()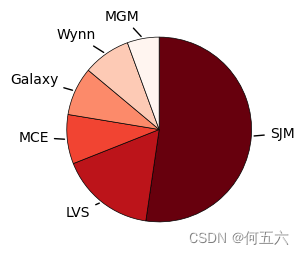
df=pd.DataFrame(dict(labels =['LVS','SJM','MCE','Galaxy','MGM','Wynn'],sizes = [24.20,75.90,12.50,12.30,8.10,12.10]))
df=df.sort_values(by='sizes',ascending=False)
df=df.reset_index()
cmap=cm.get_cmap('Reds_r',6)
color=[colors.rgb2hex(cmap(i)[:3]) for i in range(cmap.N)]
fig, ax = plt.subplots(figsize=(6, 3), subplot_kw=dict(aspect="equal"))
wedges, texts = ax.pie(
    df['sizes'].values,
    startangle=90,
#     shadow=True,
    counterclock=False,
    colors=color,
    wedgeprops={'width':0.3}
    )
bbox_props = dict(boxstyle="square,pad=0.3", fc="w", ec="k", lw=0.72)
kw = dict(xycoords='data', textcoords='data', arrowprops=dict(arrowstyle="-"),bbox=bbox_props, zorder=0, va="center")
for i, p in enumerate(wedges):
#     print(i)
    ang = (p.theta2 - p.theta1)/2. + p.theta1
    y = np.sin(np.deg2rad(ang))
    x = np.cos(np.deg2rad(ang))
    horizontalalignment = {-1: "right", 1: "left"}[int(np.sign(x))]
    connectionstyle = "angle,angleA=0,angleB={}".format(ang)
    kw["arrowprops"].update({"connectionstyle": connectionstyle})
    ax.annotate(df['labels'][i], xy=(x, y), xytext=(1.2*x, 1.2*y),
    horizontalalignment=horizontalalignment,
    arrowprops=dict(arrowstyle='-'))
plt.show()


 4370
4370


 被折叠的 条评论
为什么被折叠?
被折叠的 条评论
为什么被折叠?
 到【灌水乐园】发言


