


1.引入echarts
import * as echarts from 'echarts';
import 'echarts-liquidfill';
2.创建画布
<div id="liucharts" style="width: 100%;height: 300px"></div>3.代码实现
initLiuCharts(){
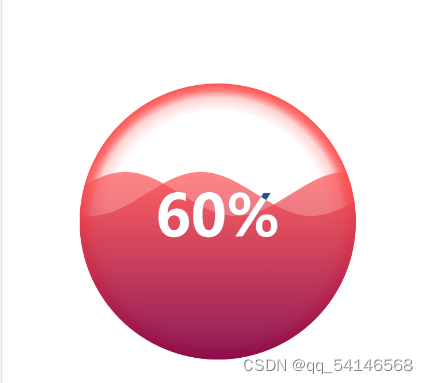
// 红色水球
const myCharts = echarts.init(document.getElementById('liucharts'))
myCharts.setOption({
series: [{
backgroundColor: 'transparent',
type: 'liquidFill',
radius: '80%',
data: [0.6,0.6],
backgroundStyle: {
color: {
type: 'radial',
x: 0.5,
y: 0.5,
r: 0.5,
colorStops: [{
offset: 0.8,
color: 'rgba(255, 81, 81, 0.0)'
},
{
offset: 0.9,
color: 'rgba(255, 81, 81, 0.25)'
},
{
offset: 0.95,
color: 'rgba(255, 81, 81, 0.75)'
},
{
offset: 1,
color: 'rgba(255, 81, 81, 1)'
}],
globalCoord: false
},
},
itemStyle: {
shadowBlur: 0,
color: new echarts.graphic.LinearGradient(0, 1, 0, 0, [{
offset: 1,
color: 'rgba(255, 81, 81, 1)'
}, {
offset: 0,
color: 'rgba(130, 4, 72, 1)'
}]),
opacity: 0.7,
},
outline: {
show: false
},
}]
})
// 黄色水球
const myCharts = echarts.init(document.getElementById('liucharts'))
myCharts.setOption({
backgroundColor: 'transparent',
series: [{
type: 'liquidFill',
radius: '80%',
center: ['50%', '57.5px'],
data: [procent, procent],
backgroundStyle: {
color: {
type: 'radial',
x: 0.5,
y: 0.5,
r: 0.5,
colorStops: [{
offset: 0.8,
color: 'rgba(255, 215, 137, 0.0)'
},
{
offset: 0.9,
color: 'rgba(255, 215, 137, 0.25)'
},
{
offset: 0.95,
color: 'rgba(255, 215, 137, 0.75)'
},
{
offset: 1,
color: 'rgba(255, 215, 137, 1)'
}],
globalCoord: false
},
},
itemStyle: {
shadowBlur: 0,
color: new echarts.graphic.LinearGradient(0, 1, 0, 0, [{
offset: 1,
color: 'rgba(255, 215, 137, 1)'
}, {
offset: 0,
color: 'rgba(161, 57, 25, 1)'
}]),
opacity: 0.7,
},
outline: {
show: false
},
label: {
normal: {
formatter: '',
},
},
}]
})
//绿色水球
const myCharts = echarts.init(document.getElementById('liucharts'))
myCharts.setOption({
backgroundColor: 'transparent',
series: [{
type: 'liquidFill',
radius: '80%',
center: ['50%', '57px'],
data: [procent, procent],
backgroundStyle: {
color: {
type: 'radial',
x: 0.5,
y: 0.5,
r: 0.5,
colorStops: [{
offset: 0.8,
color: 'rgba(24, 221, 138, 0.0)'
},
{
offset: 0.9,
color: 'rgba(24, 221, 138, 0.25)'
},
{
offset: 0.95,
color: 'rgba(24, 221, 138, 0.75)'
},
{
offset: 1,
color: 'rgba(24, 221, 138, 1)'
}],
globalCoord: false
},
},
itemStyle: {
shadowBlur: 0,
color: new echarts.graphic.LinearGradient(0, 1, 0, 0, [{
offset: 1,
color: 'rgba(24, 221, 138, 1)'
}, {
offset: 0,
color: 'rgba(8, 90, 55, 1)'
}]),
opacity: 0.7,
},
outline: {
show: false
},
label: {
normal: {
formatter: '',
},
},
}]
})
}效果演示,只展示红色


 6882
6882

 被折叠的 条评论
为什么被折叠?
被折叠的 条评论
为什么被折叠?
 到【灌水乐园】发言


