


目录
1.4.2 类
class 类名
    def __init__(self, 参数, ……)
    ……
    def 方法名1(self, 参数, ……)
    ……
此处的__init__为构造函数,只在生成类的实例时被调用一次
1.5.2 生成NumPy数组
使用np.array()生成NumPy数组。np.array()方法接收Python列表作为参数,生成NumPy数组(numpy.ndarray)。
import numpy as np
x = np.array[1.0, 2.0, 3.0]
y = np.array([1, 2], [3, 4])#二维数组(矩阵)
print(x)
#[1. 2. 3.]
#type(x)为numpy.ndarrayNumPy数组(np.array)可以生成N维数组,数学上将一维数组称为向量,将二维数组称为矩阵,可以把一般化后的向量或矩阵统称为张量(tensor)将三维及以上数组称为“张量”
1.6.1 绘制简单图形
使用Matplotlib的pyplot模块绘制简单图形
import numpy as np
import matplotlib.pyplot as plt
#生成数据
x = np.arange(0, 6, 0.1)#以0.1为单位,生成0到6的数据
y = np.sin(x)
plt.plot(x, y)    #将x,y的数据传给plt.plot方法
plt.show()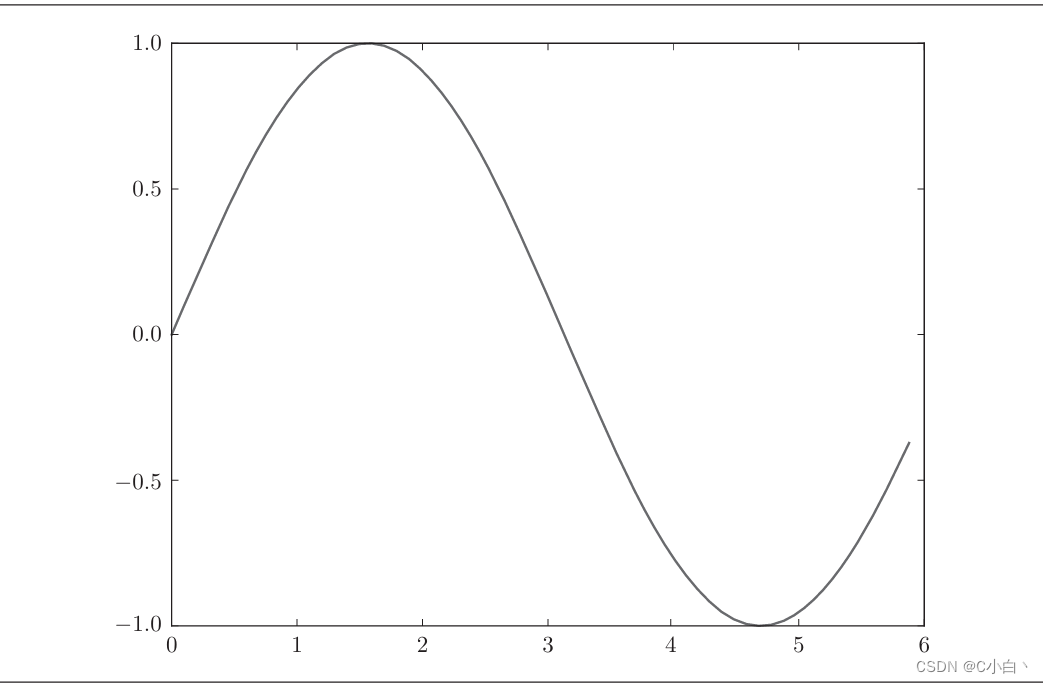
1.6.2 pyplot的功能
在上述图形追加cos函数图形,并使用pyplot其他功能
import numpy as np
import matplotlib.pyplot as plt
#生成数据
x = np.arange(0, 6, 0.1)#以0.1为单位,生成0到6的数据
y1 = np.sin(x)
y2 = np.cos(x)

plt.plot(x, y1, label="sin")
plt.plot(x, y2, linestyle = "--", label = "cos")
plt.xlabel("X")#X轴标签
plt.xlabel("Y")#Y轴标签
plt.title('sin & cos')#标题
plt.legend()
plt.show()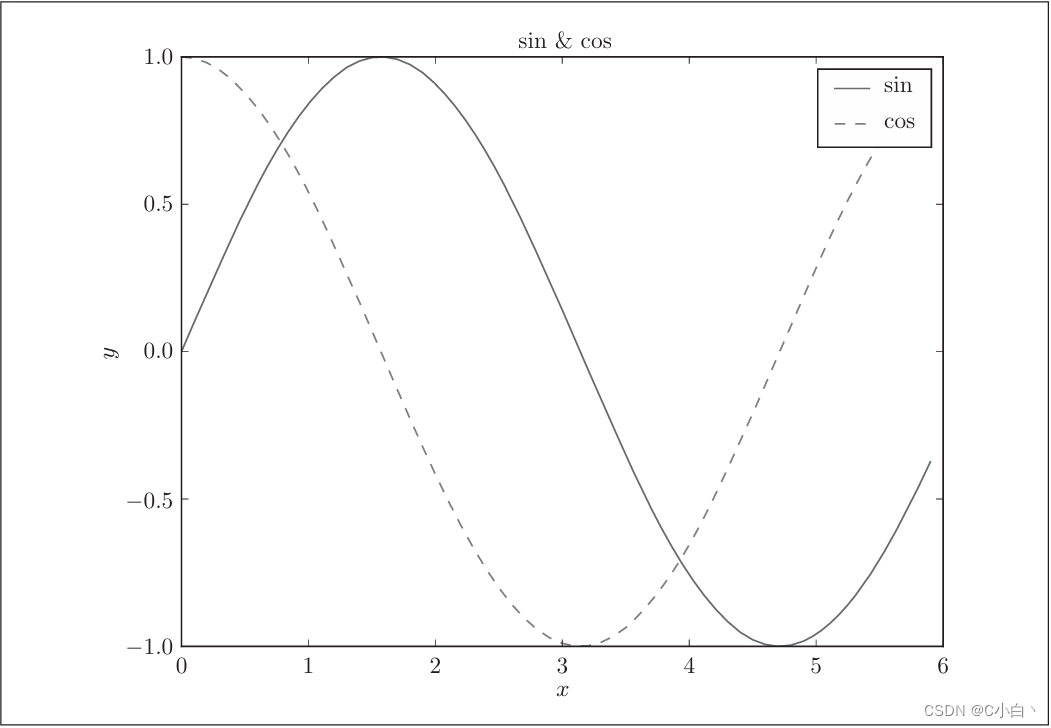
1.6.3 显示图形
pyplot提供显示图像的方法imshow(),可以使用matplotlib.image模块的imread()方法读入图像
import matplotlib.pyplot as plt
import matplotlib.image import imread
img = imread('text.png')#输入合适路径
plt.imshow(img)
plt.show


 826
826


 被折叠的 条评论
为什么被折叠?
被折叠的 条评论
为什么被折叠?
 到【灌水乐园】发言


