


以下为示例代码,其中代码的第二行和第三行为解决中文显示异常问题,参考链接可看(5条消息) 解决matplotlib和seaborn标题和轴名称中文无法正常显示的问题_爱打羽毛球的小怪兽的博客-CSDN博客_seaborn 标题
import matplotlib.pyplot as plt
plt.rcParams['font.sans-serif']=['FangSong']
plt.rcParams['axes.unicode_minus']=False

close=[22.23,22.59,22.36,22.47,22.85,22.79,22.76,23.83,24.27,25.38,25.5]
date=['2022/10/01','2022/10/02','2022/10/03','2022/10/04','2022/10/05','2022/10/06','2022/10/07','2022/10/08','2022/10/09','2022/10/10']
values=[56222,23456,67298,84672,56283,82736,73849,72239,73849,97389]

fig,ax1=plt.subplots()
plt.bar(date,values,width=0.4,label='交易量')
plt.legend(loc=0)
plt.xlabel('日期')
plt.ylabel('交易量')
plt.title('一只小怪兽的股票')
plt.xticks(rotation=60)

ax2=ax1.twinx()
plt.plot(close,'r',lw=3,label='收盘价')
plt.grid(True)
plt.legend(loc=0)
plt.ylabel('收盘价')
plt.show()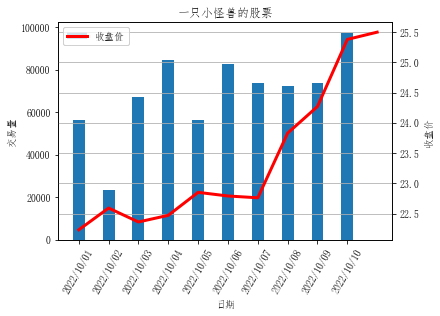


 1193
1193


 被折叠的 条评论
为什么被折叠?
被折叠的 条评论
为什么被折叠?
 到【灌水乐园】发言


