


一、使用Web API
1.处理API响应
(1)url变量存储API调用的URL。
(2)通过指定headers显式地要求使用这个版本的API。
(3)最后使用requests调用API。
(4)将响应对象赋给变量r。
(5)status_code核实调用是否成功,若值为200,则成功。
(6)使用方法json()将这些信息转换为一个python字典
2.处理响应字典
keys()方法返回一个视图对象,是动态的,是只读的。
若list(keys),则可生成一个列表。
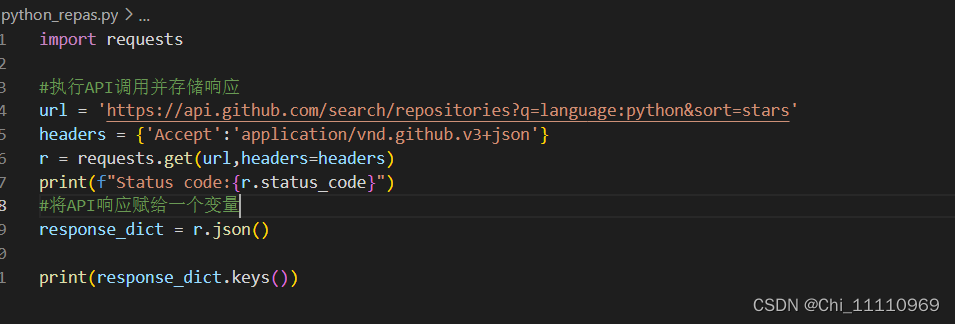
import requests
#执行API调用并存储响应
url = 'https://api.github.com/search/repositories?q=language:python&sort=stars'
headers = {'Accept':'application/vnd.github.v3+json'}
r = requests.get(url,headers=headers)
print(f"Status code:{r.status_code}")
#将API响应赋给一个变量
response_dict = r.json()
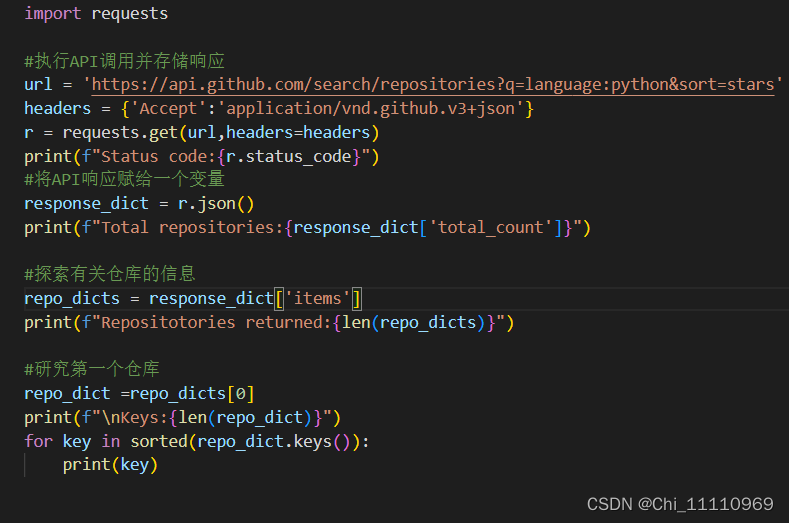
print(f"Total repositories:{response_dict['total_count']}")
#探索有关仓库的信息
repo_dicts = response_dict['items']
print(f"Repositotories returned:{len(repo_dicts)}")
#研究第一个仓库
repo_dict =repo_dicts[0]
print(f"\nKeys:{len(repo_dict)}")
for key in sorted(repo_dict.keys()):
print(key)
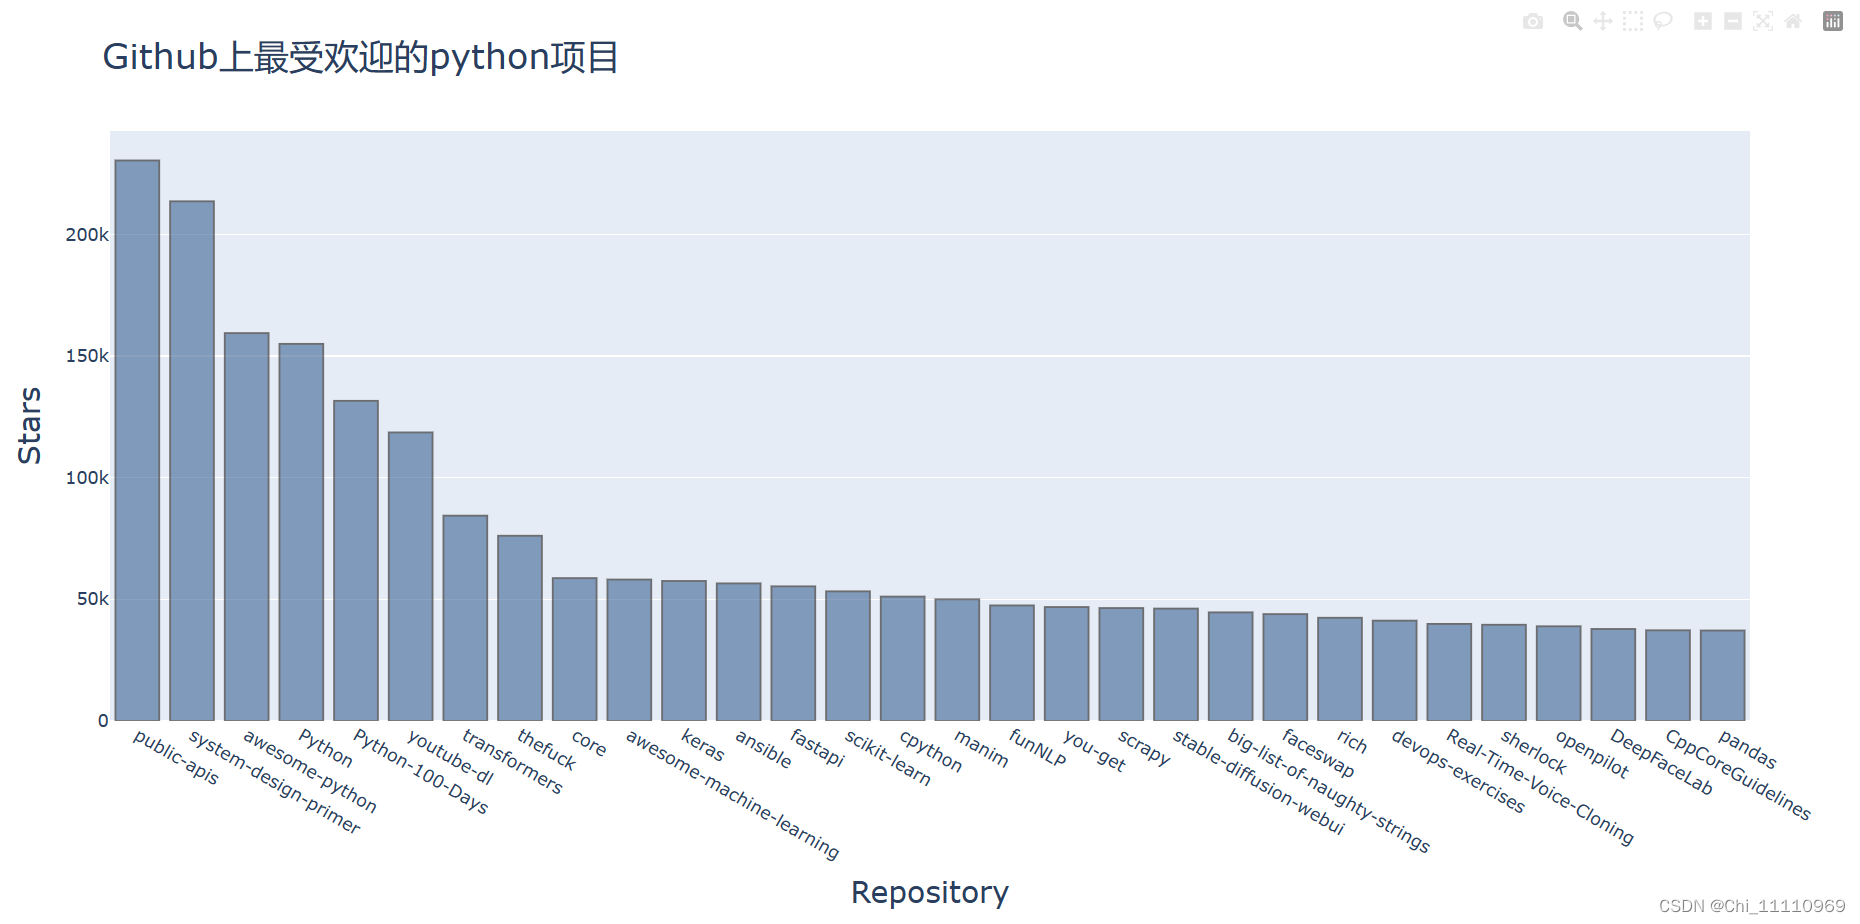
二、利用plotly可视化仓库(repository)
这一部分主要是看代码了。
1.收集仓库的相关信息。
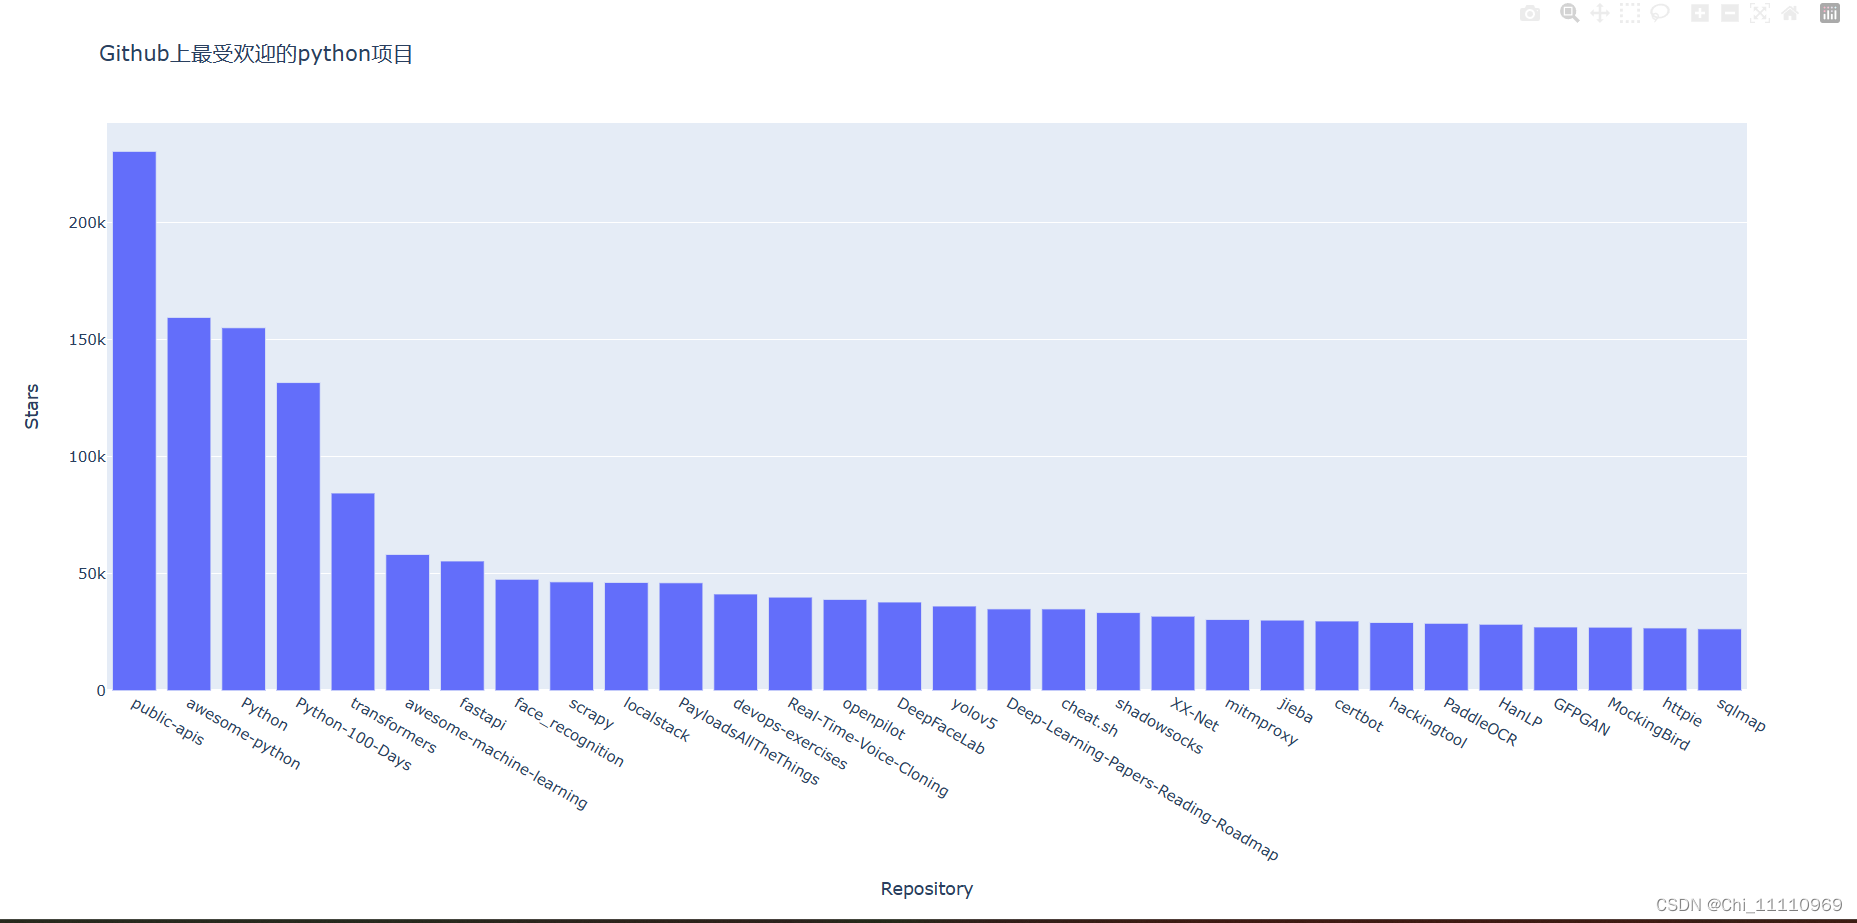
2.制图
3.改进图表
修改了字体大小,加入了边框,以及换了条形的颜色。
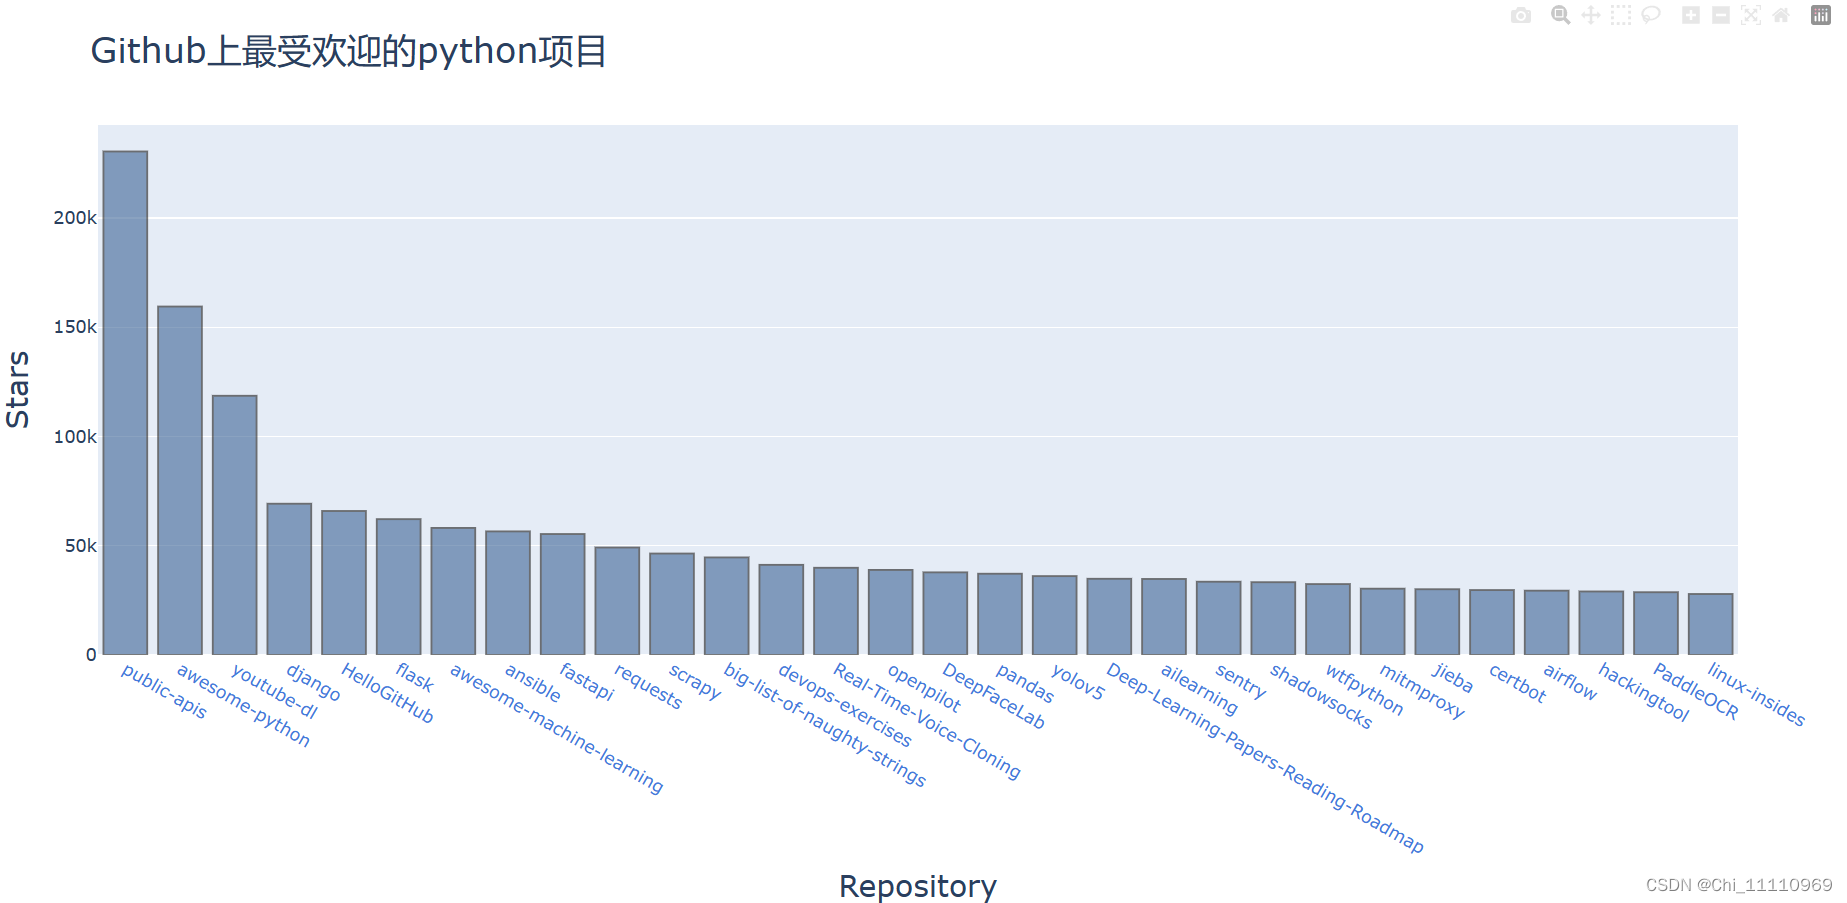
4.在图表中添加可单机的链接
x轴可点击,直接跳转到github页面
import requests
from plotly import offline
from plotly.graph_objs import Bar
#执行API调用并存储响应
url = 'https://api.github.com/search/repositories?q=language:python&sort=stars'
headers = {'Accept':'application/vnd.github.v3+json'}
r = requests.get(url,headers=headers)
#将API响应赋给一个变量
response_dict = r.json()
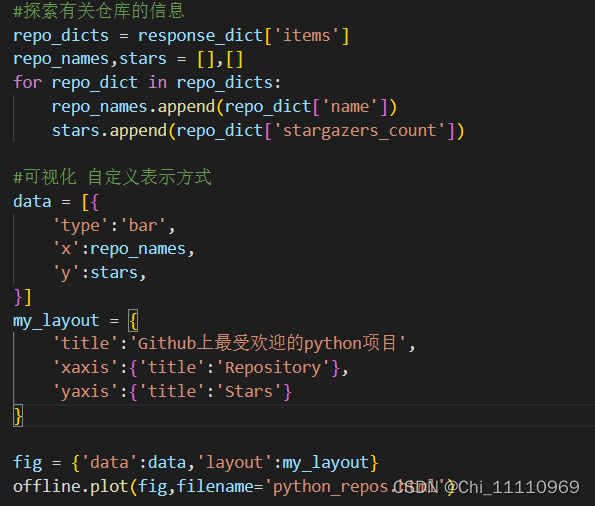
#探索有关仓库的信息
repo_dicts = response_dict['items']
stars,repo_links = [],[]
for repo_dict in repo_dicts:
repo_url = repo_dict['html_url']
repo_name = repo_dict['name']
repo_link = f"<a href='{repo_url}'>{repo_name}</a>"
repo_links.append(repo_link)
stars.append(repo_dict['stargazers_count'])
# owner = repo_dict['owner']['login']
# description = repo_dict['description']
# label = f"{owner}<br />{description}"
# print(label)
# labels.append(label)
#可视化 自定义表示方式
data = [{
'type':'bar',
'x':repo_links,
'y':stars,
'marker':{
'color':'rgb(60,100,150)',
'line':{'width':1.5,'color':'rgb(25,25,25)'}
},
'opacity':0.6,#透明度
}]
my_layout = {
'title':'Github上最受欢迎的python项目',
'titlefont':{'size':28},
'xaxis':{
'title':'Repository',
'titlefont':{'size':24},
'tickfont':{'size':14}
},
'yaxis':{
'title':'Stars',
'titlefont':{'size':24},
'tickfont':{'size':14},
},
}
fig = {'data':data,'layout':my_layout}
offline.plot(fig,filename='python_repos.html')
有个问题还没解决,就是鼠标悬停在条形上无法显示相关信息,就是注释掉的代码。


 1663
1663


 被折叠的 条评论
为什么被折叠?
被折叠的 条评论
为什么被折叠?
 到【灌水乐园】发言


