PR曲线、ROC曲线的原理以及在python的实现

一、PR曲线

1.1PR曲线的原理

PR曲线(Precision-Recall Curve)是一种常用的分类模型评估工具,用于衡量二元分类模型的性能。PR曲线的横坐标为召回率(Recall),纵坐标为查准率(Precision)。

召回率是指所有真实正例中被模型正确预测为正例的比例,计算公式为:Recall=TP/(FN+TP)​。

查准率是指查准率是指所有被模型预测为正例的样本中真正为正例的比例,计算公式为:Precision=TP/(FP+TP)​。其中,TP 代表真正例,FP 代表假正例,FN 代表假反例。

举一个简单的例子:

假设我们有一个样本,其中有10个人,5个人患有某种疾病,5个人没有。现在我们使用一种新的检测方法来检测这种疾病,结果如下表所示:

实际情况检测结果
患病患病
患病患病
患病患病
患病未患病
患病未患病
未患病患病
未患病未患病
未患病未患病
未患病未患病
未患病未患病

其中,实际情况中的“患病”表示该人真正患有该种疾病,“未患病”表示该人没有该种疾病;检测结果中的“患病”表示该人被检测出来为有该种疾病,“未患病”表示该人被检测出来为没有该种疾病。

根据上表,我们可以得到以下数据:

  • TP(True Positive):3,即实际情况为“患病”,并且被检测出来为“患病”的人数。
  • FP(False Positive):2,即实际情况为“未患病”,但被检测出来为“患病”的人数。
  • TN(True Negative):3,即实际情况为“未患病”,并且被检测出来为“未患病”的人数。
  • FN(False Negative):2,即实际情况为“患病”,但被检测出来为“未患病”的人数。

召回率(Recall)是指所有真实正例中被模型正确预测为正例的比例。在这个例子中,召回率等于TP/(TP+FN)=3/(3+2)=0.6。

查准率(Precision)是指所有被模型预测为正例的样本中真正为正例的比例。在这个例子中,查准率等于TP/(TP+FP)=3/(3+2)=0.6。

因此,在这个例子中,召回率和查准率都是0.6。这意味着我们的模型能够正确地识别出60%的真实正例,并且在所有预测为正例的样本中有60%是真正的正例。

1.2 PR曲线的绘制(python实现)

import numpy as np
from sklearn.metrics import precision_recall_curve
import matplotlib.pyplot as plt

# 生成随机数据集
y_true = np.random.randint(0, 2, size=1000)
y_scores = np.random.rand(1000)

# 计算PR曲线的值

TP = np.cumsum(y_true == 1 )
FP = np.cumsum(y_true == 0 )
precision = TP/(TP+FP)
recall = TP/np.sum(y_true)


# 绘制PR曲线
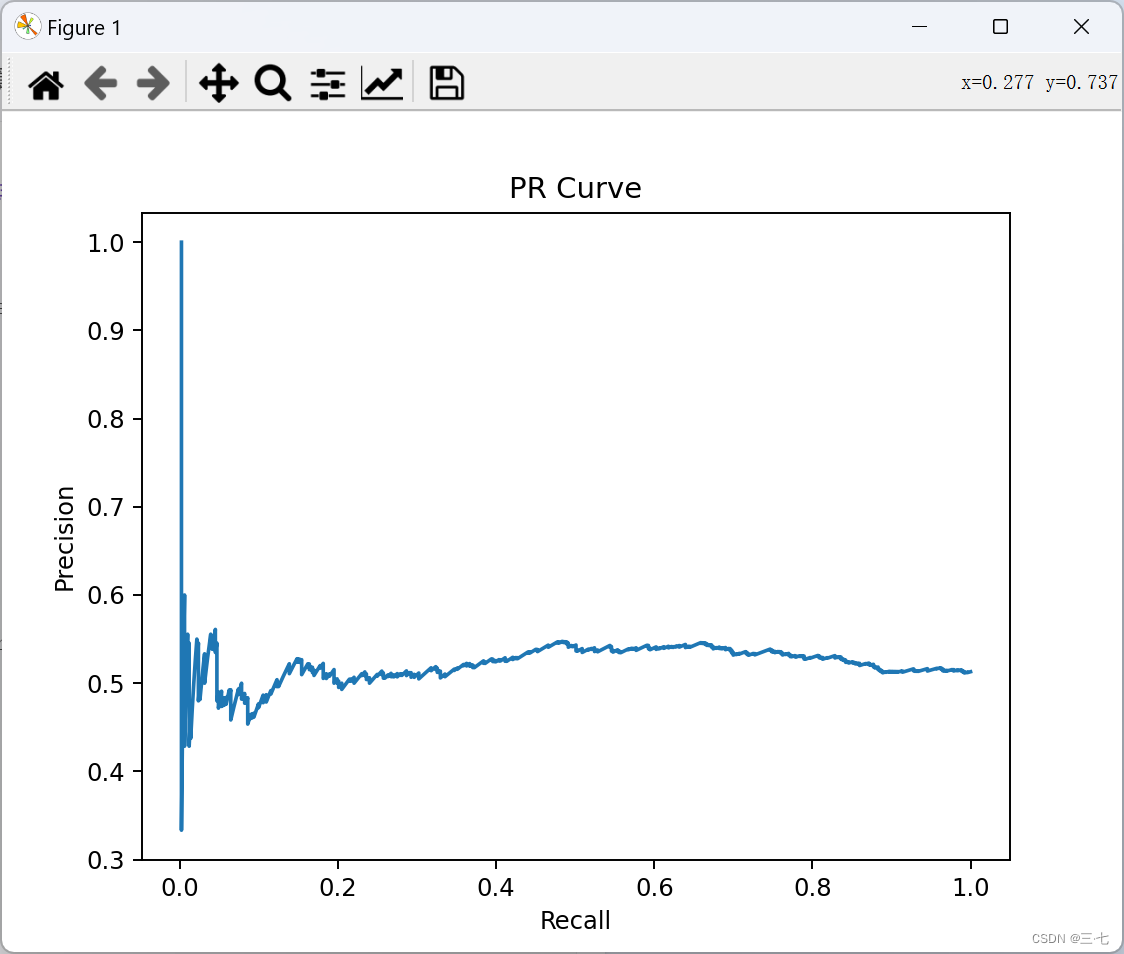
plt.plot(recall, precision)
plt.xlabel('Recall')
plt.ylabel('Precision')
plt.title('PR Curve')
plt.show()

运行结果: 

二、ROC曲线

2.1 ROC曲线的原理

ROC曲线(受试者工作特征曲线)是一种坐标图式的分析工具,用于选择最佳的信号检测模型、捨棄次佳的模型或者在同一模型中设定最佳阈值。

   ROC曲线以两个重要的性能指标为基础:真正例率(True Positive Rate, TPR)和假正例率(False Positive Rate, FPR)。

真正例率(True Positive Rate,TPR)是指在所有实际为正例的样本中,被模型正确预测为正例的比例,计算公式为:TPR=TP/(FN+TP)​。

假正例率(False Positive Rate,FPR)是指在所有实际为负例的样本中,被模型错误地预测为正例的比例,计算公式为:FPR=FP/(TN+FP​)。

其中,FP 表示假正例(False Positive)的样本数,即被分类器错误地预测为正例的样本数;TN 表示真负例(True Negative)的样本数,即被分类器正确预测为负例的样本数,FN 表示假反例(False Negative)的样本数,即被分类器错误地预测为负例的样本数。

同样地,我们再以上面的例子作为

实际情况检测结果
患病患病
患病患病
患病患病
患病未患病
患病未患病
未患病患病
未患病未患病
未患病未患病
未患病未患病
未患病未患病

根据该表格,我们能得到:

  • TP(True Positive):3,即实际情况为“患病”,并且被检测出来为“患病”的人数。
  • FP(False Positive):2,即实际情况为“未患病”,但被检测出来为“患病”的人数。
  • TN(True Negative):3,即实际情况为“未患病”,并且被检测出来为“未患病”的人数。
  • FN(False Negative):2,即实际情况为“患病”,但被检测出来为“未患病”的人数。

真正例率(True Positive Rate,TPR):TPR=TP/(FN+TP)​=3/(2+3)=0.6

假正例率(False Positive Rate,FPR):FPR=FP/(TN+FP​)=2/(3+2)=0.4

2.1 ROC曲线的实现

from sklearn.datasets import make_classification
from sklearn.model_selection import train_test_split
from sklearn.linear_model import LogisticRegression
from sklearn.metrics import roc_curve, roc_auc_score
import matplotlib.pyplot as plt

#生成随机数据集
X, y = make_classification(n_samples=1000, n_classes=2, random_state=42)

#将数据集拆分为训练集和测试集
X_train, X_test, y_train, y_test = train_test_split(X, y, test_size=0.3, random_state=42)

#训练逻辑回归模型
logreg = LogisticRegression()
logreg.fit(X_train, y_train)

#预测测试集的概率
y_pred_proba = logreg.predict_proba(X_test)[:, 1]

#计算ROC曲线和AUC评分
fpr, tpr, thresholds = roc_curve(y_test, y_pred_proba)
roc_auc = roc_auc_score(y_test, y_pred_proba)
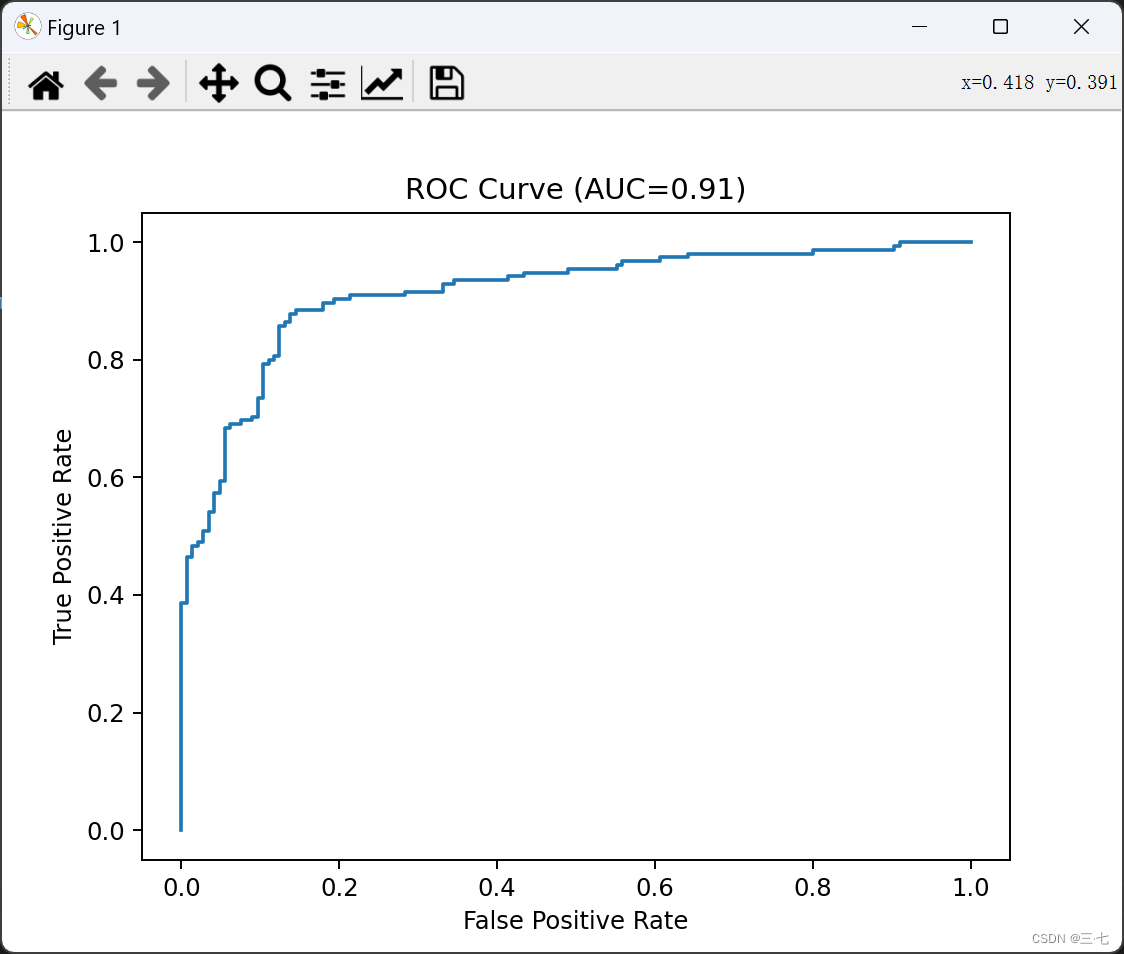
#绘制ROC曲线
plt.plot(fpr, tpr)
plt.xlabel('False Positive Rate')
plt.ylabel('True Positive Rate')
plt.title(f'ROC Curve (AUC={roc_auc:.2f})')
plt.show()

运行结果:

三、实验总结

ROC曲线和PR曲线都是评价分类模型的性能的常用工具。

ROC曲线(Receiver Operating Characteristic)以真正率(True Positive Rate)为纵坐标,假正率(False Positive Rate)为横坐标,描述了正负样本判定阈值的变化如何影响分类器的性能。ROC曲线可以直观地展示出不同阈值下分类器的性能,同时考虑到了真正率和假正率之间的平衡关系,适用于正负样本不平衡的情况。ROC曲线下面积(AUC)越大,分类器性能越好。

PR曲线(Precision-Recall Curve)以精度(Precision)为纵坐标,召回率(Recall)为横坐标,描述了在不同召回率下的精确度表现。PR曲线更加关注正例样本分类的准确性,因此在正负例样本不平衡或者负例样本很多时比ROC曲线更能反映分类器的性能,但是对于负例样本的正确识别能力则没有ROC曲线全面。PR曲线下面积(AP)可以认为是在各个召回率下的精确度的平均,也就是整个预测结果的平均质量。

一般来说,ROC曲线和PR曲线的选择要根据问题背景来确定。当正负样本比例相近时,可以优先采用ROC曲线;当正负样本不平衡时或者对于正例的判定更加重要时,可以优先采用PR曲线。同时,我们可以结合AUC和AP两个指标来进行综合评价。

  • 0
    点赞
  • 6
    收藏
    觉得还不错? 一键收藏
  • 0
    评论
下面是一个使用Python实现Accuracy类、F1度量类、P-R曲线类、ROC曲线类和AUC类的示例代码: ```python import matplotlib.pyplot as plt class Accuracy: def __init__(self, y_true, y_pred): self.y_true = y_true self.y_pred = y_pred def accuracy_score(self): correct = sum([1 for yt, yp in zip(self.y_true, self.y_pred) if yt == yp]) total = len(self.y_true) accuracy = correct / total return accuracy class F1Score: def __init__(self, y_true, y_pred): self.y_true = y_true self.y_pred = y_pred def precision_recall_f1(self): true_positives = sum([1 for yt, yp in zip(self.y_true, self.y_pred) if yt == 1 and yp == 1]) false_positives = sum([1 for yt, yp in zip(self.y_true, self.y_pred) if yt == 0 and yp == 1]) false_negatives = sum([1 for yt, yp in zip(self.y_true, self.y_pred) if yt == 1 and yp == 0]) precision = true_positives / (true_positives + false_positives) if (true_positives + false_positives) > 0 else 0 recall = true_positives / (true_positives + false_negatives) if (true_positives + false_negatives) > 0 else 0 f1_score = 2 * (precision * recall) / (precision + recall) if (precision + recall) > 0 else 0 return precision, recall, f1_score class PRCurve: def __init__(self, y_true, y_scores): self.y_true = y_true self.y_scores = y_scores def precision_recall_curve(self): thresholds = sorted(set(self.y_scores), reverse=True) precisions = [] recalls = [] for threshold in thresholds: y_pred = [1 if score >= threshold else 0 for score in self.y_scores] true_positives = sum([1 for yt, yp in zip(self.y_true, y_pred) if yt == 1 and yp == 1]) false_positives = sum([1 for yt, yp in zip(self.y_true, y_pred) if yt == 0 and yp == 1]) false_negatives = sum([1 for yt, yp in zip(self.y_true, y_pred) if yt == 1 and yp == 0]) precision = true_positives / (true_positives + false_positives) if (true_positives + false_positives) > 0 else 0 recall = true_positives / (true_positives + false_negatives) if (true_positives + false_negatives) > 0 else 0 precisions.append(precision) recalls.append(recall) return precisions, recalls class ROCCurve: def __init__(self, y_true, y_scores): self.y_true = y_true self.y_scores = y_scores def roc_curve(self): thresholds = sorted(set(self.y_scores), reverse=True) tpr_values = [] fpr_values = [] num_positive_cases = sum([1 for yt in self.y_true if yt == 1]) num_negative_cases = sum([1 for yt in self.y_true if yt == 0]) for threshold in thresholds: y_pred = [1 if score >= threshold else 0 for score in self.y_scores] true_positives = sum([1 for yt, yp in zip(self.y_true, y_pred) if yt == 1 and yp == 1]) false_positives = sum([1 for yt, yp in zip(self.y_true, y_pred) if yt == 0 and yp == 1]) tpr = true_positives / num_positive_cases if num_positive_cases > 0 else 0 fpr = false_positives / num_negative_cases if num_negative_cases > 0 else 0 tpr_values.append(tpr) fpr_values.append(fpr) return tpr_values, fpr_values class AUC: def __init__(self, tpr, fpr): self.tpr = tpr self.fpr = fpr def auc_score(self): auc = 0 for i in range(1, len(self.fpr)): auc += (self.fpr[i] - self.fpr[i-1]) * (self.tpr[i] + self.tpr[i-1]) / 2 return auc # 示例数据 y_true = [1, 0, 1, 1, 0, 0, 1] y_scores = [0.9, 0.6, 0.8, 0.7, 0.4, 0.3, 0.5] # 计算并输出准确率 accuracy = Accuracy(y_true, y_scores) acc = accuracy.accuracy_score() print("Accuracy:", acc) # 计算并输出精确率、召回率和F1度量 f1_score = F1Score(y_true, y_scores) precision, recall, f1 = f1_score.precision_recall_f1() print("Precision:", precision) print("Recall:", recall) print("F1 Score:", f1) # 计算并绘制P-R曲线 pr_curve = PRCurve(y_true, y_scores) precisions, recalls = pr_curve.precision_recall_curve() plt.plot(recalls, precisions) plt.xlabel('Recall') plt.ylabel('Precision') plt.title('P-R Curve') plt.show() # 计算并绘制ROC曲线 roc_curve = ROCCurve(y_true, y_scores) tpr_values, fpr_values = roc_curve.roc_curve() plt.plot(fpr_values, tpr_values) plt.xlabel('False Positive Rate') plt.ylabel('True Positive Rate') plt.title('ROC Curve') plt.show() # 计算并输出AUC auc = AUC(tpr_values, fpr_values) auc_score = auc.auc_score() print("AUC Score:", auc_score) ``` 这段代码展示了如何实现Accuracy类、F1度量类、P-R曲线类、ROC曲线类和AUC类。你可以根据你的实际需求进行修改和优化。

“相关推荐”对你有帮助么?

  • 非常没帮助
  • 没帮助
  • 一般
  • 有帮助
  • 非常有帮助
提交
评论
添加红包

请填写红包祝福语或标题

红包个数最小为10个

红包金额最低5元

当前余额3.43前往充值 >
需支付:10.00
成就一亿技术人!
领取后你会自动成为博主和红包主的粉丝 规则
hope_wisdom
发出的红包
实付
使用余额支付
点击重新获取
扫码支付
钱包余额 0

抵扣说明:

1.余额是钱包充值的虚拟货币,按照1:1的比例进行支付金额的抵扣。
2.余额无法直接购买下载,可以购买VIP、付费专栏及课程。

余额充值