


1.数据(.js)
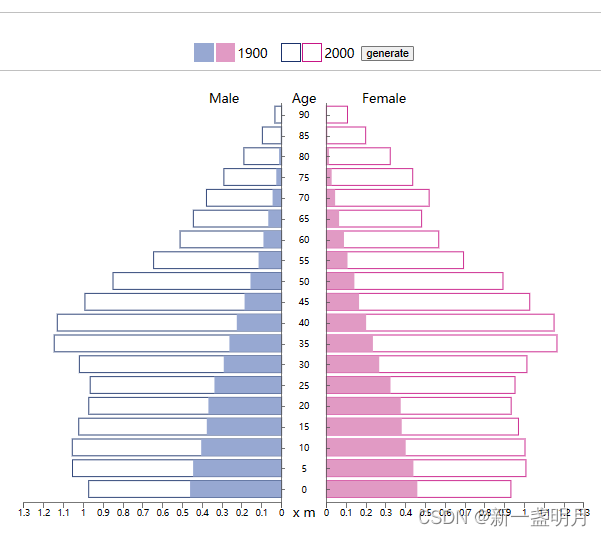
1900和2000两年的美国人口数据,字段名为性别、年份、年龄、人口数
PopulationData=[
    {"sex": 1, "year": 1900, "age": 0, "people": 4619544},
    {"sex": 1, "year": 2000, "age": 0, "people": 9735380},
    {"sex": 1, "year": 1900, "age": 5, "people": 4465783},
    {"sex": 1, "year": 2000, "age": 5, "people": 10552146},
    {"sex": 1, "year": 1900, "age": 10, "people": 4057669},
    {"sex": 1, "year": 2000, "age": 10, "people": 10563233},
    {"sex": 1, "year": 1900, "age": 15, "people": 3774846},
    {"sex": 1, "year": 2000, "age": 15, "people": 10237419},
    {"sex": 1, "year": 1900, "age": 20, "people": 3694038},
    {"sex": 1, "year": 2000, "age": 20, "people": 9731315},
    {"sex": 1, "year": 1900, "age": 25, "people": 3389280},
    {"sex": 1, "year": 2000, "age": 25, "people": 9659493},
    {"sex": 1, "year": 1900, "age": 30, "people": 2918964},
    {"sex": 1, "year": 2000, "age": 30, "people": 10205879},
    {"sex": 1, "year": 1900, "age": 35, "people": 2633883},
    {"sex": 1, "year": 2000, "age": 35, "people": 11475182},
    {"sex": 1, "year": 1900, "age": 40, "people": 2261070},
    {"sex": 1, "year": 2000, "age": 40, "people": 11320252},
    {"sex": 1, "year": 1900, "age": 45, "people": 1868413},
    {"sex": 1, "year": 2000, "age": 45, "people": 9925006},
    {"sex": 1, "year": 1900, "age": 50, "people": 1571038},
    {"sex": 1, "year": 2000, "age": 50, "people": 8507934},
    {"sex": 1, "year": 1900, "age": 55, "people": 1161908},
    {"sex": 1, "year": 2000, "age": 55, "people": 6459082},
    {"sex": 1, "year": 1900, "age": 60, "people": 916571},
    {"sex": 1, "year": 2000, "age": 60, "people": 5123399},
    {"sex": 1, "year": 1900, "age": 65, "people": 672663},
    {"sex": 1, "year": 2000, "age": 65, "people": 4453623},
    {"sex": 1, "year": 1900, "age": 70, "people": 454747},
    {"sex": 1, "year": 2000, "age": 70, "people": 3792145},
    {"sex": 1, "year": 1900, "age": 75, "people": 268211},
    {"sex": 1, "year": 2000, "age": 75, "people": 2912655},
    {"sex": 1, "year": 1900, "age": 80, "people": 127435},
    {"sex": 1, "year": 2000, "age": 80, "people": 1902638},
    {"sex": 1, "year": 1900, "age": 85, "people": 44008},
    {"sex": 1, "year": 2000, "age": 85, "people": 970357},
    {"sex": 1, "year": 1900, "age": 90, "people": 15164},
    {"sex": 1, "year": 2000, "age": 90, "people": 336303},
    {"sex": 2, "year": 1900, "age": 0, "people": 4589196},
    {"sex": 2, "year": 2000, "age": 0, "people": 9310714},
    {"sex": 2, "year": 1900, "age": 5, "people": 4390483},
    {"sex": 2, "year": 2000, "age": 5, "people": 10069564},
    {"sex": 2, "year": 1900, "age": 10, "people": 4001749},
    {"sex": 2, "year": 2000, "age": 10, "people": 10022524},
    {"sex": 2, "year": 1900, "age": 15, "people": 3801743},
    {"sex": 2, "year": 2000, "age": 15, "people": 9692669},
    {"sex": 2, "year": 1900, "age": 20, "people": 3751061},
    {"sex": 2, "year": 2000, "age": 20, "people": 9324244},
    {"sex": 2, "year": 1900, "age": 25, "people": 3236056},
    {"sex": 2, "year": 2000, "age": 25, "people": 9518507},
    {"sex": 2, "year": 1900, "age": 30, "people": 2665174},
    {"sex": 2, "year": 2000, "age": 30, "people": 10119296},
    {"sex": 2, "year": 1900, "age": 35, "people": 2347737},
    {"sex": 2, "year": 2000, "age": 35, "people": 11635647},
    {"sex": 2, "year": 1900, "age": 40, "people": 2004987},
    {"sex": 2, "year": 2000, "age": 40, "people": 11488578},
    {"sex": 2, "year": 1900, "age": 45, "people": 1648025},
    {"sex": 2, "year": 2000, "age": 45, "people": 10261253},
    {"sex": 2, "year": 1900, "age": 50, "people": 1411981},
    {"sex": 2, "year": 2000, "age": 50, "people": 8911133},
    {"sex": 2, "year": 1900, "age": 55, "people": 1064632},
    {"sex": 2, "year": 2000, "age": 55, "people": 6921268},
    {"sex": 2, "year": 1900, "age": 60, "people": 887508},
    {"sex": 2, "year": 2000, "age": 60, "people": 5668961},
    {"sex": 2, "year": 1900, "age": 65, "people": 640212},
    {"sex": 2, "year": 2000, "age": 65, "people": 4804784},
    {"sex": 2, "year": 1900, "age": 70, "people": 440007},
    {"sex": 2, "year": 2000, "age": 70, "people": 5184855},
    {"sex": 2, "year": 1900, "age": 75, "people": 265879},
    {"sex": 2, "year": 2000, "age": 75, "people": 4355644},
    {"sex": 2, "year": 1900, "age": 80, "people": 132449},
    {"sex": 2, "year": 2000, "age": 80, "people": 3221898},
    {"sex": 2, "year": 1900, "age": 85, "people": 48614},
    {"sex": 2, "year": 2000, "age": 85, "people": 1981156},
    {"sex": 2, "year": 1900, "age": 90, "people": 20093},
    {"sex": 2, "year": 2000, "age": 90, "people": 1064581}
]
2.代码:
<!DOCTYPE html>
<html>
<head>
<meta charset="UTF-8">
<meta name="viewport" content="width=device-width, initial-scale=1.0">
<meta name="description" content="Population Pyramid of American in 1900 and 2000" />
<script src="https://d3js.org/d3.v3.min.js"></script>
<script src="census2000.js"></script>
<title>Population Pyramid</title>
<style id="jsbin-css">/*定义css样式*/
svg {
border: 0px solid #ccc;
display:block;
margin:0 auto;
}
.axis line,
.axis path {
shape-rendering: crispEdges;
fill: transparent;
stroke: #555;
}
.axis text {
font-size: 11px;
}
.bar.left {
fill: white;
stroke: #1a316b;
stroke-width: 1;
}
.bar.right {
fill: white;
stroke: #c71585;
stroke-width: 1;
}
.bar.left2 {
fill: #97a8d2;
}
.bar.right2 {
fill: #e19ac4;
}
div.tooltip {
position: absolute;
text-align: center;
width: 150px;
height: 36px;
padding: 2px;
font: 12px sans-serif;
background: silver;
border: 1px;
border-radius: 8px;
}
</style>
</head>
<body>
<h1 align="center"><strong>How did the age structure of the gender-specific population change from 1900 to 2000?</strong> </h1>
<fieldset style="display:block;">
<legend style="font-size: 25px;">图例</legend>
<p style="display:incline">
<table border="0" cellpadding="1" cellspacing="1" align="center">
<tbody>
<tr>
<td></td>
<td style="width: 20px; background-color: rgb(151, 168, 210); ; border: 2px solid #97a8d2;"></td>
<td></td>
<td style="width: 20px; background-color: rgb(225, 154, 196); ; border: 2px solid #e19ac4;"></td>
<td></td>
<td>1900</td>
<td></td>
<td></td>
<td></td>
<td></td>
<td></td>
<td></td>
<td></td>
<td></td>
<td style="width: 20px; border: 2px solid #1a316b;"></td>
<td></td>
<td style="width: 20px; border: 2px solid #c71585; "></td>
<td></td>
<td>2000</td>
<td></td>
<td></td>
<td></td>
<td> <button onclick="generatePopulation()">generate</button> </td>
</tr>
</tbody>
</table>
</fieldset>
<div style="height:20px;"></div>
<script id="jsbin-javascript">
//数据获取
function inter()
{
generatePopulation();
}
function generatePopulation()
{
//删除第一个svg元素
d3.select('svg').remove();
//初始化和设置维度
var w=700,
h=500;
//设置各种边距
var margin = {
top: 20,
right: 20,
bottom: 24,
left: 20,
middle: 28// margin.middle是中心线到Y轴的距离
};
//图形柱子的宽度
var regionWidth = w/2 - margin.middle;
//存储y轴的x坐标
var pointA = regionWidth,
pointB = w - regionWidth;
//调用getPopulation函数来获取1900和2000人口数据
var exampleData = getPopulation1900();
var exampleData2 = getPopulation2000();
//console.log(exampleData);
//得到总人口数目,创建函数,返回百分比
var totalPopulation = d3.sum(exampleData, function(d) { return d; }),
percentage = function(d) { return d/10000000; };
var totalPopulation2 = d3.sum(exampleData2, function(d) { return d; }),
percentage2 = function(d) { return d/10000000; };
//创建svg
var svg=d3.select('body')
.append('svg')
.attr('width',margin.left+w+margin.right)
.attr('height',margin.top+h+margin.bottom)
.append('g')
.attr('transform',translation(margin.left,margin.top))
//找到每个条形的最大值
//最大值为x轴共享
var dataSex1900=get1900();
//console.log(dataSex1900);
var dataSex2000=get2000();
var maxValue = d3.max(dataSex1900, function(d) { return d.people/10000000; });
var maxValue2 = d3.max(dataSex2000, function(d) { return d.people/10000000; });
//设定scale
var xScale=d3.scale.linear()
.domain([0,1.18])
.range([0,regionWidth])
.nice();
var xScaleLeft=d3.scale.linear()
.domain([0,1.18])
.range([regionWidth,0]);
var xScaleRight=d3.scale.linear()
.domain([0,1.18])
.range([0,regionWidth]);
var yScale=d3.scale.ordinal()//序数比例尺
.domain(exampleData.map(function(d){return d.age;}))
.rangeRoundBands([h,0],0.1);
//设定轴
var yAxisLeft=d3.svg.axis()
.scale(yScale)
.orient('right')
.tickSize(4,0)
.tickPadding(margin.middle-4);
var yAxisRight=d3.svg.axis()
.scale(yScale)
.orient('right')
.tickSize(4,0)
.tickFormat('');
var xAxisRight = d3.svg.axis()
.scale(xScale)
.orient('bottom')
.tickFormat(d3.format('#'));
var xAxisLeft = d3.svg.axis()
// 通过将值域反转,可以实现X轴在左侧的反向绘制。
.scale(xScale.copy().range([pointA, 0]))
.orient('bottom')//坐标轴的方向为底部
.tickFormat(d3.format('#'));//指定了刻度标签的格式化函数,将刻度的数值格式化为整数形式。
var div = d3.select("body")//选择body元素
.append("div") // body内创建div元素
.attr("class", "tooltip") //为div元素添加名为tooltip的类 用于定义工具提示的样式
.style("opacity", 0); //将透明度设为0
//分别创建两侧条形的group
//scale(-1,1)对坐标系进行了反转,使左侧的柱状图向左增长,而不是向右增长。
var leftBarGroup = svg.append('g')
.attr('transform', translation(pointA, 0) + 'scale(-1,1)');
var rightBarGroup = svg.append('g')
.attr('transform', translation(pointB, 0));
//画出轴
svg.append('g')
.attr('class', 'axis y left')
.attr('transform', translation(pointA, 0))
.call(yAxisLeft)
.selectAll('text')
.style('text-anchor', 'middle');
svg.append('g')
.attr('class', 'axis y right')
.attr('transform', translation(pointB, 0))
.call(yAxisRight);
svg.append('g')
.attr('class', 'axis x left')
.attr('transform', translation(0, h))
.call(xAxisLeft);
svg.append('g')
.attr('class', 'axis x right')
.attr('transform', translation(pointB, h))
.call(xAxisRight);
//画出条形
leftBarGroup.selectAll('.bar.left')
.data(getMale2000())
.enter().append('rect')
.attr('class', 'bar left')
.attr('x', 0)
.attr('y', function(d) { return yScale(d.age); })
.attr('width', function(d) {
return xScale(percentage(d.people));
})
.attr('height', yScale.rangeBand()-2)
.on("mouseover", function(d) {
div.transition()
.duration(200)
.style("opacity", 0.9);
div .html(gethtmlContorno(d))
.style("left", (d3.event.pageX) + "px")
.style("top", (d3.event.pageY - 28) + "px");
d3.select(this).attr("x", 0).style("fill", "#97a8d2");})
.on("mouseout", function(d) {
div.transition()
.duration(500)
.style("opacity", 0);
d3.select(this).attr("x", 0).style("fill", "white");});
rightBarGroup.selectAll('.bar.right')
.data(getFemale2000())
.enter().append('rect')
.attr('class', 'bar right')
.attr('x', 0)
.attr('y', function(d) { return yScale(d.age); })
.attr('width', function(d) {
//console.log(percentage(d.people));
return xScale(percentage(d.people)); })
.attr('height', yScale.rangeBand()-2)
.on("mouseover", function(d) {
div.transition()
.duration(200)
.style("opacity", 0.9);
div .html(gethtmlContorno(d))
.style("left", (d3.event.pageX) + "px")
.style("top", (d3.event.pageY - 28) + "px");
d3.select(this).attr("x", 0).style("fill", "#e19ac4");})
.on("mouseout", function(d) {
div.transition()
.duration(500)
.style("opacity", 0);
d3.select(this).attr("x", 0).style("fill", "white");});
leftBarGroup.selectAll('.bar.left2')
.data(getMale1900)
.enter().append('rect')
.attr('class', 'bar left2')
.attr('x', 0)
.attr('y', function(d) { return yScale(d.age); })
.attr('width', function(d) {
//console.log(percentage(d.people));
return xScale(percentage(d.people)); })
.attr('height', yScale.rangeBand()-2)
.on("mouseover", function(d) {
div.transition()
.duration(200)
.style("opacity", 0.9);
div .html(gethtmlRelleno(d))
.style("left", (d3.event.pageX) + "px")
.style("top", (d3.event.pageY - 28) + "px");
d3.select(this).attr("x", 0).style("fill", "#1a316b");
})
.on("mouseout", function(d) {
div.transition()
.duration(500)
.style("opacity", 0);
d3.select(this).attr("x", 0).style("fill", "#97a8d2");});
rightBarGroup.selectAll('.bar.right2')
.data(getFemale1900)
.enter().append('rect')
.attr('class', 'bar right2')
.attr('x', 0)
.attr('y', function(d) { return yScale(d.age); })
.attr('width', function(d) { return xScale(percentage(d.people)); })
.attr('height', yScale.rangeBand()-2)
.on("mouseover", function(d) {
div.transition()
.duration(200)
.style("opacity", 0.9);
div .html(gethtmlRelleno(d))
.style("left", (d3.event.pageX) + "px")
.style("top", (d3.event.pageY - 28) + "px");
d3.select(this).attr("x", 0).style("fill", "#c71585");})
.on("mouseout", function(d) {
div.transition()
.duration(500)
.style("opacity", 0);
d3.select(this).attr("x", 0).style("fill", "#e19ac4");});
svg.append("text")
.attr("x", w /2 )
.attr("y", 0 )
.style("text-anchor", "middle")
.text("Age");
svg.append("text")
.attr("x", w /2 )
.attr("y", h + 17 )
.style("text-anchor", "middle")
.text(" x m");//人数 单位:百万
svg.append("text")
.attr("x", (w /2)-100 )
.attr("y", 0 )
.style("text-anchor", "middle")
.text("Male");
svg.append("text")
.attr("x", (w /2)+100 )
.attr("y", 0 )
.style("text-anchor", "middle")
.text("Female");
}
function translation(x,y) {//转换xy为可以初始化svg元素的字符串,xy是坐标
return 'translate(' + x + ',' + y + ')';
}
function getPopulation1900()//选出特定年份的数据
{
var exampleData=[];
var data=PopulationData;
exampleData = data.filter(function(d) { return d.year==1900; });
//console.log(exampleData);
return exampleData;
}
function getPopulation2000()//选出特定年份的数据
{
var exampleData=[];
var data=PopulationData;
exampleData = data.filter(function(d) { return d.year==2000; });
return exampleData;
}
function getMale1900()
{
var exampleData=[];
var data=getPopulation1900();
exampleData=data.filter(function(d){return d.sex==1});
return exampleData;
}
function getFemale1900()
{
var exampleData=getPopulation1900();
var data=exampleData.filter(function(d){return d.sex==2});
return data;
}
function getMale2000()
{
var exampleData=getPopulation2000();
var data=exampleData.filter(function(d){return d.sex==1});
return data;
}
function getFemale2000()
{
var exampleData=getPopulation2000();
var data=exampleData.filter(function(d){return d.sex==2});
return data;
}
function get1900()
{
var nestedData=getPopulation1900();
// 使用 D3 的 nest 函数按年龄和性别对数据进行分组,并计算总和
nestedData=d3.nest()
.key(function(d){return d.age;})//首先按照年龄分组
.key(function(d){return d.sex;})//其次按照性别分组
.rollup(function(v) { return d3.sum(v, function(d) { return d.people; }); })
.entries(nestedData);
//console.log(nestedData);
// 将嵌套数据转换为扁平数组,以便于计算最大和最小值
var flattenedData = nestedData.map(function(ageGroup) {
return ageGroup.values.map(function(sexGroup) {
return {
age: ageGroup.key,
sex: sexGroup.key,
people: sexGroup.values
};
});
}).flat();
console.log(flattenedData);
return flattenedData;
}
function get2000()
{
var nestedData=getPopulation2000();
// 使用 D3 的 nest 函数按年龄和性别对数据进行分组,并计算总和
nestedData=d3.nest()
.key(function(d){return d.age;})//首先按照年龄分组
.key(function(d){return d.sex;})//其次按照性别分组
.rollup(function(v) { return d3.sum(v, function(d) { return d.people; }); })
.entries(nestedData);
// 将嵌套数据转换为扁平数组,以便于计算最大和最小值
var flattenedData = nestedData.map(function(ageGroup) {
return ageGroup.values.map(function(sexGroup) {
return {
age: ageGroup.key,
sex: sexGroup.key,
people: sexGroup.value
};
});
}).flat();
return flattenedData;
}
function gethtmlContorno(d)
{
var htmldata = '<table border="0" cellpadding="1" cellspacing="1" style="width: 150px;"><tbody><tr><td style="width: 20px; border: 2px solid #1a316b;"> </td><td style="width: 50px;">Hombres</td><td style="width: 70px;">'+addCommas(d.male)+'</td></tr><tr><td style="width: 20px; border: 2px solid #c71585; "> </td><td style="width: 50px;">Mujeres</td><td>'+addCommas(d.female)+'</td></tr></tbody></table>';
return htmldata;
}
function gethtmlRelleno(d)
{
var htmldata = '<table border="0" cellpadding="1" cellspacing="1" style="width: 150px;"> <tbody> <tr> <td style="width: 20px; background-color: rgb(151, 168, 210);"> </td> <td style="width: 50px;">Male</td> <td style="width: 70px;">'+addCommas(d.male)+'</td> </tr> <tr> <td style="width: 20px; background-color: rgb(225, 154, 196); "> </td><td style="width: 50px;">Female</td> <td>'+addCommas(d.female)+'</td> </tr> </tbody> </table>';
return htmldata;
}
function addCommas(nStr)
{
nStr += '';
x = nStr.split('.');
x1 = x[0];
x2 = x.length > 1 ? '.' + x[1] : '';
var rgx = /(\d+)(\d{3})/;
while (rgx.test(x1)) {
x1 = x1.replace(rgx, '$1' + ',' + '$2');
}
return x1 + x2;
}
</script>
</body>
</html>
3.结果:


 4273
4273


 被折叠的 条评论
为什么被折叠?
被折叠的 条评论
为什么被折叠?
 到【灌水乐园】发言


