


echarts绘制3D地图实现平移、缩放
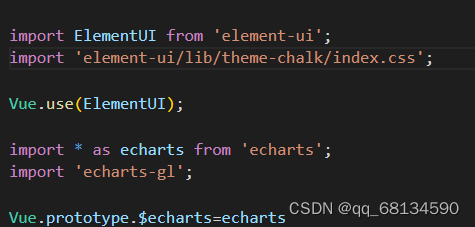
所需依赖
![]()
准备工作:main.js中引入依赖
先上图

代码直接复制粘贴就可以使用了,根据自己需求稍作修改就可以使用了
html代码部分
 <div class="map">
      <div id="3Dmap" class="main"></div>
  </div>
js代码部分
 var myChart = this.$echarts.init(document.getElementById("3Dmap"));
      this.$echarts.registerMap("haerbin", haerbin);

      var _this = this;
      this.option = {
        tooltip: {
          show: true,
          triggerOn: "mousemove", //鼠标hover地图区域时出现
          trigger: "item",
          transitionDuration: 0, //直接出现提示框
          formatter: function (params) {
            // console.log(params,'params')
            //返回的是dom结构,可以在这里写好样式,也可以使用下面的配置项去设置样式
            return `<div style="position:absolute;left:10px;top:16px;width:8px;height:8px;background-color:#FD9A5A;"></div>
                        <div class="tips" style="padding:12px;">
                            <h1 style="font-size:16px;">${params.name}</h1>
                            <p style="font-size:16px;">
                                <span style="color:#03dbf3;font-size:30px;display:inline-block;padding:5px 0">${params.data.num}</span>
                            </p>
                        </div>`;
          },
          //这里就是设置地图自带的弹框样式
          borderColor: "#419bf9",
          borderWidth: 1,
          //   padding: [0, 15],
          // backgroundColor: '#0a1d54',
          backgroundColor: "rgba(0,2,89,0.8)",
          borderRadius: 0,
          textStyle: { color: "#fff" },
        },
        series: [
          {
            // name: "haerbin",
            type: "map3D", //需要使用3d地图
            // type: 'map',
            map: "haerbin", //地图类型。echarts-gl 中使用的地图类型同 geo 组件相同
            regionHeight: 3, //模型的高度
            boxWidth: 70, //三维地图在三维场景中的宽度
            boxDepth: 73, //三维地图在三维场景中的深度
            top: "-15%",
            itemStyle: {
              normal: {
                //静态模式下显示的默认样式
                borderColor: "#3f82e5",
                borderWidth: 2,
                // color: "#0a55ea",
                color: "rgba(8, 72, 197, 0.4)",//建议使用rgba设置透明度,使用opacity会导致文字变色
                // opacity: 0.4,
              }, //阴影效果
              emphasis: {
                // color:'#3f82e5',#0636A2
                color: "#0a55ea",
                // opacity:0.5,
                label: {
                  show: true,
                },
              },
            },
            label: {
              show: true,
              fontSize: 18,
              formatter: (params) => {
                var str = params.data.name;
                // return params.data.name + "\n\n\n" + params.data.num;
                if (params.data.name == "平房区") {
                  //   return  str= "<div style='width:10px;height:10px;border-radius:50%;color:#fff'>"+1+"</div>";
                  return (str = "①");
                }
                if (params.data.name == "香坊区") {
                  return (str = "②");
                }
                if (params.data.name == "南岗区") {
                  return (str = "③");
                }
                if (params.data.name == "道外区") {
                  return (str = "④");
                }
                if (params.data.name == "道里区") {
                  return (str = "⑤");
                }
                return str;
              },
              textStyle: {
                color: "white",
              },
            },
            viewControl: {
              minBeta: -360,
              maxBeta: 360,
              alpha: 50,
              center: [0, -10, -10], //位置点
              distance: 100, //缩放比例,默认视角距离主体的距离,对于 globe 来说是距离地球表面的距离,对于 grid3D 和 geo3D 等其它组件来说是距离中心原点的距离。在 projection 为'perspective'的时候有效。
              minDistance: 30,
              maxDistance: 140,
              panMouseButton: "left",
              rotateMouseButton: "middle",
              zoomSensitivity: 1,
              // autoRotate: true, //是否开启视角绕物体的自动旋转查看,可开启自行测试

            },
            data: this.list,
          },
        ],
      };

      myChart.setOption(this.option);
绘制3D地图可能会引起地图上标注点,跟所需点有偏差的情况,这样需要去修改引用的json文件

地图json数据可以到DataV.GeoAtlas地理小工具系列下载或引用即可


 5665
5665


 被折叠的 条评论
为什么被折叠?
被折叠的 条评论
为什么被折叠?
 到【灌水乐园】发言


