


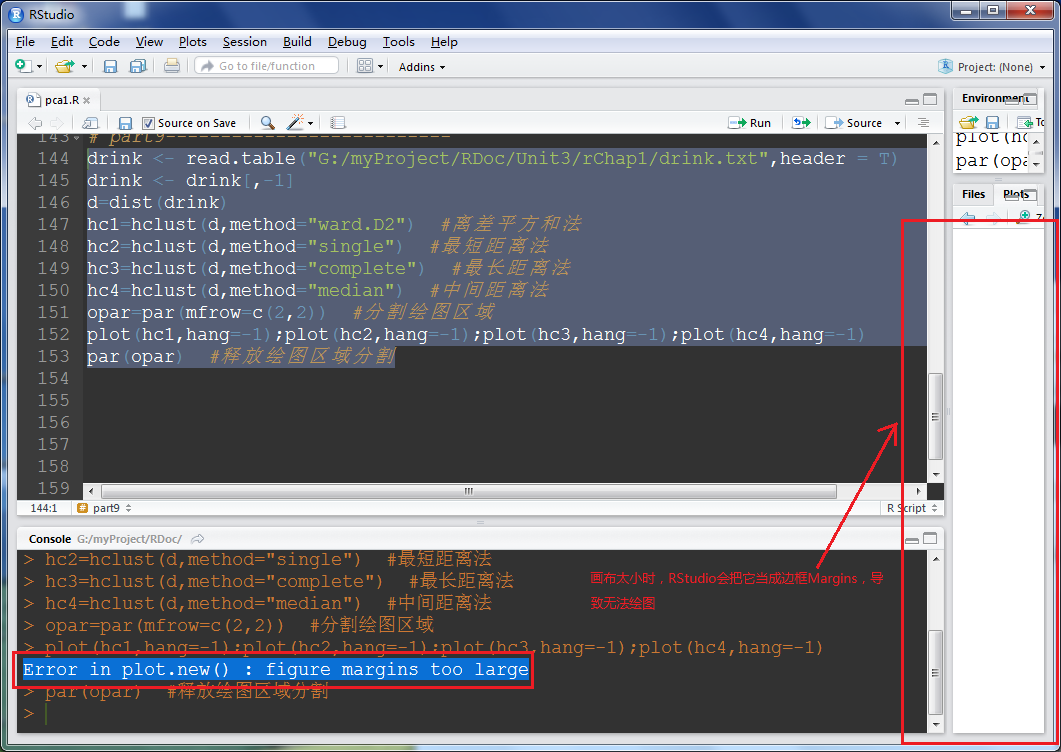
在RStudio中使用plot()函数进行画图时,常出现“plot.new() : figure margins too large”问题。如图(1)所示。
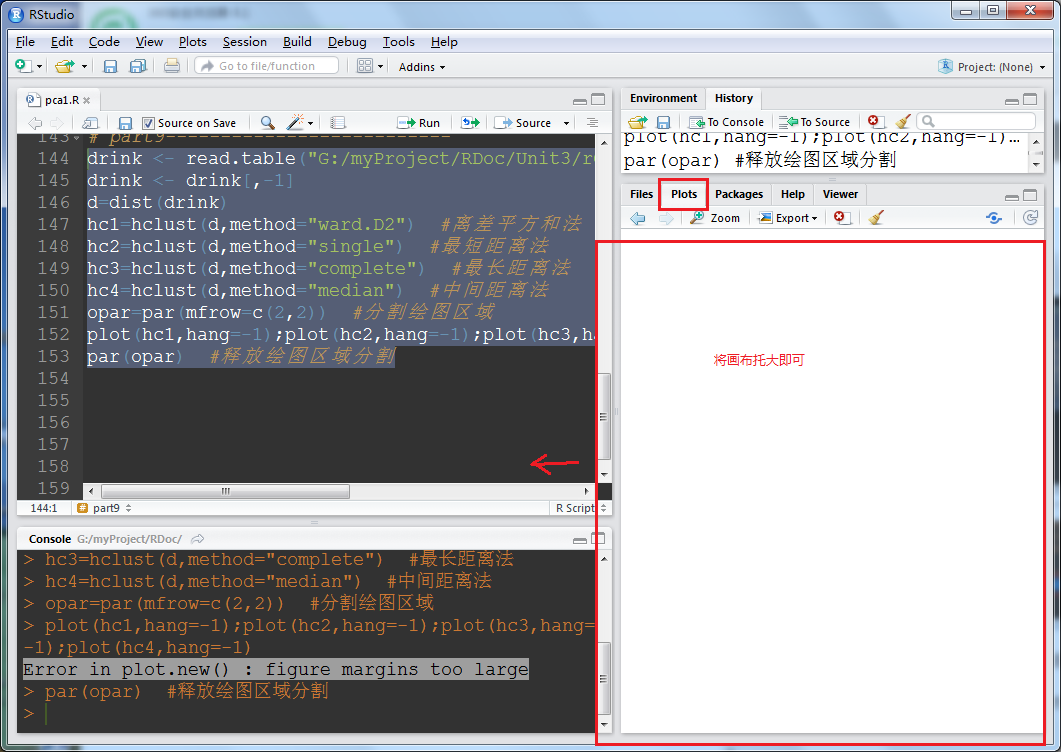
出现该问题的原因是,RStudio里的【Plots】窗口太小,可以适当调大一点,或者把RStudio设置为全屏。解决步骤如下。
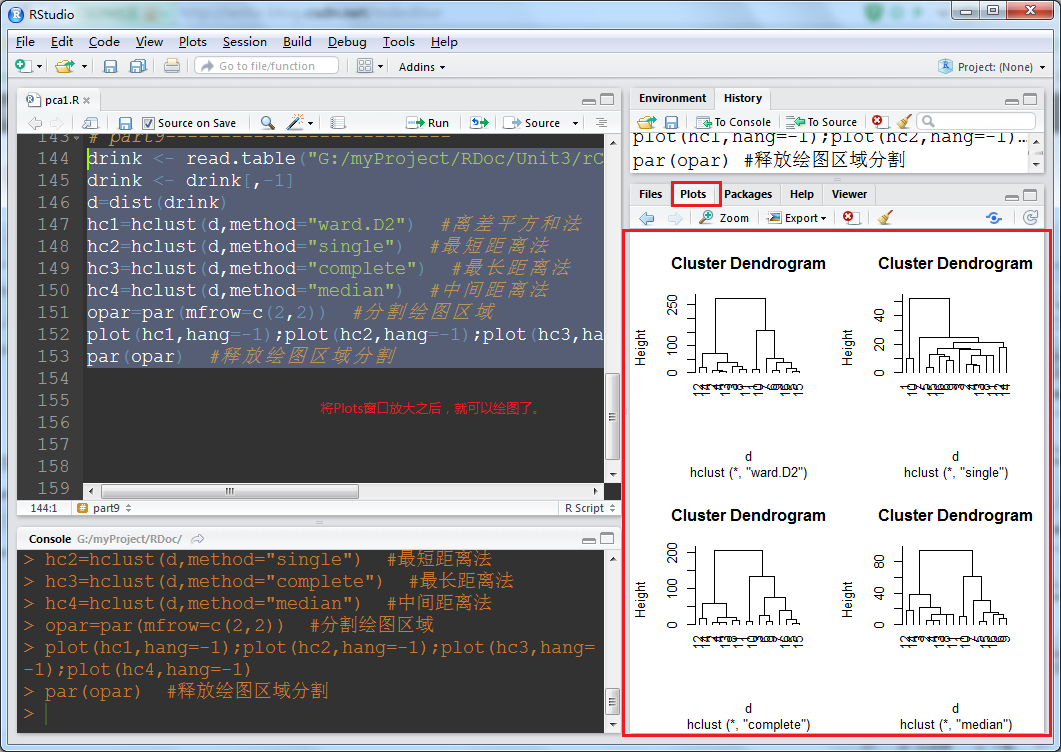
1.用鼠标选中【Plots】选项卡,然后把该窗口拖大一点即可,如图(2)所示。
2. 测试代码
//数据源 drink.txt
index   heat    caffeine    Na  price
1   207.2   3.3 15.5    2.8
2   36.8    5.9 12.9    3.3
3   72.2    7.3 8.2 2.4
4   36.7    0.4 10.5    4.0
5   121.7   4.1 9.2 3.5
6   89.1    4.0 10.2    3.3
7   146.7   4.3 9.7 1.8
8   57.6    2.2 13.6    2.1
9   95.9    0.0 8.5 1.3
10  199.0   0.0 10.6    3.5
11  49.8    8.0 6.3 3.7
12  16.6    4.7 6.3 1.5
13  38.5    3.7 7.7 2.0
14  0.0 4.2 13.1    2.2
15  118.8   4.7 7.2 4.1
16  107.0   0.0 8.3 4.2
//ceshi.R
drink <- read.table("G:/myProject/RDoc/Unit3/rChap1/drink.txt",header = T)
drink <- drink[,-1]
d=dist(drink)
hc1=hclust(d,method="ward.D2")  #离差平方和法
hc2=hclust(d,method="single")  #最短距离法
hc3=hclust(d,method="complete")  #最长距离法
hc4=hclust(d,method="median")  #中间距离法
opar=par(mfrow=c(2,2))  #分割绘图区域
plot(hc1,hang=-1);plot(hc2,hang=-1);plot(hc3,hang=-1);plot(hc4,hang=-1)
par(opar)  #释放绘图区域分割
效果如下:


 731
731

 被折叠的 条评论
为什么被折叠?
被折叠的 条评论
为什么被折叠?
 到【灌水乐园】发言


