


 这篇博客讨论了如何在Seaborn的分布图中添加垂直线并将其图例整合到现有图例中。作者通过示例代码展示了如何使用`axvline`添加垂直线,并通过获取图的艺术品(artists)来创建图例,确保图例正确显示。问题涉及到图例对齐和如何避免手动调整以实现自动化。
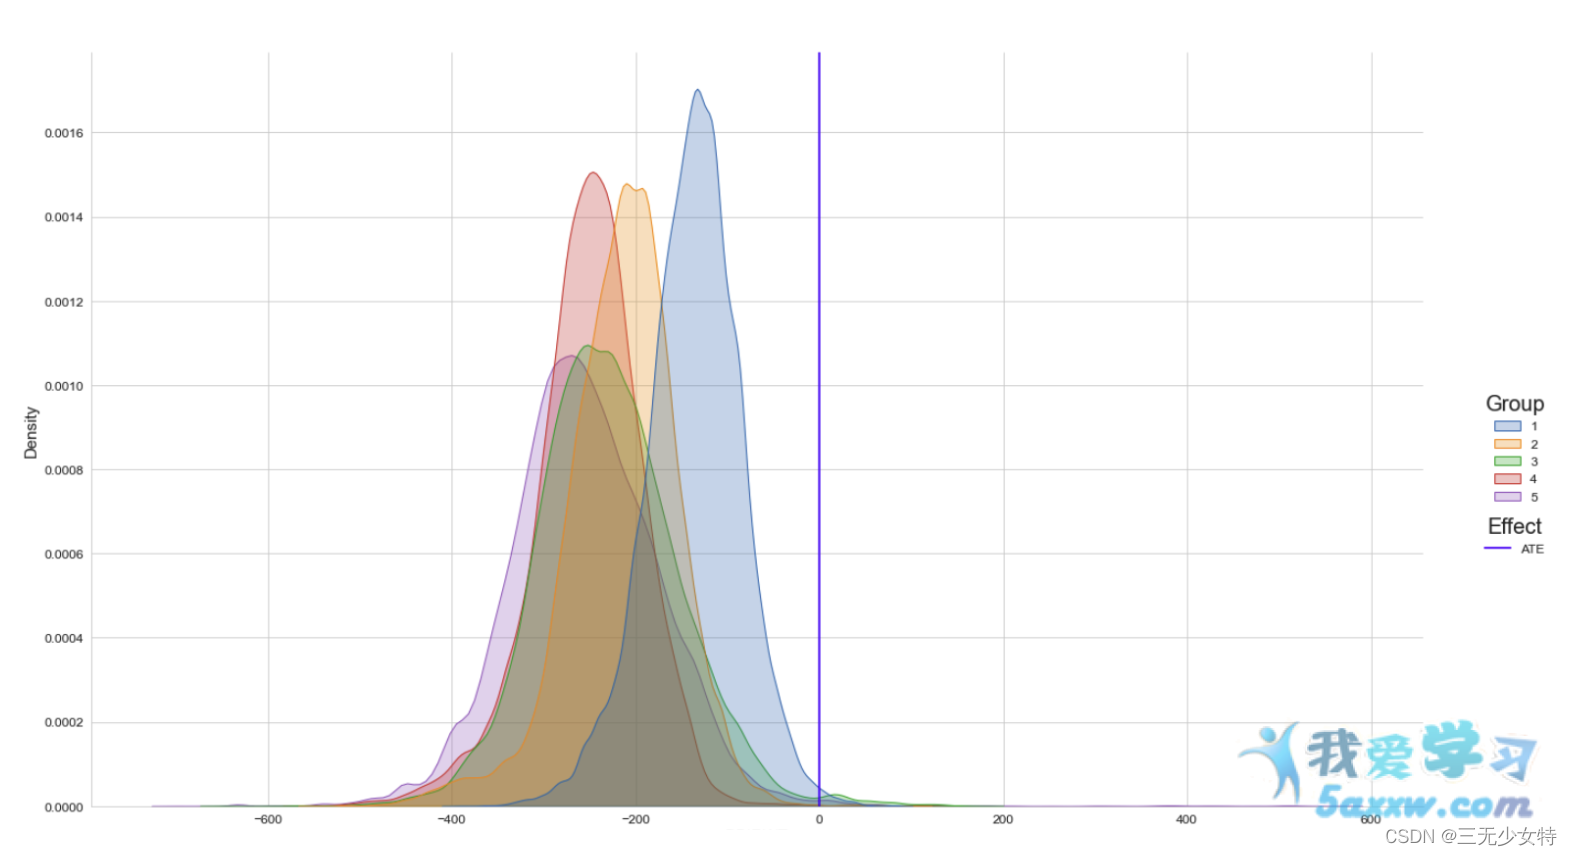
我通过组成员身份创建覆盖分布图,使用
gfg = sns.displot(hist_dat, x="Outcome", hue="Group", kind="kde", fill = True,
                  palette="tab10", height=10.5, aspect=18.5/10.5, legend=True)
gfg._legend.set_title("Group")
plt.setp(gfg._legend.get_title(), fontsize=20)
现在,我在绘图中添加一条垂直线,并想在图例中添加这条线的条目。我能找到的解决办法是
plt.axvline(x = 0, color = 'b', label = 'ATE')
plt.legend(bbox_to_anchor= (1.1,0.4), frameon=False, title="Effect",
              title_fontsize=20)
要对齐图例,我必须手动调整它们。是否有更直接的方法添加ATE图例条目-例如在现有图例中?非常感谢!
Result:
发布于 3 月前
回答
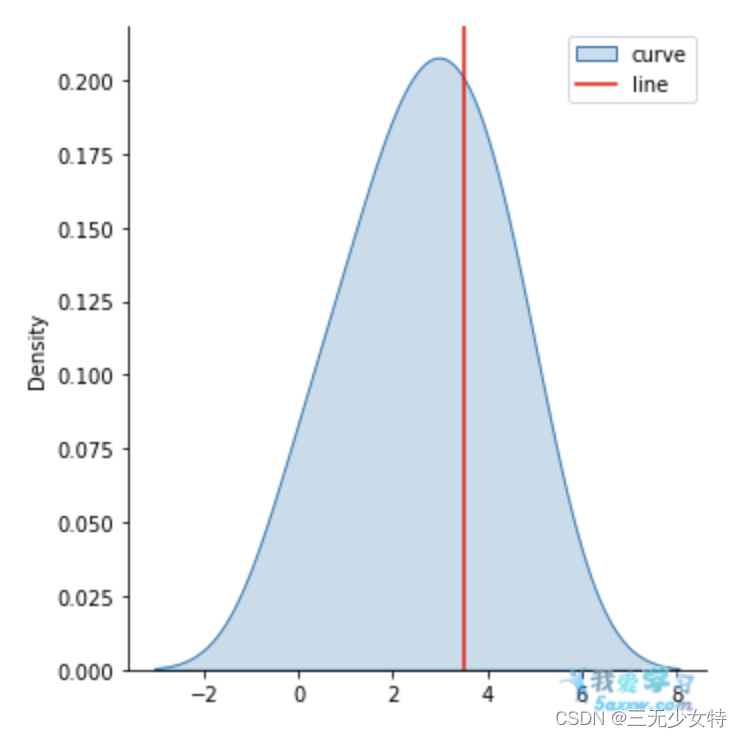
编辑:使用填充时,不会得到线条。我的错。稍微更改了代码。
为此,需要为图例参数指定句柄和标签。我发现获得PolyCollection艺术家的方法是使用ax.get_children()。然后,您调用plt.legend(handles, labels)。以下是一个玩具示例:
sns.displot([0, 1, 2, 2, 3, 3, 4, 4, 5], legend=True, kind='kde', label='test', fill=True)
children = plt.gca().get_children()
l = plt.axvline(3.5, c='r')
plt.legend([children[0], l], ['curve', 'line'] )
发布于 3 月前
回答
编辑:使用填充时,不会得到线条。我的错。稍微更改了代码。
为此,需要为图例参数指定句柄和标签。我发现获得PolyCollection艺术家的方法是使用ax.get_children()。然后,您调用plt.legend(handles, labels)。以下是一个玩具示例:
sns.displot([0, 1, 2, 2, 3, 3, 4, 4, 5], legend=True, kind='kde', label='test', fill=True)
children = plt.gca().get_children()
l = plt.axvline(3.5, c='r')
plt.legend([children[0], l], ['curve', 'line'] )


 6894
6894

 被折叠的 条评论
为什么被折叠?
被折叠的 条评论
为什么被折叠?
 到【灌水乐园】发言


