


 本文介绍了两种在QCustomPlot上实现鼠标悬停时显示点坐标值的方法:一是通过信号槽机制,二是通过继承QCustomPlot并重写mouseMoveEvent函数。在每个方法中,都详细阐述了获取鼠标位置、坐标转换、判断点是否在曲线附近以及显示工具提示的过程。这两种方法都能实现在鼠标移动时实时显示光标所在点的坐标信息。
有两种方法可实现这个效果:
1.通过关联QCustomPlot的mouseMove信号槽事件实现;
2.通过继承QCustomPlot类,重写mouseMove虚函数实现;
这个两个方法都是获取鼠标位置,然后计算出点的坐标值,利用QToolTip显示点坐标的方法。
方向弄清楚了,现在我们去实现出来,go……
一、信号槽方法
1、首先建立一个鼠标移动时间响应函数:
private slots:
	void MyMouseMoveEvent(QMouseEvent *event);
2、将槽函数MyMouseMoveEvent与QCustomPlot的mouseMove信号建立连接。
Plus,这里推荐基于qt5的信号槽连接,因为编译时,基于qt4的connect不会检查信号和槽的参数以及槽函数正确与否,而基于qt5的connect会有这一个检查过程(原来遇见过基于qt4的槽函数没有响应的情况)。
connect(m_pHistoryPlot, &QCustomPlot::mouseMove, this, &HistoryDataView::MyMouseMoveEvent);
3、槽函数实现光标划过曲线显示点坐标功能。
代码有详细注释,这里就不详细讲解。
void HistoryDataView::MyMouseMoveEvent(QMouseEvent* event)
{
    if (m_pHistoryPlot->graphCount() == 0)
	{
		return;
	}

	//获取鼠标坐标,相对父窗体坐标
	int x_pos = event->pos().x();
	int y_pos = event->pos().y();

	//鼠标坐标转化为CustomPlot内部坐标
	float x_val = m_pHistoryPlot->xAxis->pixelToCoord(x_pos);
	float y_val = m_pHistoryPlot->yAxis->pixelToCoord(y_pos);

	//通过坐标轴范围判断光标是否在点附近
	float x_begin = m_pHistoryPlot->xAxis->range().lower;
	float x_end = m_pHistoryPlot->xAxis->range().upper;
	float y_begin = m_pHistoryPlot->yAxis->range().lower;
	float y_end = m_pHistoryPlot->yAxis->range().upper;
	float x_tolerate = (x_end - x_begin) / 40;//光标与最近点距离在此范围内,便显示该最近点的值
	float y_tolerate = (y_end - y_begin) / 40;

	//判断有没有超出坐标轴范围
	if (x_val < x_begin || x_val > x_end)
	{
		return;
	}

	//通过x值查找离曲线最近的一个key值索引
	int index = 0;
	int index_left = m_pHistoryPlot->graph(0)->findBegin(x_val, true);//左边最近的一个key值索引
	int index_right = m_pHistoryPlot->graph(0)->findEnd(x_val, true);//右边
	float dif_left = fabs(m_pHistoryPlot->graph(0)->data()->at(index_left)->key - x_val);
	float dif_right = fabs(m_pHistoryPlot->graph(0)->data()->at(index_right)->key - x_val);
	index = ((dif_left < dif_right) ? index_left : index_right);

	double x_posval = m_pHistoryPlot->graph(0)->data()->at(index)->key;//通过得到的索引获取key值
	double y_posval = m_pHistoryPlot->graph(0)->data()->at(index)->value;//通过得到的索引获取value值

	float dx = fabs(x_posval - x_val);
	float dy = fabs(y_posval - y_val);

	int graphIndex = 0;//curve index closest to the cursor
	//通过遍历每条曲线在index处的value值,得到离光标点最近的value及对应曲线索引
	for (int i = 0, n = m_pHistoryPlot->xAxis->graphs().count(); i < n; i++)
	{
		y_posval = fabs(m_pHistoryPlot->graph(i)->data()->at(index)->value - y_val);
		if (y_posval < dy)
		{
			dy = y_posval;
			graphIndex = i;
		}
	}

	//判断光标点与最近点的距离是否在设定范围内
	if (dy <= y_tolerate && dx <= x_tolerate)
	{
		y_posval = m_pHistoryPlot->graph(graphIndex)->data()->at(index)->value;

		QString strToolTip = QString("CH%1 \nx=%2\ny=%3").arg(graphIndex + 1).arg(y_posval).arg(y_posval);

		QToolTip::showText(cursor().pos(), strToolTip, m_pHistoryPlot);
	}
}
4、最终效果
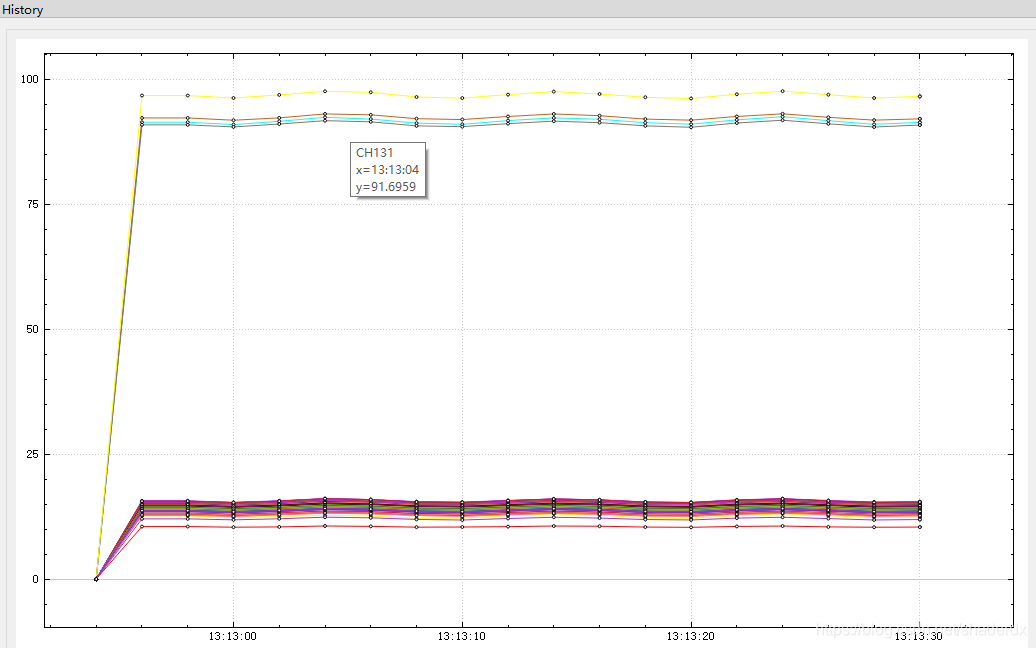
二、继承通过虚函数实现
1、继承QCustomPlot
class MyCustomPlot : public QCustomPlot
{
Q_OBJECT
public:
MyCustomPlot(QWidget *parent = 0);
protected:
virtual void mouseMoveEvent(QMouseEvent *event);
//……
}
2、重写虚函数
void MyCustomPlot::mouseMoveEvent(QMouseEvent *event)
{
    QCustomPlot::mouseMoveEvent(event);

    if(!m_isShowTracer)
    {
        return;
    }
    //获取鼠标坐标,相对父窗体坐标
	int x_pos = event->pos().x();
	int y_pos = event->pos().y();

	//鼠标坐标转化为CustomPlot内部坐标
	float x_val = m_pHistoryPlot->xAxis->pixelToCoord(x_pos);
	float y_val = m_pHistoryPlot->yAxis->pixelToCoord(y_pos);

	//通过坐标轴范围判断光标是否在点附近
	float x_begin = m_pHistoryPlot->xAxis->range().lower;
	float x_end = m_pHistoryPlot->xAxis->range().upper;
	float y_begin = m_pHistoryPlot->yAxis->range().lower;
	float y_end = m_pHistoryPlot->yAxis->range().upper;
	float x_tolerate = (x_end - x_begin) / 40;//光标与最近点距离在此范围内,便显示该最近点的值
	float y_tolerate = (y_end - y_begin) / 40;

	//判断有没有超出坐标轴范围
	if (x_val < x_begin || x_val > x_end)
	{
		return;
	}

	//通过x值查找离曲线最近的一个key值索引
	int index = 0;
	int index_left = m_pHistoryPlot->graph(0)->findBegin(x_val, true);//左边最近的一个key值索引
	int index_right = m_pHistoryPlot->graph(0)->findEnd(x_val, true);//右边
	float dif_left = fabs(m_pHistoryPlot->graph(0)->data()->at(index_left)->key - x_val);
	float dif_right = fabs(m_pHistoryPlot->graph(0)->data()->at(index_right)->key - x_val);
	index = ((dif_left < dif_right) ? index_left : index_right);

	double x_posval = m_pHistoryPlot->graph(0)->data()->at(index)->key;//通过得到的索引获取key值
	double y_posval = m_pHistoryPlot->graph(0)->data()->at(index)->value;//通过得到的索引获取value值

	float dx = fabs(x_posval - x_val);
	float dy = fabs(y_posval - y_val);

	int graphIndex = 0;//curve index closest to the cursor
	//通过遍历每条曲线在index处的value值,得到离光标点最近的value及对应曲线索引
	for (int i = 0, n = m_pHistoryPlot->xAxis->graphs().count(); i < n; i++)
	{
		y_posval = fabs(m_pHistoryPlot->graph(i)->data()->at(index)->value - y_val);
		if (y_posval < dy)
		{
			dy = y_posval;
			graphIndex = i;
		}
	}

	//判断光标点与最近点的距离是否在设定范围内
	if (dy <= y_tolerate && dx <= x_tolerate)
	{
		y_posval = m_pHistoryPlot->graph(graphIndex)->data()->at(index)->value;
		//QString strToolTip = QString("CH%1:(%2, %3)").arg(graphIndex + 1).arg(x_val).arg(y_val);
		int hor = x_posval / 3600;
		int tmp = (int)x_posval % 3600;
		int min = tmp / 60;
		int sec = tmp % 60;
		char arx[32] = { 0 };
		sprintf(arx, "%02d:%02d:%02d", hor, min, sec);
		QString strToolTip = QString("CH%1 \nx=%2\ny=%3").arg(graphIndex + 1).arg(arx).arg(y_posval);

		QToolTip::showText(cursor().pos(), strToolTip, m_pHistoryPlot);
	}

    this->replot();//曲线重绘
}
QT5下,使用QCustomPlot显示折线图和曲线图,鼠标滑过折线曲线跟随鼠标显示此时鼠标指向的点的x轴数值和y轴数值。


 1964
1964

 被折叠的 条评论
为什么被折叠?
被折叠的 条评论
为什么被折叠?
 到【灌水乐园】发言


