


 本文详细介绍了如何选择并部署Prometheus监控系统,包括背景、目标、选型理由、Prometheus功能、架构、关键组件如PrometheusServer、Exporter、AlertManager和PushGateway,以及环境准备、网络策略、部署步骤和验证方法。
监控搭建-Prometheus
1、背景
随着项目信息化进程的推进,操作系统、中间件、数据库的运维随着系统规模的扩大而指数级别提升,信息数据的监控在这个阶段显得尤为重要。俗话说:无监控、不运维,监控系统地位不言而喻。
2、目标
搭建一套监控系统对云服务器、数据库、中间件进行性能指标的有效话监控。
3、选型
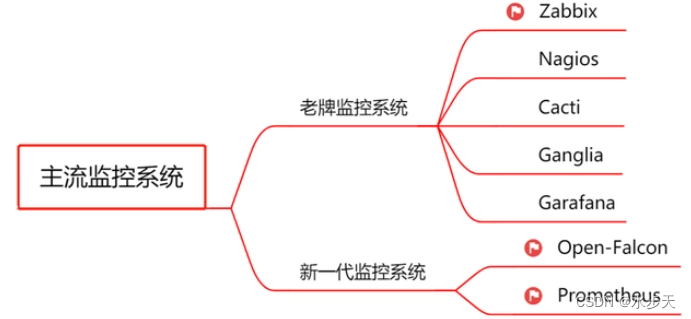
本着选新不选旧的原则,Prometheus
4、Prometheus
4.1、介绍
Prometheus 是一款基于时序数据库的开源监控告警系统,非常适合Kubernetes集群的监控。Prometheus的基本原理是通过HTTP协议周期性抓取被监控组件的状态,任意组件只要提供对应的HTTP接口就可以接入监控。不需要任何SDK或者其他的集成过程。这样做非常适合做虚拟化环境监控系统,比如VM、Docker、Kubernetes等。输出被监控组件信息的HTTP接口被叫做exporter 。目前互联网公司常用的组件大部分都有exporter可以直接使用,比如Varnish、Haproxy、Nginx、MySQL、Linux系统信息(包括磁盘、内存、CPU、网络等等)。Promethus有以下特点:
- 支持多维数据模型:由度量名和键值对组成的时间序列数据
- 内置时间序列数据库TSDB
- 支持PromQL查询语言,可以完成非常复杂的查询和分析,对图表展示和告警非常有意义
- 支持HTTP的Pull方式采集时间序列数据
- 支持PushGateway采集瞬时任务的数据
- 支持服务发现和静态配置两种方式发现目标
- 支持接入Grafana
4.2、架构
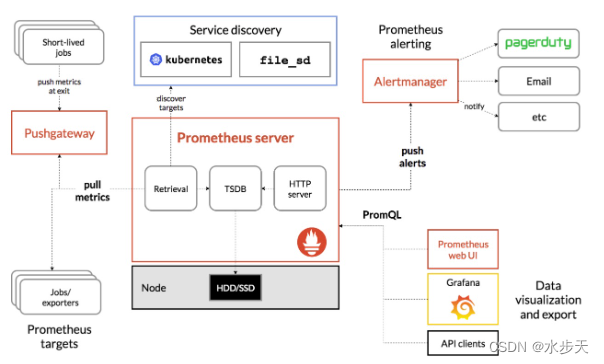
4.3、构件
prometheus server 是 Prometheus 组件中的核心部分,负责实现对监控数据的获取,存储以及查询。
exporter 简单说是采集端,通过 http 服务的形式保留一个 url 地址,prometheus server 通过 访问该 exporter 提供的 endpoint 端点,即可获取到需要采集的监控数据 。
AlertManager 在 prometheus 中,支持基于 PromQL 创建告警规则,如果满足定义的规则,则会产生一条 告警信息,进入 AlertManager 进行处理。可以集成邮件,微信或者通过 webhook 自定义报 警。
Pushgateway 由于 Prometheus 数据采集采用 pull 方式进行设置的, 内置必须保证 prometheus server 和 对应的 exporter 必须通信,当网络情况无法直接满足时,可以使用 pushgateway 来进行中转, 可以通过 pushgateway 将内部网络数据主动 push 到 gateway 里面去,而 prometheus 采用 pull 方式拉取 pushgateway 中数据。
4.4、运行机制
prometheus 负责从 pushgateway 和 job 中采集数据, 存储到后端 Storatge 中,可以通过 PromQL 进行查询, 推送 alerts 信息到 AlertManager。 AlertManager 根据不同的路由规则 进行报警通知。
4.5、环境介绍
| 序号 | 项目 | 版本 | 备注 |
|---|---|---|---|
| 1 | Architecture | x86_64 | 服务器架构 |
| 2 | CentOS | 7.9.2009 | 操作系统 |
| 3 | Prometheus | 2.47.0 | 监控平台 |
| 4 | Grafana | 10.1.2 | 图形化界面 |
| 5 | Node_exporter | 1.6.1 | Linux系统采集模块 |
| 6 | AlertManager | 0.26.0 | 告警模块 |
| 7 | consul_exporter | 0.9.0 | 自动服务发现模块 |
4.6、数据准备
数据准备为需要部署的程序的安排包,其中服务器架构和操作系统,未提供安装包情况,下载包获取路径主要为Promethues官网和Grafana官网下载获取。如果使用服务器直接下载太慢,可以使用磁力或其他下载工具下载后上传至服务器。
- 监控平台:Prometheus 下载
- 图形化界面工具:Ganfana 下载
- Linux系统采集模块: node_exporter 下载
- 告警模块: alertmanager 下载
- 自动服务发现: consul_exporter 下载
- 自动服务:consul 下载
- grafana 主机模板下载
部署之前将以上软件包下载至需要部署的服务器上。
4.7、网络策略
网络策略主要为需要为服务放行的端口策略,分为服务器端口放行和安全设备端口放行
| 服务 | 端口 | 备注 |
|---|---|---|
| Prometheus | 9090 | 监控平台 |
| node_exporter | 9100 | 主机数据采集 |
| Grafana | 3000 | Grafana图形界面 |
4.7.1、主机端口放行
防火墙设置
# 查看防火墙状态
systemctl status firewalld
# 启动防火墙
systemctl start firewalld
# 关闭防火墙
systemctl stop firewalld
# 重启防火墙
systemctl restart firewalld
# 设置开机启动
systemctl enable firewalld
# 设置开机不启动
systemctl disable firewalld
端口放行
firewall-cmd --zone=public --add-port=9090/tcp --permanent
# 说明
# -zone # 作用域
# -add-port=9090/tcp # 添加端口,格式为:端口/通讯协议
# -permanent 永久生效,没有此参数重启后失效

# 生效配置
firewall-cmd --reload

# 查看放行生效的端口
firewall-cmd --list-ports
放行端口关闭(此处不需要,了解即可)
firewall-cmd --zone=public --remove-port=9090/tcp --permanent
4.7.2、设备端口放行
云主机安全产品一般在安全组内放行,实体服务器一版在防火墙或者路由器设备进行放行。
4.8、部署
进入程序所在目录并解压软件包
cd /home
tar xf prometheus-2.47.0.linux-amd64.tar.gz
部署
mv prometheus-2.47.0.linux-amd64 /usr/local/prometheus-2.47.0
创建符号链接
ln -s /usr/local/prometheus-2.47.0 /usr/local/prometheus
创建prometheus存储目录
mkdir /usr/local/prometheus/data
创建服务文件
vi /usr/lib/systemd/system/prometheus.service
[Unit]
Description=https://prometheus.io

[Service]
Restart=on-failure
ExecStart=/usr/local/prometheus/prometheus \
--storage.tsdb.path=/usr/local/prometheus/data \
--config.file=/usr/local/prometheus/prometheus.yml

[Install]
WantedBy=multi-user.target
启动prometheus服务
systemctl start prometheus
查看prometheus服务
# systemctl status prometheus
● prometheus.service - https://prometheus.io
   Loaded: loaded (/usr/lib/systemd/system/prometheus.service; disabled; vendor preset: disabled)
   Active: active (running) since Sat 2023-09-23 14:37:38 CST; 3h 35min ago
 Main PID: 4243 (prometheus)
   CGroup: /system.slice/prometheus.service
           └─4243 /usr/local/prometheus/prometheus --storage.tsdb.path=/usr/local/prometheus/data --config....

Sep 23 14:37:38 devops prometheus[4243]: ts=2023-09-23T06:37:38.549Z caller=head.go:760 level=info comp...nt=0
Sep 23 14:37:38 devops prometheus[4243]: ts=2023-09-23T06:37:38.549Z caller=head.go:797 level=info comp…8827ms
Sep 23 14:37:38 devops prometheus[4243]: ts=2023-09-23T06:37:38.551Z caller=main.go:1045 level=info fs_...AGIC
Sep 23 14:37:38 devops prometheus[4243]: ts=2023-09-23T06:37:38.551Z caller=main.go:1048 level=info msg...ted"
Sep 23 14:37:38 devops prometheus[4243]: ts=2023-09-23T06:37:38.551Z caller=main.go:1229 level=info msg....yml
Sep 23 14:37:43 devops prometheus[4243]: ts=2023-09-23T06:37:43.603Z caller=main.go:1266 level=info msg="Co…µs
Sep 23 14:37:43 devops prometheus[4243]: ts=2023-09-23T06:37:43.603Z caller=main.go:1009 level=info msg...ts."
Sep 23 14:37:43 devops prometheus[4243]: ts=2023-09-23T06:37:43.603Z caller=manager.go:1009 level=info ......"
Sep 23 17:38:09 devops prometheus[4243]: ts=2023-09-23T09:38:09.607Z caller=compact.go:523 level=info c...68ms
Sep 23 17:38:09 devops prometheus[4243]: ts=2023-09-23T09:38:09.611Z caller=head.go:1298 level=info com...09ms
Hint: Some lines were ellipsized, use -l to show in full.
查看服务端口
服务文件方式查看
cat /usr/local/prometheus/prometheus.yml
# my global config
global:
  scrape_interval: 15s # Set the scrape interval to every 15 seconds. Default is every 1 minute.
  evaluation_interval: 15s # Evaluate rules every 15 seconds. The default is every 1 minute.
  # scrape_timeout is set to the global default (10s).

# Alertmanager configuration
alerting:
  alertmanagers:
    - static_configs:
        - targets:
          # - alertmanager:9093

# Load rules once and periodically evaluate them according to the global 'evaluation_interval'.
rule_files:
  # - "first_rules.yml"
  # - "second_rules.yml"

# A scrape configuration containing exactly one endpoint to scrape:
# Here it's Prometheus itself.
scrape_configs:
  # The job name is added as a label `job=<job_name>` to any timeseries scraped from this config.
  - job_name: "prometheus"

    # metrics_path defaults to '/metrics'
    # scheme defaults to 'http'.

    static_configs:
      - targets: ["localhost:9090"]
其中targets: [“localhost:9090”]处为设置的prometheus服务使用的端口
进程占用端口查看
# netstat -nltp|grep prometheus
tcp6       0      0 :::9090                 :::*                    LISTEN      4243/prometheus
查看端口占用为9090
4.9、验证
浏览器中输入配置服务器的IP地址和9090
http://ip:9090
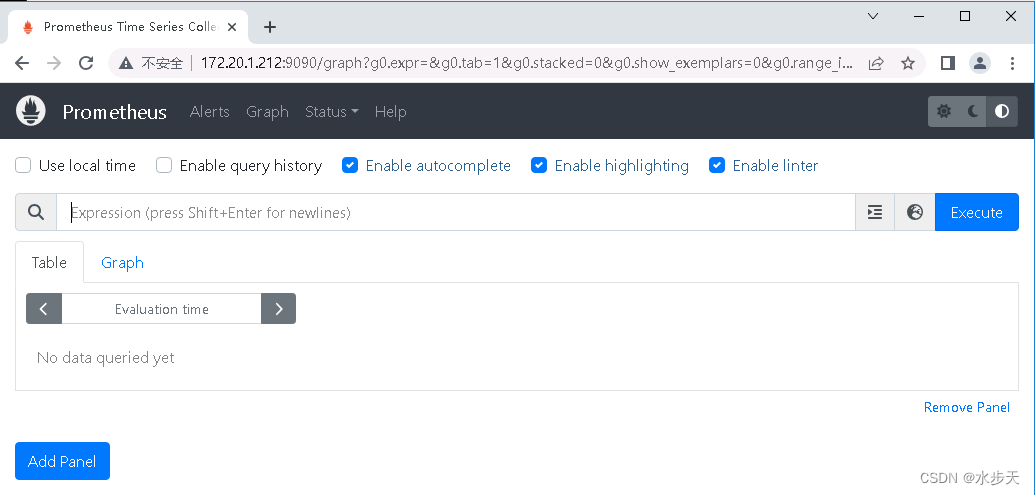
点击菜单Status—Targets 查看prometheus部署的目标服务的信息
4.10、配置
配置文件介绍
vi /usr/local/promethues/prometheus.yml
# my global config
global:
  scrape_interval: 15s # Set the scrape interval to every 15 seconds. Default is every 1 minute.
  evaluation_interval: 15s # Evaluate rules every 15 seconds. The default is every 1 minute.
  # scrape_timeout is set to the global default (10s).

# Alertmanager configuration
alerting:
  alertmanagers:
    - static_configs:
        - targets:
          # - alertmanager:9093

# Load rules once and periodically evaluate them according to the global 'evaluation_interval'.
rule_files:
  # - "first_rules.yml"
  # - "second_rules.yml"

# A scrape configuration containing exactly one endpoint to scrape:
# Here it's Prometheus itself.
scrape_configs:
  # The job name is added as a label `job=<job_name>` to any timeseries scraped from this config.
  - job_name: "prometheus"

    # metrics_path defaults to '/metrics'
    # scheme defaults to 'http'.

    static_configs:
      - targets: ["localhost:9090"]
配置文件查看
启动配置会加载配置文件,启动之前使用如下命令查看配置文件的正确性
cd /usr/local/prometheus
./promtool check config prometheus.yml
Checking prometheus.yml
 SUCCESS: prometheus.yml is valid prometheus config file syntax
以上为prometheus平台的搭建,后续会针对主机、数据库和中间件的监控进行进一步的设置和使用。


 3万+
3万+

 被折叠的 条评论
为什么被折叠?
被折叠的 条评论
为什么被折叠?
 到【灌水乐园】发言


