


1、背景
在上一篇中我们搭建了Prometheus平台,平台的搭建跟Linux系统上面安装了vim软件一样,给的只是一个很好的铸剑玄铁,具体的使用需要打磨和配件的运用。
2、目标
使用prometheus平台监控Linux主机资源
3、传承
本篇操作依赖《监控搭建-Prometheus》的基础上的操作
4、操作
1、准备资源包
将上篇中的软件包下载至本地
Linux系统采集模块: node_exporter 下载
上传至指定目录
2、进入程序目录并解压
cd /home
tar xf node_exporter-1.6.1.linux-amd64.tar.gz
3、部署
mv node_exporter-1.6.1.linux-amd64 /usr/local/node_exporter-1.6.1
4、创建符号链接
ln -s /usr/local/node_exporter-1.6.1/ /usr/local/node_exporter
5、创建服务文件
vi /usr/lib/systemd/system/node_exporter.service
[Unit]
Description=Prometheus node_exporter

[Service]
User=nobody
ExecStart=/usr/local/node_exporter/node_exporter --log.level=error
ExecStop=/usr/bin/killall node_exporter

[Install]
WantedBy=default.target
6、启动服务
systemctl start node_exporter
查看服务启动状态
systemctl status node_exporter
● node_exporter.service - Prometheus node_exporter
   Loaded: loaded (/usr/lib/systemd/system/node_exporter.service; disabled; vendor preset: disabled)
   Active: active (running) since Sat 2023-09-23 21:17:33 CST; 53s ago
 Main PID: 1549 (node_exporter)
   CGroup: /system.slice/node_exporter.service
           └─1549 /usr/local/node_exporter/node_exporter --log.level=error

Sep 23 21:17:33 devops systemd[1]: Started Prometheus node_exporter.
查看进程
ps -ef|grep node_exporter
nobody    1549     1  0 21:17 ?        00:00:00 /usr/local/node_exporter/node_exporter --log.level=error
root      1559  1500  0 21:19 pts/0    00:00:00 grep --color=auto node_exporter
7、将node_exporter加载到promtheus平台
vi /usr/local/prometheus/prometheus.yml
在scrape_configs模块下加入
scrape_configs:
  - job_name: 'prometheus'
  static_configs:
  - targets: ['localhost:9090']

  - job_name: 'host_monitor'
  static_configs:
  - targets: ['localhost:9100']
修改完毕配置文件,验证查看一下配置文件
cd /usr/local/prometheus
./promtool check config prometheus.yml
Checking prometheus.yml
 SUCCESS: prometheus.yml is valid prometheus config file syntax
验证端口
netstat -nltp | grep 9100
tcp6       0      0 :::9100                 :::*                    LISTEN      1586/node_exporter
重启prometheus服务
systemctl restart prometheus
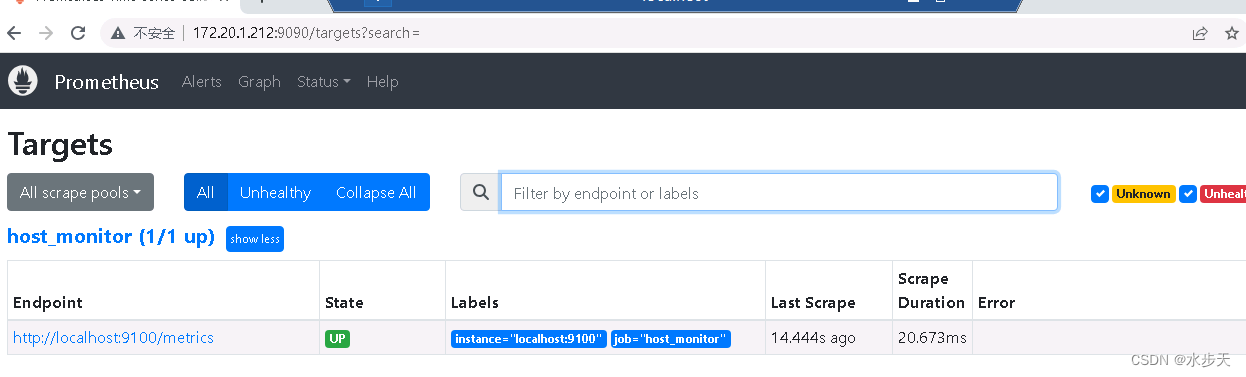
8、验证
查看
浏览器中输入 http://ip:9090在打开的浏览器页面的Statuc—Targets页面可以查看到host_monitor目标节点
指定查询
在首页页面中的检索框中使用node_cpu_seconds_total 进行检索。
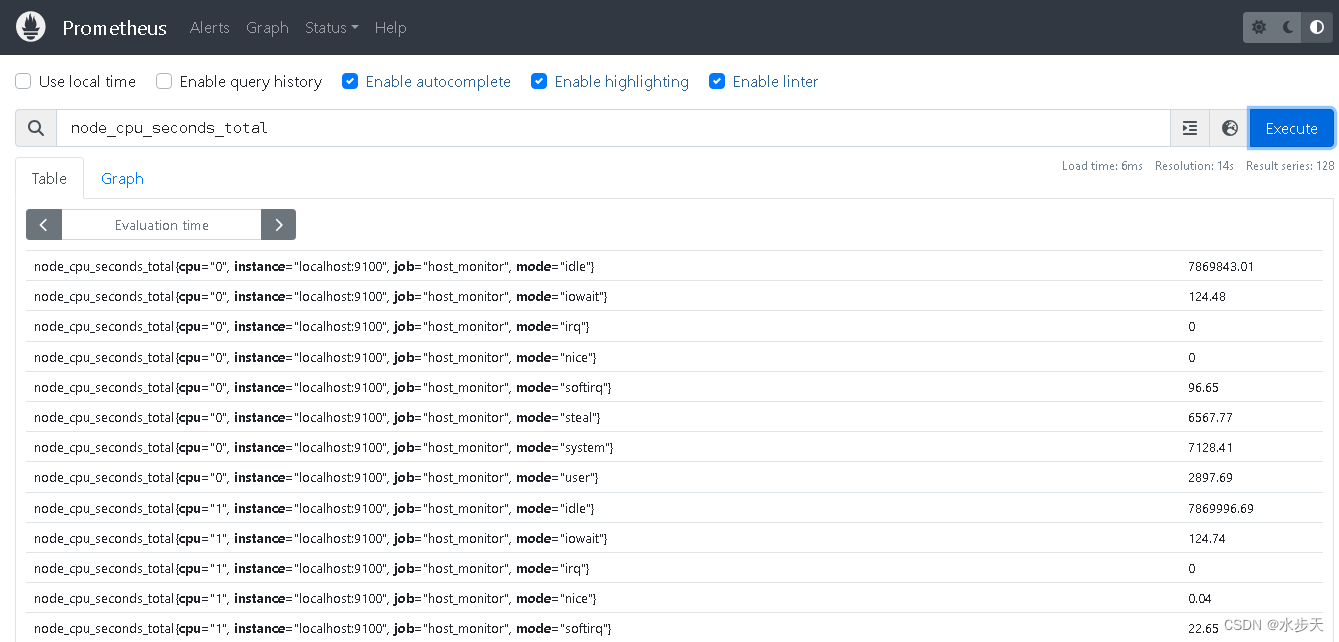
查看到16个CPU
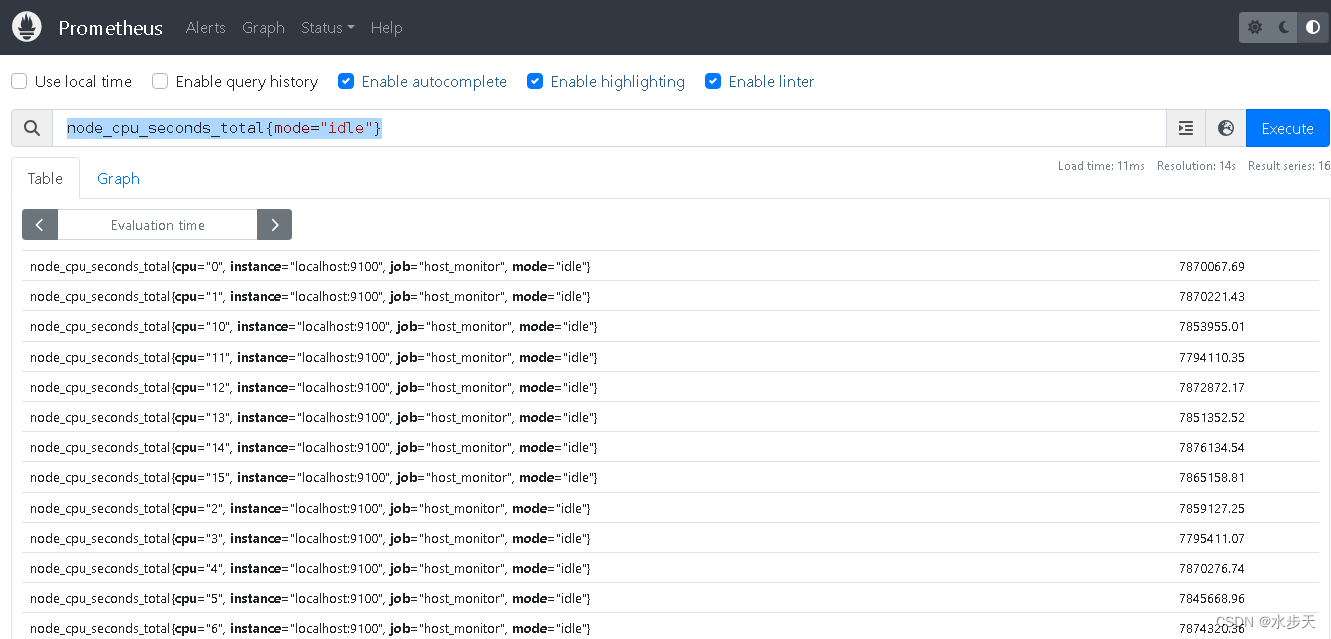
标签查看
单标签查询
node_cpu_seconds_total{mode=“idle”}
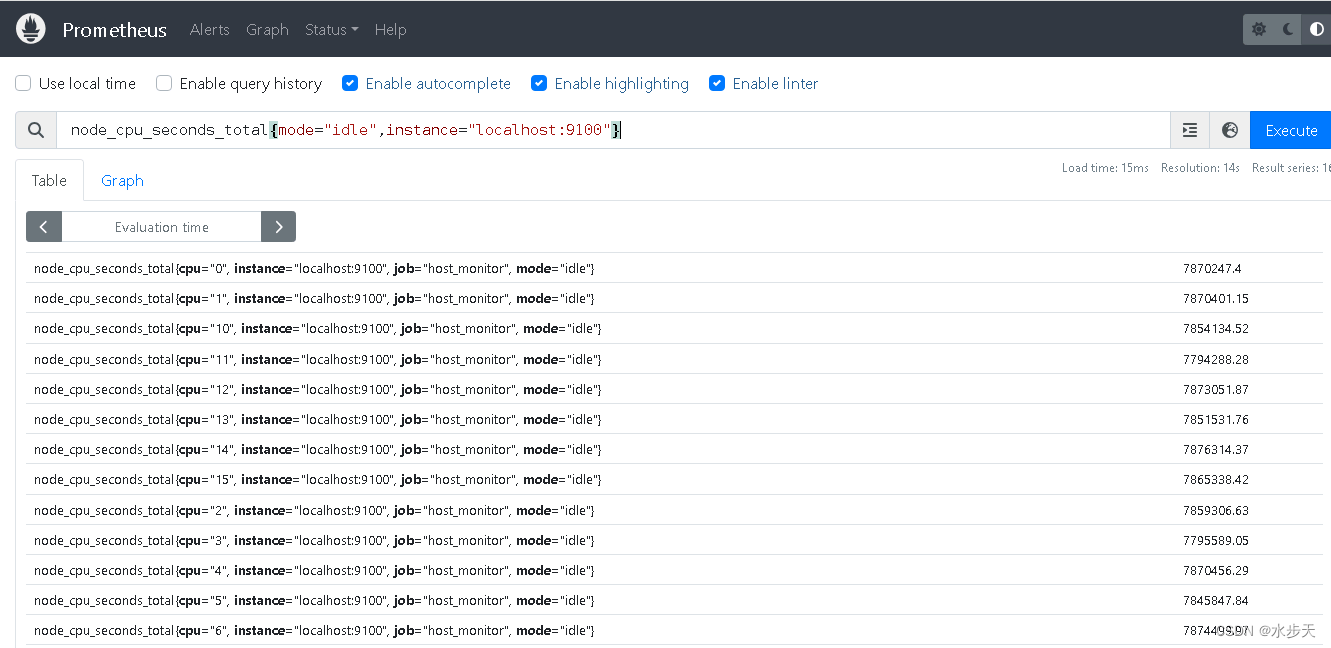
多标签查询
node_cpu_seconds_total{instance="localhost:9100",mode="idle"}
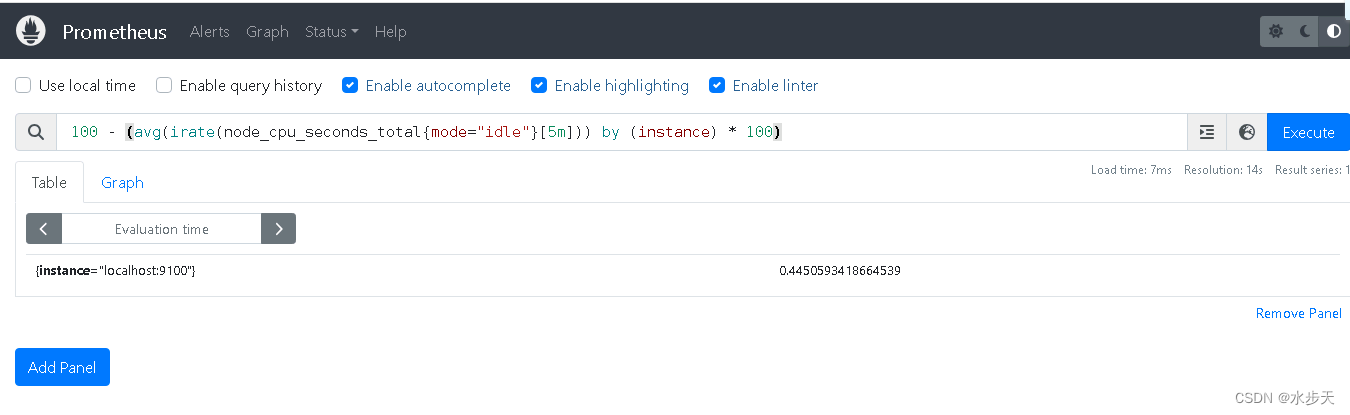
CPU使用率
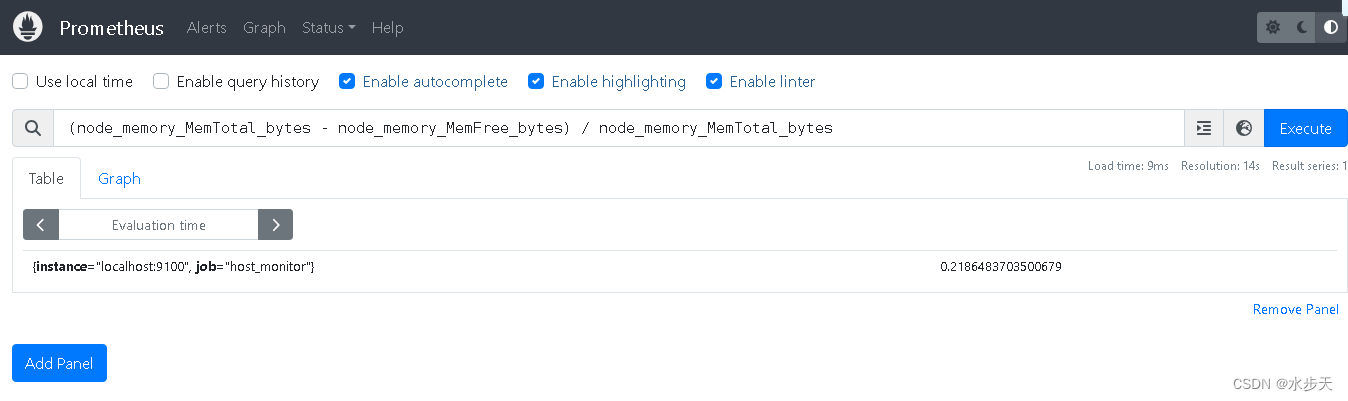
内存使用率
(node_memory_MemTotal_bytes - node_memory_MemFree_bytes) / node_memory_MemTotal_bytes
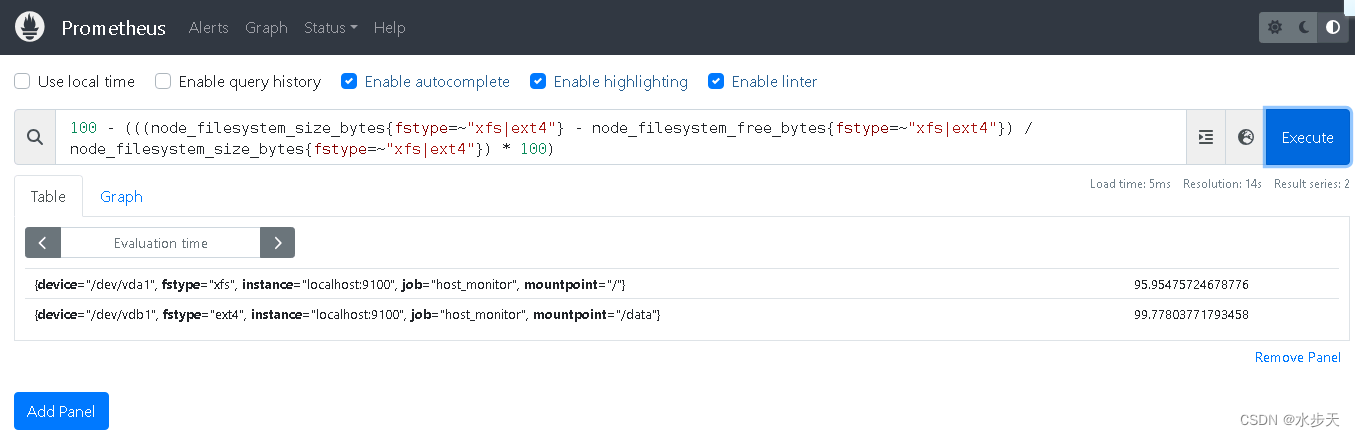
硬盘使用率
100 - (((node_filesystem_size_bytes{fstype=~"xfs|ext4"} - node_filesystem_free_bytes{fstype=~"xfs|ext4"}) / node_filesystem_size_bytes{fstype=~"xfs|ext4"}) * 100)
以上为prometheus监控单机设备,后续会针对多台主机进行的自动发现,将主机信息进行手机获取。


 3661
3661


 被折叠的 条评论
为什么被折叠?
被折叠的 条评论
为什么被折叠?
 到【灌水乐园】发言


