


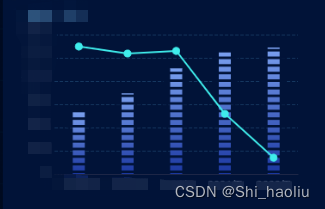
1柱图:
柱图添加分割线,添加自定义tooltip样式
<template>
  <div
    class="chart"
    v-loading="loading"
    element-loading-background="rgba(24, 41, 88, 0)"
  >
    <div id="Development" class="chartView" v-if="!noData"></div>
    <div class="noData" v-if="noData">
      <div class="emptyChart">暂无数据</div>
    </div>
  </div>
</template>

<script>
import { 接口} from "@/api/接口";
export default {
  data() {
    return {
      chart: null,
      loading: false,
      noData: false,
      params: {
        linkCode: null
      }
    };
  },

  // created() {
  //   this.getLoad();
  // },
  computed: {
    industryCode() {
      return this.$store.getters.list;
    }
    // this.getLoad();
  },
  watch: {
    industryCode: function(newVal) {
      if (this.params.linkCode !== newVal.code) {
        this.params.linkCode = newVal.code;
        this.getLoad();
      }
    }
  },
  mounted() {
    let _this = this;
    this.chart = this.$echarts.init(document.getElementById("Development"));
    window.addEventListener("resize", function() {
      _this.chartResize();
    });
    let code = this.$route.query.code;
    this.params.linkCode = code;
    // this.params.area = "320213";
    // this.params.areaType = "1";
    if (code) {
      this.getLoad();
    }
  },
  methods: {
    async getLoad() {
      this.loading = true;
      let { data } = await 接口(this.params);
      this.loading = false;
      this.lineview(data);
    },
    lineview(data) {
      let _this = this;
      let option = {
        tooltip: {
          trigger: "axis",
          className: "tooltipClass",
          borderColor: "#F2F6FF",
          position: function(point) {
            return [point[0] - 70, "10%"]; //返回x、y(横向、纵向)两个点的位置
          },
          formatter: function(p) {
            // console.log(p);
            if (p) {
              let dataCon = p;
              let txtCon = `
             <div class='blocks'>
                  <div class= "blocksContent">
                    <span>年份:</span>
                    <div class='blocksvalue'"> ${
                      dataCon[2].axisValue ? dataCon[2].axisValue : ""
                    }</div></br>
                    <span>专利数量:</span>
                    <div class='blocksvalue' style="color:rgba(255, 182, 74, 1);"> ${
                      dataCon[0].value ? dataCon[0].value : 0
                    }(项)</div></br>
                    <span>增速:</span>
                    <div class='blocksvalue' "> ${
                      dataCon[1].value ? dataCon[1].value : 0
                    }(%)</div>
                  </div>

            </div>
             `;
              return txtCon;
            }
          }
        },
        textStyle: {
          fontSize: _this.$width > 3000 ? 28 : 14,
          color: "#fff"
        },
        grid: {
          left: 20,
          right: 0,
          top: 40,
          bottom: 10,
          containLabel: true
        },
        legend: {
          show: false,
          selectedMode: false,
          top: 30,
          itemWidth: _this.$width > 3000 ? 50 : 25,
          itemHeight: _this.$width > 3000 ? 28 : 14,
          textStyle: {
            color: "#fff",
            // width: 100,
            overflow: "break",
            lineHeight: 16
          },
          pageTextStyle: {
            // color: "#fff"
          }
          // pageIconColor: "#fff"
        },
        xAxis: {
          type: "category",
          data: data.x,
          axisLine: {
            show: true,
            lineStyle: { color: "#212948" }
          },
          splitLine: { show: false },
          axisLabel: {
            color: "#5f6e8d",
            formatter: "{value}年",
            textStyle: {
              fontSize: _this.$width > 3000 ? 28 : 12
            }
          },
          axisTick: { show: false }
        },
        yAxis: [
          {
            type: "value",
            // name: "单位:(户)",
            nameTextStyle: { align: "right", color: "rgba(124, 197, 247, 1)" },
            axisTick: {
              show: false
            },
            axisLine: {
              show: false,
              lineStyle: { color: "#fff" }
            },
            splitLine: {
              show: true,
              lineStyle: {
                color: "rgba(41, 92, 136, 0.5)",
                type: "dashed"
              }
            },
            axisLabel: {
              color: "#5f6e8d",
              textStyle: {
                fontSize: _this.$width > 3000 ? 28 : 12
              }
            }
          },
          {
            name: "增速",
            show: false,
            nameTextStyle: { align: "right", color: "#5c889f" },
            type: "value",
            axisLabel: {
              color: "#5f6e8d",
              formatter: "{value} %",
              textStyle: {
                fontSize: _this.$width > 3000 ? 28 : 14
              }
            },
            axisTick: {
              show: false
            },
            axisLine: {
              show: false,
              lineStyle: { color: "rgba(41, 92, 136, 1)" }
            },
            splitLine: {
              show: false
            }
          }
        ],
        series: [
          {
            name: "企业数量",
            data: data.sl,
            barWidth: _this.$width > 3000 ? 20 : 14,
            type: "bar",
            itemStyle: {
              normal: {
                color: "#ffe654",
                // color: new this.$echarts.graphic.LinearGradient(0, 0, 0, 1, [
                //   {
                //     offset: 0,
                //     color: "rgba(122, 160, 239, 1)"
                //   },
                //   {
                //     offset: 1,

                //     color: "rgba(27, 55, 160, 1)"
                //   }
                // ]),
                barBorderRadius: 0
              }
            },
            label: {
              show: true,
              position: "top",
              color: "#ffe654"
            }
          },

          {
            name: "",
            type: "line",
            yAxisIndex: 1,
            zlevel: 3,
            smooth: true,
            symbol: false,
            symbolSize: 0,
            lineStyle: {
              normal: {
                width: 2
              }
            },
            itemStyle: {
              normal: {
                color: "#ffe654",
                borderWidth: 0
              }
            },
            data: data.zs,
            label: {
              normal: {
                show: false
              }
            }
          },
          {
            // 值分隔-给每一列添加数据分割
            type: "pictorialBar",
            itemStyle: {
              normal: {
                color: "#011338"
              }
            },
            symbolRepeat: "fixed",
            symbolMargin: 3,
            symbol: "rect",
            symbolClip: true,
            symbolSize: [30, 3],
            symbolPosition: "start",
            symbolOffset: [0, -1],
            // symbolBoundingData: this.total,
            data: data.sl,
            width: _this.$width > 3000 ? 20 : 14,
            z: 0,
            zlevel: 1
          }
        ]
      };

      this.chart.setOption(option, true);
    },
    /**
     * 图表 自适应
     */
    chartResize() {
      if (this.chart) {
        this.chart.resize();
      }
    }
  }
};
</script>

<style lang="less" scoped>
.chart {
  width: 100%;
  height: 100%;
  z-index: 2;
  position: relative;
}
.chartView {
  width: 100%;
  height: 100%;
}
::v-deep .tooltipClass {
  padding-right: 20px !important;
  display: none;
  // width: 200px;
  height: 97px;
  background-size: 100% 100%;
  border: 0px solid rgba(22, 40, 77, 0) !important;
  // background: linear-gradient(-9deg, rgba(22, 40, 77, 0.65) 0%, #050d1f 98%);
  background: url("../../img/echartsToolTip.png");
  background-color: inherit !important;
  background-size: 100% 100%;
  .blocks {
    .blocksContent {
      margin-left: 13px;
      margin-top: 7px;
      height: 33px;
      font-size: 10px;
      font-family: Source Han Sans CN;
      font-weight: 400;
      color: rgba(255, 255, 255, 1);
      line-height: 18px;
      .blocksvalue {
        display: inline-block;
      }
    }
  }
}
.emptyChart {
  position: absolute;
  top: 50%;
  right: 40%;
  color: #909399;
  font-size: 18px;
}
</style>
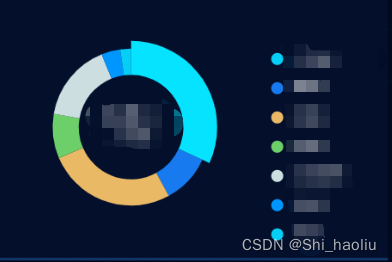
2饼图
饼图右侧增加列表

<template>
  <div
    class="chart"
    v-loading="loading"
    element-loading-background="rgba(24, 41, 88, 0)"
  >
    <div id="AttractCapital" class="chartView"></div>
    <!-- <div class="pic">
      <img src="../../img/pic.png" alt="" />
    </div> -->

    <div class="box" v-show="hyDataE[0]">
      <div class="text">
        <p>线下面的文字</p>
        //线上面的值
        <span
          >{{
            pieDataData[1] ? (100 - pieDataData[1].zb).toFixed(2) : ""
          }}%</span
        >
        <div class="line">
          <div class="line2"></div>
        </div>
      </div>
      <div class="list">
        <el-scrollbar class="page-component__scroll">
          <p v-for="(item, index) in hyDataE" :key="index">
            {{ item.NAME }}<span>{{ item.ZB }}%</span>
          </p>
          <p v-if="100 - sum">
            其它:<span>{{ (100 - sum).toFixed(2) }}%</span>
          </p>
        </el-scrollbar>
      </div>
    </div>
  </div>
</template>

<script>
import { 接口} from "@/api/接口";
// import { ChinaMerchants } from "../chanye";
let widthN = document.body.clientWidth;

export default {
  data() {
    return {
      chart: null,
      loading: false,
      chartObj: [],
      dataMain: "",
      idNow: "",
      hyData: [],
      hyDataE: [],
      pieDataData: [],
      sum: null,
      params: {
        linkCode: ""
      }
    };
  },
  props: ["area", "re"],
  computed: {
    industryCode() {
      return this.$store.getters.linkCode;
    },
    areaMy() {
      return this.$store.getters.area;
    }
  },
  watch: {
    industryCode: function(newVal) {
      if (!newVal) {
        return;
      }
      if (this.params.linkCode !== newVal) {
        this.params.linkCode = newVal;
        this.getLoad();
      }
    },
    areaMy: {
      handler: function(item) {
        if (!item.type) return;
        if (item.code == this.params.area) {
          return;
        }
        this.params.linkCode = this.$route.query.code;
        if (item.type == 2) {
          this.params.area = item.name;
        } else {
          this.params.area = item.code;
        }
        this.params.areaType = item.type;
        this.getLoad();
      },
      immediate: true
    }
  },
  mounted() {
    // this.chart = this.$echarts.init(document.getElementById("AttractCapital"));
    let _this = this;
    this.chart = this.$echarts.init(document.getElementById("AttractCapital"));
    window.addEventListener("resize", function() {
      _this.chartResize();
    });
    // this.getLoad();
  },
  methods: {
    async getLoad() {
      this.hyDataE = [];
      this.sum = 0;
      this.loading = true;
      let res = {
        linkCode: this.params.linkCode
      };
      let { data } = await 接口(res);
      this.loading = false;
      this.dataMain = data;
      let datas = [];
      data.pieData.forEach(ele => {
        datas.push({
          name: ele.NAME,
          value: ele.VALUE,
          zb: ele.ZB
        });
      });

      this.pieDataData = datas;

      this.hyData = data.hyData;

      this.hyData.forEach((ele, index) => {
        if (index < 5) {
          this.hyDataE.push(ele);
        }
      });
      if (!this.hyData[0]) {
        this.chart.setOption(
          {
            title: {
              text: "暂无数据",
              x: "center",
              y: "center",
              textStyle: {
                color: "#909399",
                fontSize: 18,
                fontWeight: "normal"
              }
            },
            backgroundColor: "transparent"
            //rgba(42, 125, 235, 0.1)
          },
          true
        );
        return false;
      }
      let QT = [];
      this.hyDataE.forEach(item => {
        QT.push(item.ZB);
      });
      QT.forEach(ele => {
        this.sum += ele;
      });
      this.sum = this.sum.toFixed(2);
      // console.log(this.sum);
      datas = datas.reverse();
      this.graphView(datas);
    },
    graphView(val) {
      let color = [
        "rgba(1, 255, 255, 1)",
        "rgba(17, 108, 253, 1)",
        "rgba(178, 184, 186, 1)",
        "rgba(97, 89, 255, 1)",
        "rgba(71, 230, 254, 1)",
        "rgba(150, 97, 188, 1)",
        "rgba(0, 134, 133, 1)",
        "rgba(240, 139, 180, 1)"
      ];

      let option = {
        color: color,
        tooltip: {
          trigger: "item",
          textStyle: {
            fontSize: widthN > 6000 ? 24 : widthN > 3800 ? 18 : 12
          }
        },
        legend: {
          show: false,
          top: "5%",
          left: "center"
        },
        series: [
          {
            type: "pie",
            center: ["24.5%", "52%"],
            radius: ["42%", "70%"],
            // avoidLabelOverlap: false,
            label: {
              show: false,
              position: "center",
              formatter: params => {
                return `{name|${params.name}}`;
              },
              rich: {
                value: {
                  padding: 5,
                  align: "center",
                  verticalAlign: "middle",
                  fontSize: 18,
                  fontWeight: "bold",
                  color: "#fff"
                },
                name: {
                  padding: 5,
                  align: "center",
                  verticalAlign: "middle",
                  fontSize: 12,
                  fontWeight: 500,
                  color: "#fff"
                },
                label: {
                  padding: 5,
                  align: "center",
                  verticalAlign: "middle",
                  fontSize: 12,
                  color: "rgba(255, 255, 255, 0.7)"
                }
              }
            },
            // itemStyle: {
            //   // 间隔
            //   borderWidth: 6,
            //   borderColor: "#0c1a3a"
            // },
            emphasis: {
              show: true,
              scaleSize: 9,
              label: {
                show: true
              }
            },
            itemStyle: {
              normal: {
                color: function(params) {
                  return color[params.dataIndex];
                }
              }
            },
            labelLine: {
              show: false
            },
            data: val
          }
        ]
      };
      // console.log(this.chart);
      this.chart.setOption(option, true);
      this.chart.dispatchAction({
        type: "highlight",
        seriesIndex: 0,
        dataIndex: 0
      });
      this.chart.on("mouseover", params => {
        // 移入后取消默认第一项高亮变大效果
        if (params.seriesType === "pie") {
          // 如果鼠标移入的不是第一项,就取消第一项的高亮效果
          if (params.dataIndex !== 0) {
            this.chart.dispatchAction({
              type: "downplay",
              seriesIndex: 0,
              dataIndex: 0
            });
            this.chart.dispatchAction({
              type: "downplay",
              seriesIndex: 1,
              dataIndex: 0
            });
          }
          // 开启内、外圈选中效果
          this.chart.dispatchAction({
            type: "highlight",
            seriesIndex: 1,
            dataIndex: params.dataIndex
          });
          this.chart.dispatchAction({
            type: "highlight",
            seriesIndex: 0,
            dataIndex: params.dataIndex
          });
        }
      });
      this.chart.on("mouseout", params => {
        // 鼠标离开每一项后关闭内、外圈移入效果
        this.chart.dispatchAction({
          type: "downplay",
          seriesIndex: 1,
          dataIndex: params.dataIndex
        });
        this.chart.dispatchAction({
          type: "downplay",
          seriesIndex: 0,
          dataIndex: params.dataIndex
        });
        // 鼠标离开每一项后继续默认第一项选中高亮效果
        this.chart.dispatchAction({
          type: "highlight",
          seriesIndex: 0,
          dataIndex: 0
        });
        this.chart.dispatchAction({
          type: "highlight",
          seriesIndex: 1,
          dataIndex: 0
        });
      });
    },

    chartResize() {
      if (this.chart) {
        this.chart.resize();
      }
    }
  }
};
</script>

<style lang="less" scoped>
.chart {
  margin: 20px;
  margin-top: 40px;
  width: 90%;
  height: 81%;
  z-index: 2;
  display: flex;
  // padding-right: 20px;
  // padding-top: 20px;
  position: relative;
}
.chartView {
  width: 100%;
  height: 100%;
  flex: 1;
  // padding: 20px;
  padding-bottom: 0;
  position: relative;
}
.pic {
  width: 44%;
  height: 80%;
  position: absolute;
  left: 11px;
  top: 27px;
  z-index: -1;
  // background: black;
  img {
    width: 100%;
    height: 100%;
    display: block;
    margin: 0 auto;
  }
}
.box {
  // background: red;
  // flex: 0.5;
  // text-align: left;
  // position: relative;
  top: 20px;
  right: 20px;
  bottom: 20px;
  position: absolute;
  .list {
    width: 140px;
    height: 100%;
    background: #042146;
    border-radius: 3px;
    border: 1px solid rgba(1, 247, 254, 0.24);
    border-radius: 3px;
    padding: 18px;
    padding-right: 12px;
    color: rgba(233, 242, 255, 1);
    line-height: 25px;
    font-size: 12px;
    p {
      color: rgba(1, 247, 254, 1);

      span {
        margin-left: 29px;
        color: rgba(255, 255, 255, 1);
      }
      // padding: 0 10px 10px 10px;
    }
  }
  span {
    color: #fff;
    // margin-left: 20px;
  }
  .text {
    position: absolute;
    top: -9px;
    color: #e9f2ff;
    // font-size: 16px;
    left: -76px;
    p {
      position: absolute;
      display: block;
      bottom: -23px;
      right: 10px;
      font-size: 12px;
      font-family: Microsoft YaHei;
      font-weight: 400;
      color: #02ffff;
      line-height: 22px;
    }
    span {
      display: inline-block;
      margin-left: 25px;
    }
    .line {
      margin-top: 5px;
      width: 76px;
      height: 1px;
      background: #01f7fe;
      position: relative;
    }
    .line2 {
      height: 1px;
      background: #01f7fe;
      width: 31px;
      transform-origin: left center;
      transform: rotate(-45deg) translateX(-31px);
    }
  }
}
</style>
饼图中间加数据
<template>
  <div
    class="chart"
    v-loading="loading"
    element-loading-background="rgba(24, 41, 88, 0)"
  >
    <div id="industry" class="chartView" v-if="!noData"></div>
    <div class="noData" v-if="noData">
      <div class="emptyChart">暂无数据</div>
    </div>
    <!-- <div class="listA">
      <el-scrollbar class="page-component__scroll">
        <div class="listI"
             v-for="item of noData"
             :key="item.name">
          <div class="icon"></div>
          <span>{{ item.name }}</span>
          <div class="num">{{ item.per }}%</div>
        </div>
      </el-scrollbar>
    </div> -->
  </div>
</template>

<script>
import { 接口} from "@/api/接口";
export default {
  data() {
    return {
      chart: null,
      noData: false,
      loading: false,
      params: {
        linkCode: null
      }
    };
  },
  computed: {
    industryCode() {
      return this.$store.getters.list;
    }
  },
  watch: {
    industryCode: function(newVal) {
      // this.getLoad();
      if (this.params.linkCode !== newVal.code) {
        this.params.linkCode = newVal.code;
        this.getLoad();
      }
    }
  },
  mounted() {
    let _this = this;
    window.addEventListener("resize", function() {
      _this.chartResize();
    });
    this.chart = this.$echarts.init(document.getElementById("industry"));

    let code = this.$route.query.code;
    this.params.linkCode = code;
    if (code) {
      this.getLoad();
    }
  },
  methods: {
    async getLoad() {
      this.loading = true;
      let { data } = await 接口(this.params);
      // console.log(data);
      this.loading = false;
      if (data.length > 0) {
        this.lineview(data);
        this.noData = false;
      } else {
        if (this.chart) this.chart.clear();
        this.noData = true;
      }
    },
    // eslint-disable-next-line no-unused-vars
    lineview(data) {
      let _this = this;
      // if (this.chart) this.chart.clear();
      let option = {
        color: [
          "#06cff7",
          "#177bef",
          "#eab966",
          "#6ccf69",
          "#cddee1",
          "#0096ff"
        ],
        textStyle: {
          fontSize: _this.$width > 3000 ? 28 : 14
        },

        legend: {
          orient: "vertical",
          // x: 'left',
          // data: nameArray.slice(5, 10),
          right: "10%",
          top: "20%",
          bottom: "10%",
          // align: "left",
          textStyle: {
            color: "#fff",
            fontSize: 12
          },
          itemGap: 20,
          icon: "circle",
          type: "scroll",
          itemWidth: _this.$width > 3000 ? 50 : 25,
          itemHeight: _this.$width > 3000 ? 28 : 14,
          pageTextStyle: {
            color: "#fff",
            fontSize: _this.$width > 3000 ? 28 : 12
          },
          pageIconSize: _this.$width > 3000 ? 28 : 10,
          formatter: function(name) {
            let item = data.filter(item => item.name === name)[0];
            return item.name;
          },
          pageIconColor: "#fff"
        },
        tooltip: {
          trigger: "item",
          textStyle: {
            fontSize: _this.$width > 3000 ? 28 : 14
          },
          formatter: item => {
            return `${item.marker}${item.name}</br>行业占比:${item.percent}(%)</br>企业数量:${item.value}(户)`;
          }
        },
        series: [
          {
            name: "标签使用频率",
            type: "pie",
            center: ["35%", "50%"],
            radius: ["40%", "60%"],
            // label: { show: false, color: "#fff" },
            data: data.map(item => {
              return {
                ...item,
                emphasis: {
                  show: true,
                  scaleSize: 9,
                  label: {
                    show: true
                  }
                }
              };
            }),
            label: {
              show: false,
              position: "center",
              formatter: params => {
                return `{value|${params.percent}}{label|%}\n{name|${params.name}}`;
              },
              rich: {
                value: {
                  padding: 5,
                  align: "center",
                  verticalAlign: "middle",
                  fontSize: 18,
                  fontWeight: "bold",
                  color: "#fff"
                },
                name: {
                  padding: 5,
                  align: "center",
                  verticalAlign: "middle",
                  fontSize: 12,
                  fontWeight: 500,
                  color: "#fff"
                },
                label: {
                  padding: 5,
                  align: "center",
                  verticalAlign: "middle",
                  fontSize: 12,
                  color: "rgba(255, 255, 255, 0.7)"
                }
              }
            },
            itemStyle: {
              // 间隔
              borderWidth: 0,
              borderColor: "#0c1a3a"
            }
          },
          {
            // 内圈
            name: "neiquan",
            // silent: true,
            type: "pie",
            radius: [120, 160],
            center: ["50%", "50%"],
            itemStyle: {
              color: "rgba(0, 0, 0, 0)" // 内圈默认透明色,不显示
            },
            label: {
              show: false
            },
            data: data
          }
        ]
      };
      this.chart.setOption(option, true);
      this.chart.dispatchAction({
        type: "highlight",
        seriesIndex: 0,
        dataIndex: 0
      });
      this.chart.on("mouseover", params => {
        // 移入后取消默认第一项高亮变大效果
        if (params.seriesType === "pie") {
          // 如果鼠标移入的不是第一项,就取消第一项的高亮效果
          if (params.dataIndex !== 0) {
            this.chart.dispatchAction({
              type: "downplay",
              seriesIndex: 0,
              dataIndex: 0
            });
            this.chart.dispatchAction({
              type: "downplay",
              seriesIndex: 1,
              dataIndex: 0
            });
          }
          // 开启内、外圈选中效果
          this.chart.dispatchAction({
            type: "highlight",
            seriesIndex: 1,
            dataIndex: params.dataIndex
          });
          this.chart.dispatchAction({
            type: "highlight",
            seriesIndex: 0,
            dataIndex: params.dataIndex
          });
        }
      });
      this.chart.on("mouseout", params => {
        // 鼠标离开每一项后关闭内、外圈移入效果
        this.chart.dispatchAction({
          type: "downplay",
          seriesIndex: 1,
          dataIndex: params.dataIndex
        });
        this.chart.dispatchAction({
          type: "downplay",
          seriesIndex: 0,
          dataIndex: params.dataIndex
        });
        // 鼠标离开每一项后继续默认第一项选中高亮效果
        this.chart.dispatchAction({
          type: "highlight",
          seriesIndex: 0,
          dataIndex: 0
        });
        this.chart.dispatchAction({
          type: "highlight",
          seriesIndex: 1,
          dataIndex: 0
        });
      });
      //       setTimeout(()=>{
      //   // 添加监听事件和默认选中效果
      //   ringGradientmMuseOut(this.chart)
      // },500)
    },
    /**
     * 图表 自适应
     */
    chartResize() {
      if (this.chart) {
        this.chart.resize();
      }
    }
  }
};
</script>

<style lang="less" scoped>
.chart {
  width: 100%;
  height: 100%;
  z-index: 2;
  position: relative;
}
.chartView {
  width: 100%;
  height: 100%;
}
.emptyChart {
  position: absolute;
  top: 50%;
  right: 40%;
  color: #909399;
  font-size: 18px;
  // color: "#909399" !important;
  // font-size: "18px" !important;
}
</style>
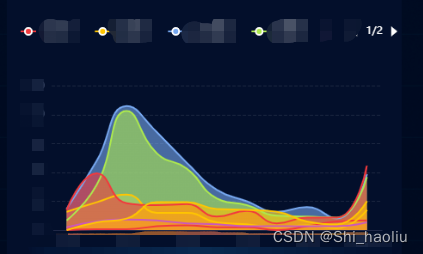
3折线
多条折线的图
<template>
  <div
    class="chart"
    v-loading="loading"
    element-loading-background="rgba(24, 41, 88, 0)"
  >
    <div id="LifeCycle" class="chartView" v-if="!noData"></div>
    <div class="noData" v-if="noData">
      <div class="emptyChart">暂无数据</div>
    </div>
  </div>
</template>

<script>
import { 接口} from "@/api/接口";
export default {
  data() {
    return {
      chart: null,
      loading: false,
      noData: false,
      params: {
        linkCode: null
      },
      color: [
        "#f2393c",
        "#ffc500",
        "rgba(118, 167, 239, 1)",
        "rgba(173, 233, 77, 1)",
        "#ca58bd",
        "#f2393c",
        "#ffc500",
        "rgba(118, 167, 239, 1)",
        "rgba(173, 233, 77, 1)",
        "#ca58bd",
        "#f2393c",
        "#ffc500",
        "rgba(118, 167, 239, 1)",
        "rgba(173, 233, 77, 1)",
        "#ca58bd",
        "#f2393c",
        "#ffc500",
        "rgba(118, 167, 239, 1)",
        "rgba(173, 233, 77, 1)",
        "#ca58bd"
      ]
    };
  },

  // created() {
  //   this.getLoad();
  // },
  computed: {
    industryCode() {
      return this.$store.getters.list;
    }
    // this.getLoad();
  },
  watch: {
    industryCode: function(newVal) {
      // console.log(newVal);
      // this.getLoad();
      if (this.params.linkCode !== newVal.code) {
        this.params.linkCode = newVal.code;
        this.getLoad();
      }
    }
  },
  mounted() {
    let _this = this;
    this.chart = this.$echarts.init(document.getElementById("LifeCycle"));
    window.addEventListener("resize", function() {
      _this.chartResize();
    });

    let code = this.$route.query.code;
    this.params.linkCode = code;
    // this.getLoad();
    // this.params.area = "320213";
    // this.params.areaType = "1";
    if (code) {
      this.getLoad();
    }
  },
  methods: {
    async getLoad() {
      this.loading = true;
      let _this = this;
      let res = await 接口(this.params);
      // console.log(data)
      this.loading = false;
      if (res.data.x) {
        this.noData = false;
        let data = {},
          yData = [];
        if (res.data && res.data != "null" && res.data.x) {
          data.x = res.data.x;
          res.data.y.forEach((element, i) => {
            yData.push({
              name: element.name,
              type: "line",
              data: element.data,
              // smooth: true,
              color: this.color[i],
              // lineStyle: {
              //   color: this.color[i]
              // },
              // symbolSize: _this.$width > 3000 ? 10 : 8,
              showSymbol: false,
              symbol: "circle",
              smooth: true,
              itemStyle: {
                borderWidth: _this.$width > 3000 ? 2 : 1,
                borderColor: "#fff",
                color: this.color[i]
              },
              lineStyle: {
                color: this.color[i]
              },
              areaStyle: {
                color: {
                  type: "linear",
                  x: 0,
                  y: 0,
                  x2: 0,
                  y2: 1,
                  colorStops: [
                    // 渐变颜色
                    {
                      offset: 0,
                      color: this.color[i]
                    },
                    {
                      offset: 1,
                      color: this.color[i]
                    }
                  ],
                  global: false
                },
                opacity: 0.6
              },
              label: {
                show: false,
                position: "top",
                textStyle: {
                  color: "#fff"
                }
              }
              // itemStyle: { color: this.color[i] }
            });
          });
          data.y = yData;
          this.lineview(data);
        }
      } else {
        if (this.chart) this.chart.clear();
        this.noData = true;
      }
      // console.log(data);
      // var data = {
      //   date: ["2018", "2019", "2020", "2021", "2022", "2023"],
      //   speed: [27.35, 21.25, 4, 4.95, 0, -1.4],
      //   value: [433, 525, 546, 573, 573, 565]
      // };
      // this.loading = false;
      // this.lineview(data);
      // if (
      //   data.speed.some(item => item > 0) ||
      //   data.value.some(item => item > 0)
      // ) {
      //   this.lineview(data);
      //   this.noData = false;
      // } else {
      //   if (this.chart) this.chart.clear();
      //   this.noData = true;
      // }
    },
    lineview(data) {
      let _this = this;
      if (this.chart) this.chart.clear();
      let option = {
        tooltip: {
          trigger: "axis"
          // className: "tooltipClass",
          // borderColor: "#F2F6FF",
          // position: function(point) {
          //   return [point[0] - 70, "10%"]; //返回x、y(横向、纵向)两个点的位置
          // }
          // formatter: function(p) {
          //   // console.log(p);
          //   if (p) {
          //     let dataCon = p;
          //     let txtCon = `
          //    <div class='blocks'>
          //         <div class= "blocksContent">
          //           <span>年份:</span>
          //           <div class='blocksvalue'"> ${
          //             dataCon[2].axisValue ? dataCon[2].axisValue : ""
          //           }</div></br>
          //           <span>企业数量:</span>
          //           <div class='blocksvalue' style="color:rgba(255, 182, 74, 1);"> ${
          //             dataCon[0].value ? dataCon[0].value : 0
          //           }</div></br>
          //           <span>增速:</span>
          //           <div class='blocksvalue' "> ${
          //             dataCon[1].value ? dataCon[1].value : 0
          //           }%</div>
          //         </div>

          //   </div>
          //    `;
          //     return txtCon;
          //   }
          // }
        },
        textStyle: {
          fontSize: _this.$width > 3000 ? 28 : 14,
          color: "#fff"
        },
        grid: {
          left: "5%",
          right: "5%",
          top: "35%",
          bottom: 10,
          containLabel: true
        },
        legend: {
          show: true,
          top: 30,
          left: 10,
          right: 10,
          selectedMode: true,
          type: "scroll",
          itemGap: _this.$width > 3000 ? 50 : 25,
          itemWidth: _this.$width > 3000 ? 50 : 18,
          itemHeight: _this.$width > 3000 ? 28 : 10,
          textStyle: {
            color: "#fff",
            // width: _this.$width > 3000 ? 200 : 100,
            fontSize: 12,
            overflow: "break",
            lineHeight: _this.$width > 3000 ? 32 : 16
          },
          pageTextStyle: {
            color: "#fff",
            fontSize: _this.$width > 3000 ? 28 : 12
          },
          pageIconSize: _this.$width > 3000 ? 28 : 12,
          pageIconColor: "#fff"
        },
        xAxis: {
          type: "category",
          data: data.x || [],
          // axisLine: { show: true, lineStyle: { color: "#fff" } },
          splitLine: { show: false },
          axisLabel: {
            color: "#5f6e8d",
            textStyle: {
              fontSize: _this.$width > 3000 ? 28 : 12
            }
          },
          axisLine: {
            show: true,
            lineStyle: { color: "#212948" }
          },
          axisTick: { show: false }
        },
        yAxis: {
          type: "value",
          // name: "单位:(户)",
          // nameTextStyle: { align: "left", color: "#5c889f" },
          axisTick: {
            show: false
          },
          axisLine: {
            show: false,
            lineStyle: { color: "#fff" }
          },
          splitLine: {
            show: true,
            lineStyle: {
              color: "rgba(255,255,255,0.1)",
              type: "dashed"
            }
          },
          axisLabel: {
            color: "#5f6e8d",
            textStyle: {
              fontSize: _this.$width > 3000 ? 28 : 12
            }
          }
        },
        series: data.y
      };
      this.chart.setOption(option, true);
    },
    /**
     * 图表 自适应
     */
    chartResize() {
      if (this.chart) {
        this.chart.resize();
      }
    }
  }
};
</script>

<style lang="less" scoped>
.chart {
  width: 100%;
  height: 100%;
  z-index: 2;
  position: relative;
}
.chartView {
  width: 100%;
  height: 100%;
}
::v-deep .tooltipClass {
  padding-right: 20px !important;
  display: none;
  // width: 200px;
  height: 97px;
  background-size: 100% 100%;
  border: 0px solid rgba(22, 40, 77, 0) !important;
  // background: linear-gradient(-9deg, rgba(22, 40, 77, 0.65) 0%, #050d1f 98%);
  background: url("../../img/echartsToolTip.png");
  background-color: inherit !important;
  background-size: 100% 100%;
  .blocks {
    // .blocksTitle {
    //   // padding: 16px 16px;
    //   margin: 13px 13px 5px 13px;
    //   height: 21px;
    //   font-size: 20px;
    //   font-family: Source Han Sans CN;
    //   font-weight: 500;
    //   color: #ffffff;
    //   line-height: 13px;
    // }
    .blocksContent {
      margin-left: 13px;
      margin-top: 7px;
      height: 33px;
      font-size: 10px;
      font-family: Source Han Sans CN;
      font-weight: 400;
      color: rgba(255, 255, 255, 1);
      line-height: 18px;
      .blocksvalue {
        display: inline-block;
      }
    }
  }
}
.emptyChart {
  position: absolute;
  top: 50%;
  right: 40%;
  color: #909399;
  font-size: 18px;
  // color: "#909399" !important;
  // font-size: "18px" !important;
}
</style>
4雷达图
雷达图添加左侧自定义checkbox,可以去掉右侧的数据项(需要后端配合,每次调用接口传需要查的数据项)

<template>
  <div class="ct">
    <div class="leftct">
      <el-checkbox-group v-model="checkedCities" :min="3" :max="99">
        <el-checkbox
          v-for="(city, index) in cities"
          :label="city"
          :key="index"
          @change="checkboxChange(city)"
          >{{ city }}</el-checkbox
        >
      </el-checkbox-group>
    </div>
    <div
      class="chart"
      v-loading="loading"
      element-loading-background="rgba(24, 41, 88, 0)"
    >
      <div id="SZRHYYZS" class="chartView" v-if="!noData"></div>
      <div class="noData" v-if="noData">
        <div class="emptyChart">暂无数据</div>
      </div>
    </div>
  </div>
</template>

<script>
import { 接口} from "@/api/接口";
export default {
  data() {
    return {
      chart: null,
      loading: false,
      noData: false,
      params: {
        linkCode: null
      },
      checkedCities: [
        "数据项1",
        "数据项2",
        "数据项3",
        "数据项4",
        "数据项5",
        "数据项6"
      ],
      cities: [
        "数据项1",
        "数据项2",
        "数据项3",
        "数据项4",
        "数据项5",
        "数据项6"
      ],
      citiesE: [
        "数据项1",
        "数据项2",
        "数据项3",
        "数据项4",
        "数据项5",
        "数据项6"
      ],
      colorList: ["#ffd200", "#46bb8f", "#4c54e8"]
    };
  },

  // created() {
  //   this.getLoad();
  // },
  computed: {
    industryCode() {
      return this.$store.getters.list;
    }
  },
  watch: {
    industryCode: function(newVal) {
      console.log(newVal);
      this.getLoad();
    }
  },
  mounted() {
    let _this = this;
    this.chart = this.$echarts.init(document.getElementById("SZRHYYZS"));
    window.addEventListener("resize", function() {
      _this.chartResize();
    });
    this.getLoad();
  },
  methods: {
    async getLoad() {
      this.loading = true;
      let res = await 接口({});
      this.loading = false;
      if (res.data) {
        this.noData = false;
        let data = {},
          serves = [];
        if (res.data) {
          // data.x = res.data.x;
          for (let i = 0; i < res.data.length; i++) {
            serves.push({
              name: res.data[i].name,
              type: "radar",
              areaStyle: {
                normal: {
                  color: this.colorList[i],
                  opacity: 0.4
                }
              },
              z: res.data[i].name == "" ? 2 : 1,//判断哪个面积图显示在最上面
              symbolSize: 0,
              lineStyle: {
                normal: {
                  color: this.colorList[i],
                  width: 1
                }
              },
              data: [
                {
                  value: res.data[i].num,
                  name: res.data[i].name
                }
              ]
            });
            data.serves = serves;
          }
          this.lineview(data);
        }
      } else {
        if (this.chart) this.chart.clear();
        this.noData = true;
      }
    },
    checkboxChange(event) {
      if (this.citiesE.includes(event)) {
        this.citiesE = this.citiesE.filter(val => {
          return val != event;
        });
      } else {
        this.citiesE.push(event);
      }
      this.getLoad();
    },
    lineview(data) {
      let indicator = [];
      this.citiesE.forEach(ele => {
        indicator.push({
          name: ele
        });
      });

      let _this = this;
      let option = {
        tooltip: {
          trigger: "item",
          formatter: function(value) {
            let ary = _this.citiesE;
            let html = `${value.marker}${value.data.name}</br>`;
            value.data.value.forEach((eles, index) => {
              html += `
              ${ary[index]}<div style="width:20px;display:inline-block"></div>${eles}</br>
              `;
            });

            return html;
          }
        },
        textStyle: {
          fontSize: _this.$width > 3000 ? 28 : 14,
          color: "#fff"
        },
        grid: {
          left: 10,
          right: 20,
          top: 10,
          bottom: 30,
          containLabel: true
        },
        color: this.colorList,
        legend: {
          show: true,
          bottom: 10,
          right: "center",
          icon: "circle",
          itemWidth: 15, // 图例标记的图形宽度。[ default: 25 ]
          itemHeight: 12, // 图例标记的图形高度。[ default: 14 ]
          itemGap: 15, // 图例每项之间的间隔。[ default: 10 ]横向布局时为水平间隔,纵向布局时为纵向间隔。
          orient: "horizontal",
          textStyle: {
            fontSize: 12,
            color: "#fff"
          }
          // data: data.legends
        },
        radar: {
          shape: "circle",
          center: ["50%", "45%"],
          radius: "60%",
          // triggerEvent: true,
          name: {
            rich: {
              a: {
                fontSize: 16,
                color: "#fff",
                lineHeight: "40",
                padding: [0, 15, 0, 15]
              },
              b: {
                color: "#41E1FF",
                fontSize: 16,
                padding: [0, 0, 0, 15]
              },
              c: {
                color: "#fff",
                fontSize: 16
              },
              d: {
                color: "rgb(255,292,203)",
                fontSize: 16,
                padding: [0, 15, 0, 0]
              },
              triggerEvent: true
            }
          },

          nameGap: "10",
          indicator: indicator,
          splitArea: {
            areaStyle: {
              color: "transparent"
            }
          },
          axisName: {
            formatter: function(value) {
              // Split the axis name into multiple lines if it's too long
              var charsPerLine = 8;
              var lines = [];
              for (var i = 0; i < value.length; i += charsPerLine) {
                lines.push(value.substr(i, charsPerLine));
              }
              return lines.join("\n");
            }
          },
          axisLine: {
            //指向外圈文本的分隔线样式
            lineStyle: {
              color: "rgba(0,0,0,0)"
            }
          },
          splitLine: {
            lineStyle: {
              width: 2,
              color: ["rgba(45,65,110, 0.6)"].reverse()
            }
          }
        },
        series: data.serves
      };

      this.chart.setOption(option, true);
    },
    /**
     * 图表 自适应
     */
    chartResize() {
      if (this.chart) {
        this.chart.resize();
      }
    }
  }
};
</script>

<style lang="less" scoped>
.ct {
  width: 100%;
  height: 100%;
  display: flex;
  justify-content: space-between;
	//checkboxs的样式
  .leftct {
    // width: 30%;
    height: 92%;

    overflow: hidden;
    overflow-y: auto;

    // background: red;
    ::v-deep .el-checkbox {
      color: #fff;
    }

    ::v-deep .el-checkbox-group {
      height: 100%;
      display: flex;
      flex-direction: column;
      // flex-wrap: wrap;
      align-content: space-between;
      justify-content: space-evenly;
      padding: 20px;
      padding-right: 0;
      width: 160px;
    }

    ::v-deep .el-checkbox__input.is-checked + .el-checkbox__label {
      color: #fff;
    }

    ::v-deep .el-checkbox__input .el-checkbox__inner {
      background-color: transparent;
      border-color: #2e9ef2;
    }

    ::v-deep .el-checkbox__input.is-checked .el-checkbox__inner {
      background-color: transparent;
      border-color: #fdd52f;
    }

    ::v-deep .el-checkbox__inner::after {
      color: #fdd52f;
      border-color: #fdd52f;
    }
  }
}

.chart {
  width: 100%;
  height: 100%;
  z-index: 2;
  position: relative;
}

.chartView {
  width: 100%;
  height: 100%;
}
.emptyChart {
  position: absolute;
  top: 50%;
  right: 40%;
  color: #909399;
  font-size: 18px;
  // color: "#909399" !important;
  // font-size: "18px" !important;
}
</style>
地图(高德,echarts)
高德
<template>
  <div class="charts">
    <div
      class="mapView"
      v-loading="loading"
      element-loading-background="rgba(24, 41, 88, 0.4)"
      id="mapView"
    ></div>
    <div class="entTit" v-if="entName">
      <p @click="jumpEntInfo">{{ entName }}</p>
    </div>
  </div>
</template>

<script>
import AMapLoader from "@amap/amap-jsapi-loader";
import { 地图接口} from "@/api/地图接口";
import { 数据接口 } from "@/api/接口 ";
let w = document.documentElement.clientWidth;
export default {
  data() {
    return {
      loading: false,
      layer: null,
      list: {
        regcap: "",
        num: ""
      },
      AMap: null, //地图对象
      params: {
        linkCode: null
      },
      entName: "",
      mapText: "", //地图文本打点
      markerList: [],
      tc: false
    };
  },
  computed: {
    industryCode() {
      return this.$store.getters.list;
    }
  },
  watch: {

    industryCode: function(newVal) {
      if (newVal.code == undefined) {
        return;
      } else {
        if (this.params.linkCode !== newVal.code) {
          this.params.linkCode = newVal.code;
          this.layer ? this.layer.setMap(null) : "";
          this.graphMaker();
          this.infoWin ? this.infoWin.close() : "";
        }
      }
    }
  },
  mounted() {
    let _this = this;
    _this.mapLoad();
    window.onclick = function(e) {
      if (e.type == "click" && e.target.className == "jumpM") {
        _this.jumpEntInfo(e.target.innerText);
      }
    };
  },
  methods: {
    mapLoad() {
      let $this = this,
        _this = this;
      $this.loading = true;
      AMapLoader.load({
        key: "", // 申请好的Web端开发者Key,首次调用 load 时必填
        version: "2.0", // 指定要加载的 JSAPI 的版本,缺省时默认为 1.4.15
        plugins: ["AMap.DistrictSearch", "AMap.PolyEditor"], // 需要使用的的插件列表,如比例尺'AMap.Scale'等
        AMapUI: {
          // 是否加载 AMapUI,缺省不加载
          version: "1.1", // AMapUI 缺省 1.1
          plugins: [] // 需要加载的 AMapUI ui插件
        }
        // Loca: {
        //   // 是否加载 Loca, 缺省不加载
        //   version: "2.0" // Loca 版本,缺省 1.3.2
        // }
      })
        .then(AMap => {
          $this.AMap = new AMap.Map("mapView", {
            mapStyle: "amap://styles/31e1a2843551d0d40a6f35263cbf55a9", //设置地图的显示样式
            features: ["bg", "road"],
            viewMode: "3D",
            pitch: 30,
            zoom: _this.$width > 3000 ? 13 : 12
          });
          $this.AMap.on("complete", async function() {
            // $this.typeGraph(AMap);
            // $this.graphMaker();
            let street = await 获取哪个的地图("100000");//中国
            let listOld = street.features,
              listNew = [];
            // strokeColor: "#0a6dc4",
            for (let index = 0; index < listOld.length; index++) {
              const element = listOld[index];
              let polygon = new AMap.Polygon({
                path: element.geometry.coordinates,
                fillColor: "#ccebc5",
                strokeOpacity: 1,
                fillOpacity: 0, // 面积越大透明度越高
                strokeColor: "#0a6dc4",
                strokeWeight: w > 3800 ? 2 : 1,
                zIndex: 20
                // strokeStyle: "dashed",
                // strokeDasharray: [8, 8]
              });
              listNew.push(polygon);
            }
            $this.AMap.add(listNew);

            $this.AMap.on("click", function() {
              // $this.entName = "";
              _this.mapText ? _this.mapText.hide() : "";
            });
          });
        })
        .catch(e => {
          console.log(e);
        });
    },
    async typeGraph(AMap) {
      let that = this;
      let { CSCYDNDQQX1, CSCYDNDQQX2 } = that.$store.getters.authority;
      if (CSCYDNDQQX1 && CSCYDNDQQX1[0] == 1) {
        //行政区划
        let city =
          CSCYDNDQQX2 && CSCYDNDQQX2[0] && CSCYDNDQQX2[0].split("-")[1];
        new AMap.DistrictSearch({
          extensions: "all",
          subdistrict: 0,
          showbiz: false
        }).search(city, function(status, result) {
          //user.dictionaryName
          if (status == "complete") {
            that.maskView(result.districtList[0].boundaries, AMap);
          }
        });
      } else if (CSCYDNDQQX1 && CSCYDNDQQX1[0] == 2) {

      }
    },
    maskView(newJson, AMap) {
      let that = this;
      // 外多边形坐标数组和内多边形坐标数组
      var outer = [
        new AMap.LngLat(-360, 90, true),
        new AMap.LngLat(-360, -90, true),
        new AMap.LngLat(360, -90, true),
        new AMap.LngLat(360, 90, true)
      ];
      let holes = newJson;
      var pathArray = [outer];
      pathArray.push.apply(pathArray, holes);
      // eslint-disable-next-line no-undef
      var polygon = new AMap.Polygon({
        pathL: pathArray,
        strokeColor: "#0e4da7",
        strokeWeight: 2,
        fillColor: "rgba(1, 20, 83,1)", //rgb(1, 20, 83)
        fillOpacity: 0
      });
      polygon.setPath(pathArray);
      that.AMap.add(polygon);
    },
    async graphMaker() {
      this.loading = true;
      // eslint-disable-next-line no-unused-vars
      let { data } = await 数据接口(this.params);
      this.markerLoad(data);
    },
    async markerLoad(data) {
      let that = this;
      that.AMap.remove(that.markerList);
      let listOld = data,
        listNew = [];
      for (let index = 0; index < listOld.length; index++) {
        let element = listOld[index];
        let jwd = element.KEY.split(",");
        listNew.push({
          location: [jwd[0], jwd[1]],
          num: element.COUNT
          // level: element.level,
          // jwd: element.jwd
        });
      }

      that.closeInfoWin();
      let markerList = [];

      // let icon = require("/icon8.png");
      // let icon1 = require("../../../assets/icon9.png");

      let icon = require("../../img/.png");//地图打点的图片
      let icon1 = require("../../img/.png");//地图打点的图片
      // eslint-disable-next-line no-undef
      var endIcon = new AMap.Icon({
        // eslint-disable-next-line no-undef
        size: w > 3800 ? new AMap.Size(46, 52) : new AMap.Size(23, 26),
        image: icon1,
        // eslint-disable-next-line no-undef
        imageSize: w > 3800 ? new AMap.Size(46, 52) : new AMap.Size(23, 26)
        // imageOffset: new AMap.Pixel(-35, -3)
      });
      // eslint-disable-next-line no-undef
      var endIcon1 = new AMap.Icon({
        // eslint-disable-next-line no-undef
        size: w > 3800 ? new AMap.Size(46, 52) : new AMap.Size(23, 26),
        image: icon,
        // eslint-disable-next-line no-undef
        imageSize: w > 3800 ? new AMap.Size(46, 52) : new AMap.Size(23, 26)
      });
      // let iconHtml = '<div class="clire1" style=></div>';
      // let iconHtml2 = '<div class="clire2"></div>';
      for (var i = 0; i < listNew.length; i++) {
        // eslint-disable-next-line no-undef
        let marker = new AMap.Marker({
          position: listNew[i].location,
          // eslint-disable-next-line no-undef
          offset: new AMap.Pixel(0, 0),
          // eslint-disable-next-line no-undef
          icon: listNew[i].num >= 5 ? endIcon : endIcon1,
          // content: listNew[i].num >= 5 ? iconHtml : iconHtml2,
          anchor: "bottom-center",
          zoom: 13
        });
        marker.index = i;
        marker.lon = listNew[i].location[0];
        marker.lat = listNew[i].location[1];
        marker.on("click", function(res) {
          this.tc = true;
          that.AMap.setCenter([res.target.lon, res.target.lat]);
          that.entNameFun(marker, {
            KEY: res.target.lon + "," + res.target.lat
          });
        });
        markerList.push(marker);
      }

      that.markerList = markerList;
      that.AMap.add(markerList);

      that.AMap.setFitView("", false, [0, 0, 0, 0]);
      that.loading = false;
    },
    async entNameFun(e, params) {
      let _this = this;
      params.linkCode = _this.params.linkCode;
      let res = await getEntByGis(params);

      _this.openInfoWin(_this.markerList[e.index], res.data);
    },

    async openInfoWin(ev, res) {
      let _this = this;
      let listA = res.ENTNAME,
        str = "";
      for (let index = 0; index < listA.length; index++) {
        const element = listA[index];
        str += `<div class='map_pos'>
                  <span class='jumpM'>${element}</span>
              </div>`;
      }
      let markerContent = `
                            <div class='map_box'>
                                ${str}
                              </div>
                          `;
      // }
      // if (!_this.infoWin) {
      // eslint-disable-next-line no-undef
      _this.infoWin = new AMap.InfoWindow({
        // autoMove: false,
        // isCustom: true, //使用自定义窗体
        // eslint-disable-next-line no-undef
        offset: w > 3800 ? new AMap.Pixel(0, -40) : new AMap.Pixel(0, -20),
        content: markerContent,
        anchor: "bottom-center"
      });
      let jwd = [ev.lon, ev.lat];
      _this.infoWin.open(_this.AMap, jwd);
      // }
      // _this.tableDom.innerHTML = trStr;
      // console.log(_this.infoWin);
    },
    //关闭 鼠标提示
    closeInfoWin() {
      let _this = this;
      if (_this.infoWin) {
        _this.infoWin.close();
      }
    },
    //体哦啊转
    jumpEntInfo(ent) {
      const { href } = this.$router.resolve({
        path: "跳转",
        query: { entName: ent }
      });
      window.open(href, "_blank");
    }
  }
};
</script>

<style lang="less" scoped>
// @import "~@/styles/indexX.less";
.charts,
.mapView {
  width: 100%;
  height: 100%;
  position: relative;
}
.entTit {
  position: absolute;
  right: 15px;
  top: 15px;
  background: #363f49;
  color: #c7cdd8;
  padding: 10px;
  min-width: 200px;
  font-size: 0.9em;

  z-index: 99;
  &:hover {
    color: #72baff;
    cursor: pointer;
  }
}
/deep/.amap-info-content {
  // background: palegreen;
  background: transparent;
  position: relative;
  z-index: 99;
  // padding: 0;
  color: #fff;
  .map_box {
    border: 1px solid rgba(255, 255, 255, 0.3);
    background: #0b1d38;
    padding: 0 10px;
    .map_pos {
      font-size: 16px;
      display: flex;
      align-items: center;
      padding: 5px 0;
      .icon {
        width: 42px;
        height: 33px;
      }
      .jumpM {
        display: inline-block;
      }
    }
  }
}

.proList {
  width: 253px;
  height: 94%;
  position: absolute;
  right: 16px;
  bottom: 0;
  z-index: 9;
  background: linear-gradient(90deg, #132748 0%, #0e1a32 100%);
  // border: 1px solid rgba(255, 255, 255, 0.16);
  padding: 10px;
  display: flex;
  flex-direction: column;
  .proUl {
    height: 0;
    flex: 1;
    overflow: hidden;
    .pro {
      display: flex;
      align-items: center;
      padding: 10px 0;
      .icon {
        width: 41px;
        height: 33px;
        &.hide {
          visibility: hidden;
        }
      }
      em {
        font-style: normal;
        font-size: 16px;
        color: #eff5ff;
        margin: 0 10px 0 0;
      }
      span {
        font-size: 16px;
        color: #eff5ff;
        width: 0;
        flex: 1;
        line-height: 1.3;
      }
    }
  }

  & > i {
    position: absolute;
    width: 12px;
    height: 12px;
    display: inline-block;
    background-repeat: no-repeat;
    background-size: 100% 100%;
  }

  & > i:nth-child(1) {
    left: 0;
    top: 0;
  }

  & > i:nth-child(2) {
    top: 0;
    right: 0;
    transform: rotateY(180deg);
  }

  & > i:nth-child(3) {
    bottom: 0;
    right: 0;
    transform: rotateX(180deg) rotateY(180deg);
  }

  & > i:nth-child(4) {
    bottom: 0;
    left: 0;
    transform: rotateX(180deg);
  }
}
.leftItemTittle {
  display: flex;
  align-items: center;
  justify-content: center;
  &::before {
    content: "";
    display: block;
    width: 45px;
    height: 9px;
    background-size: 100% auto;
  }
  &::after {
    content: "";
    display: block;
    width: 45px;
    height: 9px;
    background-size: 100% auto;
    transform: rotate(180deg);
  }
  .tit {
    font-size: 18px;
    color: #f0f6ff;
    margin: 0 20px;
  }
}
.clire1 {
  width: 10px;
  height: 10px;
  border: 1px solid rgba(185, 128, 49, 1);
  background: rgba(185, 128, 49, 1);
  border-radius: 50%;
}
.clire2 {
  width: 10px;
  height: 10px;
  border: 1px solid rgba(185, 128, 49, 0.8);
  background: rgba(185, 128, 49, 0.8);
  border-radius: 50%;
}
</style>
<style>
.amap-info-sharp {
  display: none;
}
.amap-info-close {
  display: none;
}
</style>
echarts大地图
<template>
  <div class="charts">
    <div
      class="mapView"
      v-loading="loading"
      element-loading-background="rgba(24, 41, 88, 0)"
      id="mapView"
    ></div>
    <div class="entTit" v-if="entName">
      <p @click="jumpEntInfo">{{ entName }}</p>
    </div>
  </div>
</template>

<script>
import AMapLoader from "@amap/amap-jsapi-loader";
import { 数据接口 } from "../";
export default {
  data() {
    return {
      loading: false,
      layer: null,
      list: {
        regcap: "",
        num: ""
      },
      AMap: null, //地图对象
      params: {
        linkCode: null
      },
      entName: "",
      mapText: ""
    };
  },
  computed: {
    industryCode() {
      return this.$store.getters.list;
    }
  },
  watch: {
    // eslint-disable-next-line no-unused-vars
    industryCode: function(newVal) {
      if (this.params.linkCode !== newVal.code) {
        this.params.linkCode = newVal.code;
        this.layer ? this.layer.destroy() : "";
        this.graphMaker();
      }
    }
  },
  mounted() {
    this.mapLoad();
  },
  methods: {
    mapLoad() {
      let _this = this;
      _this.loading = true;
      AMapLoader.load({
        key: "", // 申请好的Web端开发者Key,首次调用 load 时必填
        version: "2.0", // 指定要加载的 JSAPI 的版本,缺省时默认为 1.4.15
        plugins: ["AMap.DistrictSearch", "AMap.PolyEditor"], // 需要使用的的插件列表,如比例尺'AMap.Scale'等
        AMapUI: {
          // 是否加载 AMapUI,缺省不加载
          version: "1.1", // AMapUI 缺省 1.1
          plugins: [] // 需要加载的 AMapUI ui插件
        },
        Loca: {
          // 是否加载 Loca, 缺省不加载
          version: "2.0" // Loca 版本,缺省 1.3.2
        }
      })
        .then(AMap => {
          _this.AMap = new AMap.Map("mapView", {
            center: ["120.309635", "31.544210"],
            mapStyle: "amap://styles/fcf38950521355c7e95ad763c1837073", //设置地图的显示样式
            features: ["bg", "road"],
            viewMode: "3D",
            pitch: 60,
            zoom: _this.$width > 3000 ? 13 : 13
          });
          _this.AMap.on("complete", function() {
            _this.maskView();
            _this.AMap.on("click", function(e) {
              const feat = _this.layer.queryFeature(e.pixel.toArray());
              if (!feat) {
                _this.entName = "";
                _this.mapText ? _this.mapText.hide() : "";
                return;
              } else {
                _this.entNameFun({ KEY: feat.coordinates.join(",") });
              }
            });


          });
        })
        .catch(e => {
          console.log(e);
        });
    },

    //面
    maskView() {
      let _this = this;
      var loca = (window.loca = new Loca.Container({
        map: _this.AMap
      }));
      loca.ambLight = {
        intensity: 0.3,
        color: "#fff"
      };
      loca.dirLight = {
        intensity: 0.6,
        color: "#fff",
        target: [0, 0, 0],
        position: [0, -1, 1]
      };
      loca.pointLight = {
        color: "rgb(100,100,100)",
        position: [120.24289, 30.341335, 20000],
        intensity: 3,
        // 距离表示从光源到光照强度为 0 的位置,0 就是光不会消失。
        distance: 50000
      };

      // 行政区划查询
      var opts = {
        subdistrict: 1, //返回下一级行政区
        extensions: "all",
        showbiz: false //最后一级返回街道信息
      };
      // eslint-disable-next-line no-undef
      let district = new AMap.DistrictSearch(opts); //注意:需要使用插件同步下发功能才能这样直接使用
      district.search("中国", function(status, result) {
        if (status == "complete") {
          // eslint-disable-next-line no-undef
          new AMap.Polygon({
            map: _this.AMap,
            bubble: true,
            strokeWeight: 1,
            strokeColor: "rgba(0, 255, 252, 0)",
            // strokeOpacity: 0.1,
            fillColor: "#044e73",
            fillOpacity: 0.5, // 面积越大透明度越高
            path: result.districtList[0].boundaries
          });

          let listN = [],
            listOld = result.districtList[0].boundaries[0];
          for (let index = 0; index < listOld.length; index++) {
            const element = listOld[index];
            listN.push([element.lng, element.lat]);
          }
          let jsonA = {
            type: "FeatureCollection",
            features: [
              {
                type: "Feature",
                properties: {
                  name: "111",
                  value: 37,
                  health: 0.62611111965,
                  zylsd: 40.959111111447
                },
                geometry: {
                  type: "",
                  coordinates: [listN]
                }
              }
            ]
          };
          var geo = new Loca.GeoJSONSource({
            data: jsonA
          });

          // eslint-disable-next-line no-undef
          var pl = new Loca.PolygonLayer({
            // loca,
            zIndex: 120,
            opacity: 1,
            // cullface: 'none',
            shininess: 10,
            hasSide: true
          });

          pl.setSource(geo);
          pl.setStyle({
            topColor: "rgba(86, 219, 255, 0.8)",
            sideTopColor: "rgba(0, 255, 252, 0.6)",
            sideBottomColor: "rgba(3, 33, 71,1)",
            height: 500,
            altitude: 0
          });
          loca.add(pl);
        }
      });
    },
    //点
    async graphMaker() {
      this.loading = true;
      let { data } = await 数据接口(this.params);
      this.markerLoad(data);
    },
    async markerLoad(data) {
      let that = this;
      let listOld = data,
        jsonM = {
          type: "FeatureCollection",
          features: []
        },
        listNew = [];
      for (let index = 0; index < listOld.length; index++) {
        let element = listOld[index];
        let jwd = element.KEY.split(",");
        listNew.push({
          type: "Feature",
          properties: {
            consume: null
          },
          geometry: {
            type: "Point",
            coordinates: jwd
          }
        });
      }
      jsonM.features = listNew;
      // eslint-disable-next-line no-undef
      var geo = new Loca.GeoJSONSource({
        data: jsonM
      });
      // eslint-disable-next-line no-undef
      var loca = new Loca.Container({
        map: that.AMap
      });
      // eslint-disable-next-line no-undef
      that.layer = new Loca.PointLayer({
        zIndex: 1000
      });
      that.layer.setSource(geo);

      that.layer.setStyle({
        radius: 5,
        unit: "px",
        color: "rgba(237, 197, 67, 1)",
        borderWidth: 0,
        blurWidth: 3
      });

      loca.add(that.layer);

      that.loading = false;
      that.layer.show();
      that.entName = "";
      that.mapText ? that.mapText.hide() : "";
    },
    async entNameFun(params) {
      let _this = this;
      let res = await getEntByGis(params);
      if (res.data.ENTNAME.length > 0) {
        _this.mapText ? _this.mapText.hide() : "";
        // _this.entName = res.data.ENTNAME[0];

        // 创建纯文本标记
        // eslint-disable-next-line no-undef
        var text = new AMap.Text({
          text: res.data.ENTNAME[0],
          anchor: "center", // 设置文本标记锚点
          draggable: true,
          cursor: "pointer",
          // eslint-disable-next-line no-undef
          offset: new AMap.Pixel(0, -30),
          style: {
            background: " #363f49",
            color: "#ffffff",
            padding: "0.5vw",
            border: "0 none",
            // "min-width": "200px",
            "font-size": "0.9em"
          },
          position: params.KEY.split(",")
        });

        text.setMap(_this.AMap);

        text.on("click", function() {
          _this.jumpEntInfo(res.data.ENTNAME[0]);
        });
        _this.mapText = text;
      }
    },
    jumpEntInfo(ent) {
      const { href } = this.$router.resolve({
        path: "跳转",
        query: { entName: ent }
      });
      window.open(href, "_blank");
    }
  }
};
</script>

<style lang="less" scoped>
.charts,
.mapView {
  width: 100%;
  height: 100%;
  position: relative;
}
.entTit {
  position: absolute;
  right: 0.78vw;
  top: 0.78vw;
  background: #363f49;
  color: #c7cdd8;
  padding: 0.5vw;
  min-width: 200px;
  font-size: 0.9em;
  z-index: 99;
  &:hover {
    color: #72baff;
    cursor: pointer;
  }
}
</style>
地图>默认全国地图,点击省份之后切成省份地图

这个需要用eventbus传参,传一个点击之后的状态
代码片段1:主要页面引用
<template>
    <div class="maps">
            <ChartMap v-show="mapShow == true"></ChartMap>
            <ChartRight v-show="mapShow == false"></ChartRight>
          </div>
</template>

<script>
import ChartMap from "./components/ChartMap.vue"; //地图
import ChartRight from "./components/ChartRight.vue"; //地图-省
export default {
  components: { ChartMap, ChartRight },
  data() {
    return {
      mapShow: true, //控制map地图显示

    };
  },
  mounted() {
    //从地图传过来 显示全国地图还是省份地图
    this.$bus.$on("areaChangsFlag", function(data) {
      _this.mapShow = data;
    });
    //从地图传过来 显示右侧列表的数(全国 )
    this.$bus.$on("areaListDataMap", function(data) {
      _this.tableData = data;
      _this.tableData.forEach((item, index) => {
        item.id = index;
      });
    });
    //从地图传过来 显示右侧列表的数(省内 )
    this.$bus.$on("areaListDataMapRight", function(data) {
      _this.tableDataRight = data;
      _this.tableDataRight.forEach((item, index) => {
        item.id = index;
        item.highlight = false;
      });
    });
    //从地图传过来 显示右侧列表的数(省 )这个是如果省份点击了,就传过来高亮显示点击的哪一行 否则就取消掉高亮
    this.$bus.$on("areaPosition", function(area) {
      if (area.areaValue) {
        _this.locateRow(area.areaValue, area.flag);
      } else {
        _this.locateRow("", area.flag);
      }
    });
  },
  }
  。。。。。
  </script>
代码片段2:全国地图
<template>
  <div
    class="maps"
    id="china"
    v-loading="loading"
    element-loading-background="rgba(24, 41, 88, 0)"
  ></div>
</template>

<script>
import { getGeoJson } from "@/api/app";
import { 接口} from "@/api/";
import { tempNum } from "@/utils/index";
// import {  } from "../chanye";
export default {
  props: {
    code: { type: String }
  },
  data() {
    return {
      chart: null,
      maxValue: 0,
      minValue: 0,
      loading: false,
      linkCode: "",
      DJ: [],
      pojectParams: {},
      paramsType: "",
      paramsLinkCode: ""
    };
  },
  watch: {
    paramsType() {
      this.$bus.$emit("areaChang", {
        linkCode: this.linkCode
      });
    },
    paramsLinkCode() {
      this.$bus.$emit("areaChang", {
        linkCode: this.linkCode
      });
    }
  },
  mounted() {
    let _this = this;
    this.chart = this.$echarts.init(document.getElementById("china"));
    window.addEventListener("resize", function() {
      _this.chartResize();
    });

    this.$bus.$on("tomaps", pamas => {
      this.getLoad(pamas);
    });
  },
  methods: {
    chartResize() {
      if (this.chart) {
        this.chart.resize();
      }
    },
    async getLoad(pamas) {
      this.loading = true;
      this.linkCode = pamas;
      this.paramsType = pamas.type;
      this.paramsLinkCode = pamas.linkCode;
      let { data } = await 接口({
      });
      let arrs = [];
      for (let i = 0; i < data.area.length; i++) {
        arrs.push({
          code: data.area[i].CODE,
          name: data.area[i].NAME,
          value: data.area[i].VALUE
        });
      }
      if (data.list) {
        this.$bus.$emit("areaListDataMap", data.list);
      }
      this.getGeo(arrs);
    },
    async getGeo(list) {
      console.log("mapdatasssssssssssssssss", list);
      let $this = this;
      let data = await getGeoJson("100000");
      this.loading = false;
      this.$echarts.registerMap("china", data);
      let option = {
        tooltip: {
          trigger: "item",
          confine: true,
          className: "echarts-tooltip",
          formatter: item => {
            let dw = "";
            let html = item;
            html = `${item.name}<br/>
            ${item.marker}${this.linkCode.name}:${tempNum(
              html.value
            )}(${dw})<br/>`;
            return html;
          }
        },

        series: [
          {
            type: "map",
            map: "china",
            roam: false,
            data: list,
            layoutCenter: ["50%", "42%"],
            // 如果宽高比大于 1 则宽度为 100,如果小于 1 则高度为 100,保证了不超过 100x100 的区域
            layoutSize: "95%",
            itemStyle: {
              areaColor: "#fdfdfd",
              borderColor: "#1b5eeb",
              shadowColor: "#092f8f", //外发光
              shadowBlur: 0
            },
            emphasis: {
              itemStyle: {
                areaColor: "rgba(255, 217, 3, 1)"
              }
            },
            select: {
              itemStyle: {
                borderColor: "#f18355",
                borderWidth: "2",
                areaColor: "yellow"
              }
            }
          }
        ]
      };
      if (list.length > 0) {
        let num1 = 0,
          num2 = 0,
          num3 = 0,
          num4 = 0;
        let len = list.length - 1;
        for (let index = 0; index < list.length; index++) {
          const element = list[index];
          // console.log(element);
          if (index == Math.ceil((len / 100) * 10)) {
            num1 = Math.round(element.value / 10) * 10;
            // console.log()
          }
          if (index == Math.ceil((len / 100) * 20)) {
            num2 = Math.round(element.value / 10) * 10;
            // console.log(len, index, num2);
          }
          if (index == Math.ceil((len / 100) * 30)) {
            num3 = Math.round(element.value / 10) * 10;
            // console.log(len, index, num3);
          }
          if (index == Math.floor((len / 100) * 65)) {
            num4 = Math.round(element.value / 10) * 10;
            // console.log(len, index, num4);
          }
        }
        // console.log(piecess);
        option["visualMap"] = {
          type: "piecewise",
          min: Math.floor(list[list.length - 1].value * 1),
          max: Math.ceil(list[0].value * 1),
          pieces: [
            { gt: num1, color: "#f4000b" }, // (1000, Infinity]
            { gt: num2, lte: num1, color: "#f75d0d" }, // (310, 1000]
            { gt: num3, lte: num2, color: "#fc8889" }, // (200, 300]
            { gt: num4, lte: num3, color: "#7affcf" }, // (10, 200]
            { lt: num4, color: "#0556ff" } // (-Infinity, 5)
          ],
          // min: this.minValue || 0,
          // max: this.maxValue || 0,
          // splitNumber: 5,
          // pieces: piecess,
          show: true,
          inverse: false,
          align: "left",
          right: 30,
          bottom: 20,
          itemHeight: 8,
          itemWidth: 10,
          textStyle: {
            color: "#fff",
            fontSize: 10
          },
          inRange: {
            color: [
              "rgba(244, 0, 11,1)",
              "#76D5FF",
              "#00B1FF",
              "#0F5EEC",
              "#0D16D2"
            ]
          },
          outOfRange: {
            color: ["#064267"]
          }
        };
      }

      this.chart.setOption(option, true);
      this.chart.on("click", function(params) {
        if (params.data) {
          $this.$bus.$emit("areaChangsFlag", false);
          if (params) {
            $this.$bus.$emit("areaChang", {
              areaName: params.data.name,
              areaValue: params.data.code,
              linkCode: $this.linkCode
            });
          }
        }
      });
    }
  }

  // destroyed() {
  //   if (this.chart) {
  //     this.chart.dispose();
  //   }
  // },
};
</script>

<style lang="less" scoped>
.maps {
  width: 100%;
  height: 100%;
}
::v-deep .tooltipClass {
  padding-right: 20px !important;
  display: none;
  // width: 200px;
  height: 77px;
  background-size: 100% 100%;
  border: 0px solid rgba(22, 40, 77, 0) !important;
  // background: linear-gradient(-9deg, rgba(22, 40, 77, 0.65) 0%, #050d1f 98%);
  // background: url("../../img/echartsToolTip.png");
  background-color: inherit !important;
  background-size: 100% 100%;
  // opacity: 0.8;
  .blocks {
    .blocksContent {
      margin-left: 13px;
      margin-top: 7px;
      height: 33px;
      font-size: 10px;
      font-family: Source Han Sans CN;
      font-weight: 400;
      color: rgba(255, 255, 255, 1);
      line-height: 18px;
      .blocksvalue {
        display: inline-block;
      }
    }
  }
}
</style>
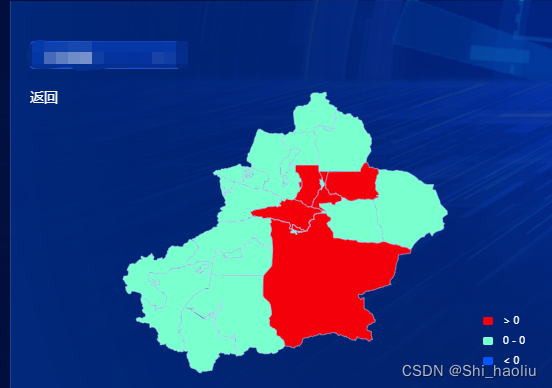
代码片段4:省内地图
<template>
  <div style="height:100%">
    <div class="topButton" @click="goback()">返回</div>
    <div
      class="map"
      id="chinaRight"
      v-loading="loading"
      element-loading-background="rgba(24, 41, 88, 0)"
    ></div>
  </div>
</template>

<script>
import { getGeoJson } from "@/api/app";
import { 接口} from "@/api/";
import { tempNum } from "@/utils/index";
export default {
  data() {
    return {
      chart: null,
      maxValue: 0,
      minValue: 0,
      loading: false,
      parentParams: {
        areaCode: "",
        linkCode: "",
        type: ""
      },
      parentData: ""
    };
  },
  mounted() {
    let _this = this;

    this.chart = this.$echarts.init(document.getElementById("chinaRight"));
    window.addEventListener("resize", function() {
      _this.chartResize();
    });

    this.$bus.$on("areaChang", pamas => {
      if (pamas.areaValue) {
        _this.parentParams.areaValue = pamas.areaValue;
      }
      _this.parentParams.linkCode = pamas.linkCode;
      _this.parentParams.type = pamas.linkCode.type;
      if (_this.parentParams.areaValue) {
        this.getLoad();
      }
    });
  },
  methods: {
    chartResize() {
      if (this.chart) {
        this.chart.resize();
      }
    },
    goback() {
      this.$bus.$emit("areaChangsFlag", true);
      this.$bus.$emit("areaPosition", {
        flag: true
      });
    },
    async getLoad() {
      this.loading = true;
      // this.loading = true;

      let { data } = await 接口({
      });
      let arrs = [];
      for (let i = 0; i < data.area.length; i++) {
        arrs.push({
          code: data.area[i].CODE,
          name: data.area[i].NAME,
          value: data.area[i].VALUE
        });
      }
      let mapList = [];
      data.area.forEach(function(item) {
        mapList.push(item.value);
      });
      this.maxValue = Math.max(...mapList);
      this.minValue = Math.min(...mapList);
      if (data.list) {
        this.$bus.$emit("areaListDataMapRight", data.list);
      }
      this.getGeo(arrs);
    },
    async getGeo(list) {
      let data = await getGeoJson(this.parentParams.areaValue);
      this.loading = false;
      this.$echarts.registerMap(this.parentParams.areaValue, data);
      let option = {
        grid: { top: 0, bottom: 0, right: 0, left: 0, containLabel: true },
        tooltip: {
          trigger: "item",
          confine: true,
          className: "echarts-tooltip",
          formatter: item => {
            let dw = "";

            let html = item;
            html = `${item.name}<br/>
            ${item.marker}${this.parentParams.linkCode.name}:${tempNum(
              html.value
            )}(${dw})<br/>`;
            return html;
          }
        },
        series: [
          {
            type: "map",
            map: this.parentParams.areaValue,
            roam: false,
            data: list,
            layoutCenter: ["50%", "42%"],
            // 如果宽高比大于 1 则宽度为 100,如果小于 1 则高度为 100,保证了不超过 100x100 的区域
            layoutSize: "95%",
            selectedMode: false,
            itemStyle: {
              areaColor: "#fdfdfd",
              borderColor: "#bbcff9",
              shadowColor: "#092f8f", //外发光
              shadowBlur: 0
            },
            emphasis: {
              itemStyle: {
                areaColor: "rgba(255, 217, 3, 1)"
              }
            },
            select: {
              itemStyle: {
                // areaColor: "rgba(255, 217, 3, 1)",
                // color: "rgba(255, 217, 3, 1)"
                borderColor: "#f18355",
                borderWidth: "2",
                areaColor: "yellow"
              }
            }
          }
        ]
      };
      if (list.length > 0) {
        let num1 = 0,
          num2 = 0,
          num3 = 0,
          num4 = 0;
        let len = list.length - 1;
        for (let index = 0; index < list.length; index++) {
          const element = list[index];
          // console.log(element);
          if (index == Math.ceil((len / 100) * 10)) {
            num1 = Math.round(element.value / 10) * 10;
            // console.log()
          }
          if (index == Math.ceil((len / 100) * 20)) {
            num2 = Math.round(element.value / 10) * 10;
            // console.log(len, index, num2);
          }
          if (index == Math.ceil((len / 100) * 30)) {
            num3 = Math.round(element.value / 10) * 10;
            // console.log(len, index, num3);
          }
          if (index == Math.floor((len / 100) * 65)) {
            num4 = Math.round(element.value / 10) * 10;
            // console.log(len, index, num4);
          }
        }
        // console.log(piecess);
        option["visualMap"] = {
          type: "piecewise",
          min: Math.floor(list[list.length - 1].value * 1),
          max: Math.ceil(list[0].value * 1),
          pieces: [
            { gt: num1, color: "#f4000b" }, // (1000, Infinity]
            { gt: num2, lte: num1, color: "#f75d0d" }, // (310, 1000]
            { gt: num3, lte: num2, color: "#fc8889" }, // (200, 300]
            { gt: num4, lte: num3, color: "#7affcf" }, // (10, 200]
            { lt: num4, color: "#0556ff" } // (-Infinity, 5)
          ],
          // min: this.minValue || 0,
          // max: this.maxValue || 0,
          // splitNumber: 5,
          // pieces: piecess,
          show: true,
          inverse: false,
          align: "left",
          right: 30,
          bottom: 20,
          itemHeight: 8,
          itemWidth: 10,
          textStyle: {
            color: "#fff",
            fontSize: 10
          },
          inRange: {
            color: [
              "rgba(244, 0, 11,1)",
              "#76D5FF",
              "#00B1FF",
              "#0F5EEC",
              "#0D16D2"
            ]
          },
          outOfRange: {
            color: ["#064267"]
          }
        };
      }
      this.chart.setOption(option, true);
      let $this = this;
      this.chart.on("click", function(params) {
        if (params) {
          $this.$bus.$emit("areaPosition", {
            areaName: params.data.name,
            areaValue: params.data.code,
            flag: false
          });
        }
      });
      this.chartResize();
    }
  },
  destroyed() {
    if (this.chart) {
      this.chart.dispose();
    }
  }
};
</script>

<style lang="less" scoped>
.map {
  width: 100%;
  height: 100%;
}
::v-deep .tooltipClass {
  padding-right: 20px !important;
  display: none;
  // width: 200px;
  height: 77px;
  background-size: 100% 100%;
  border: 0px solid rgba(22, 40, 77, 0) !important;
  background-color: inherit !important;
  background-size: 100% 100%;
  .blocks {
    .blocksContent {
      margin-left: 13px;
      margin-top: 7px;
      height: 33px;
      font-size: 10px;
      font-family: Source Han Sans CN;
      font-weight: 400;
      color: rgba(255, 255, 255, 1);
      line-height: 18px;
      .blocksvalue {
        display: inline-block;
      }
    }
  }
}
.topButton {
  z-index: 100;
  width: 30px;
  position: absolute;
  margin-left: 20px;
  font-size: 14px;
  color: #fff;
  cursor: pointer;
}
</style>
代码片段5:地图合并
·点击全国地图切换到省级地图,点击返回切换到全国地图·
<template>
  <div style="height:100%">
    <div class="topButton" v-show="!QGorSF" @click="goback()">返回</div>
    <div
      class="map"
      id="chinaRight"
      v-loading="loading"
      element-loading-background="rgba(24, 41, 88, 0)"
    ></div>
  </div>
</template>

<script>
import { getGeoJson } from "@/api/app";
import { 接口} from "@/api/";
import { tempNum } from "@/utils/index";
export default {
  data() {
    return {
      chart: null,
      chartOne: null,
      maxValue: 0,
      minValue: 0,
      loading: false,
      parentParams: {
        areaCode: "",
        linkCode: "",
        type: ""
      },
      areaCodeFlag: true,
      parentData: "",
      QGorSF: true
    };
  },
  watch: {
    QGorSF(newValue) {
      console.log(newValue);
      if (newValue) {
        this.getLoadQG(this.linkCode);
      } else {
        this.getLoad();
      }
    }
  },
  mounted() {
    let _this = this;
    this.chart = this.$echarts.init(document.getElementById("chinaRight"));
    window.addEventListener("resize", function() {
      _this.chartResize();
    });
    //收到父级的传参,渲染areaCodeFlag
    this.$bus.$on("tomaps", pamas => {
      _this.linkCode = pamas;
      if (this.areaCodeFlag) {
        this.getLoadQG(pamas);
      } else {
        this.getLoad();
      }
    });
  },
  methods: {
    chartResize() {
      if (this.chart) {
        this.chart.resize();
      }
    },
    goback() {
      this.QGorSF = true;
      this.areaCodeFlag = true;
      this.$bus.$emit("areaChangsFlag", true);
      this.$bus.$emit("areaPosition", {
        flag: true
      });
    },
    async getLoad() {
      this.loading = true;

      let { data } = await industrialDistribution({
        areaCode: this.parentParams.areaValue,
        linkCode: this.linkCode.linkCode,
        type: this.linkCode.type
      });
      let arrs = [];
      for (let i = 0; i < data.area.length; i++) {
        arrs.push({
          code: data.area[i].CODE,
          name: data.area[i].NAME,
          value: data.area[i].VALUE
        });
      }
      let mapList = [];
      data.area.forEach(function(item) {
        mapList.push(item.value);
      });
      this.maxValue = Math.max(...mapList);
      this.minValue = Math.min(...mapList);
      if (data.list) {
        this.$bus.$emit("areaListDataMapRight", data.list);
      }
      this.getGeo(arrs);
    },
    async getGeo(list) {
      let data = await getGeoJson(this.parentParams.areaValue);

      this.$echarts.registerMap(this.parentParams.areaValue, data);
      let option = {
        grid: { top: 0, bottom: 0, right: 0, left: 0, containLabel: true },
        tooltip: {
          trigger: "item",
          confine: true,
          className: "echarts-tooltip",
          formatter: item => {
            let dw = "";
            if (this.linkCode.name == "企业数量") {
              dw = "户";
            } else if (this.linkCode.name == "注册资本") {
              dw = "亿元";
            } else if (this.linkCode.name == "实缴资本") {
              dw = "亿元";
            } else if (this.linkCode.name == "上市企业") {
              dw = "户";
            } else if (this.linkCode.name == "企业存活率") {
              dw = "%";
            } else if (this.linkCode.name == "产业资本流入") {
              dw = "户";
            } else if (this.linkCode.name == "重点企业成长") {
              dw = "户";
            } else if (this.linkCode.name == "创新主体") {
              dw = "户";
            } else if (this.linkCode.name == "创新成果") {
              dw = "项";
            } else if (this.linkCode.name == "户均创新成果") {
              dw = "项";
            } else if (this.linkCode.name == "高新技术企业") {
              dw = "户";
            } else if (this.linkCode.name == "高新技术企业创新成果") {
              dw = "项";
            } else if (this.linkCode.name == "高新技术企业户均创新成果") {
              dw = "项";
            } else if (this.linkCode.name == "专精特新企业") {
              dw = "户";
            } else if (this.linkCode.name == "专精特新企业创新成果") {
              dw = "项";
            } else if (this.linkCode.name == "专精特新企业户均创新成果") {
              dw = "项";
            } else if (this.linkCode.name == "企业死亡率") {
              dw = "%";
            } else if (this.linkCode.name == "企业失信率") {
              dw = "%";
            }

            let html = item;
            html = `${item.name}<br/>
              ${item.marker}${this.linkCode.name}:${tempNum(
              html.value
            )}(${dw})<br/>`;
            return html;
          }
        },
        series: [
          {
            type: "map",
            map: this.parentParams.areaValue,
            roam: true,
            data: list,
            layoutCenter: ["50%", "42%"],
            // 如果宽高比大于 1 则宽度为 100,如果小于 1 则高度为 100,保证了不超过 100x100 的区域
            layoutSize: "95%",
            selectedMode: false,
            itemStyle: {
              areaColor: "#fdfdfd",
              borderColor: "#bbcff9",
              shadowColor: "#092f8f", //外发光
              shadowBlur: 0
            },
            emphasis: {
              itemStyle: {
                areaColor: "rgba(255, 217, 3, 1)"
              }
            },
            select: {
              itemStyle: {
                // areaColor: "rgba(255, 217, 3, 1)",
                // color: "rgba(255, 217, 3, 1)"
                borderColor: "#f18355",
                borderWidth: "2",
                areaColor: "yellow"
              }
            }
          }
        ]
      };
      if (list.length > 0) {
        let num1 = 0,
          num2 = 0,
          num3 = 0,
          num4 = 0;
        let len = list.length - 1;
        for (let index = 0; index < list.length; index++) {
          const element = list[index];
          // console.log(element);
          if (index == Math.ceil((len / 100) * 10)) {
            num1 = Math.round(element.value / 10) * 10;
            // console.log()
          }
          if (index == Math.ceil((len / 100) * 20)) {
            num2 = Math.round(element.value / 10) * 10;
            // console.log(len, index, num2);
          }
          if (index == Math.ceil((len / 100) * 30)) {
            num3 = Math.round(element.value / 10) * 10;
            // console.log(len, index, num3);
          }
          if (index == Math.floor((len / 100) * 65)) {
            num4 = Math.round(element.value / 10) * 10;
            // console.log(len, index, num4);
          }
        }
        // console.log(piecess);
        option["visualMap"] = {
          type: "piecewise",
          min: Math.floor(list[list.length - 1].value * 1),
          max: Math.ceil(list[0].value * 1),
          pieces: [
            { gt: num1, color: "#f4000b" }, // (1000, Infinity]
            { gt: num2, lte: num1, color: "#f75d0d" }, // (310, 1000]
            { gt: num3, lte: num2, color: "#fc8889" }, // (200, 300]
            { gt: num4, lte: num3, color: "#7affcf" }, // (10, 200]
            { lt: num4, color: "#0556ff" } // (-Infinity, 5)
          ],
          // min: this.minValue || 0,
          // max: this.maxValue || 0,
          // splitNumber: 5,
          // pieces: piecess,
          show: true,
          inverse: false,
          align: "left",
          right: 30,
          bottom: 60,
          itemHeight: 8,
          itemWidth: 10,
          textStyle: {
            color: "#fff",
            fontSize: 10
          },
          inRange: {
            color: [
              "rgba(244, 0, 11,1)",
              "#76D5FF",
              "#00B1FF",
              "#0F5EEC",
              "#0D16D2"
            ]
          },
          outOfRange: {
            color: ["#064267"]
          }
        };
      }
      this.chart.setOption(option, true);
      let $this = this;
      this.chart.on("click", function(params) {
        if (params) {
          $this.$bus.$emit("areaPosition", {
            areaName: params.data.name,
            areaValue: params.data.code,
            flag: false
          });
        }
      });
      this.loading = false;
      this.chartResize();
    },
    async getLoadQG(pamas) {
      this.loading = true;
      this.linkCode = pamas;
      this.paramsType = pamas.type;
      this.paramsLinkCode = pamas.linkCode;
      let { data } = await industrialDistribution({
        areaCode: "",
        linkCode: pamas.linkCode,
        type: pamas.type
      });
      let arrs = [];
      for (let i = 0; i < data.area.length; i++) {
        arrs.push({
          code: data.area[i].CODE,
          name: data.area[i].NAME,
          value: data.area[i].VALUE
        });
      }
      if (data.list) {
        this.$bus.$emit("areaListDataMap", data.list);
      }
      this.getGeoQG(arrs);
    },
    async getGeoQG(list) {
      let $this = this;
      let data = await getGeoJson("100000");
      this.loading = false;
      this.$echarts.registerMap("china", data);
      let option = {
        tooltip: {
          trigger: "item",
          confine: true,
          className: "echarts-tooltip",
          formatter: item => {
            let dw = "";
            if (this.linkCode.name == "企业数量") {
              dw = "户";
            } else if (this.linkCode.name == "注册资本") {
              dw = "亿元";
            } else if (this.linkCode.name == "实缴资本") {
              dw = "亿元";
            } else if (this.linkCode.name == "上市企业") {
              dw = "户";
            } else if (this.linkCode.name == "企业存活率") {
              dw = "%";
            } else if (this.linkCode.name == "产业资本流入") {
              dw = "户";
            } else if (this.linkCode.name == "重点企业成长") {
              dw = "户";
            } else if (this.linkCode.name == "创新主体") {
              dw = "户";
            } else if (this.linkCode.name == "创新成果") {
              dw = "项";
            } else if (this.linkCode.name == "户均创新成果") {
              dw = "项";
            } else if (this.linkCode.name == "高新技术企业") {
              dw = "户";
            } else if (this.linkCode.name == "高新技术企业创新成果") {
              dw = "项";
            } else if (this.linkCode.name == "高新技术企业户均创新成果") {
              dw = "项";
            } else if (this.linkCode.name == "专精特新企业") {
              dw = "户";
            } else if (this.linkCode.name == "专精特新企业创新成果") {
              dw = "项";
            } else if (this.linkCode.name == "专精特新企业户均创新成果") {
              dw = "项";
            } else if (this.linkCode.name == "企业死亡率") {
              dw = "%";
            } else if (this.linkCode.name == "企业失信率") {
              dw = "%";
            }

            let html = item;
            html = `${item.name}<br/>
            ${item.marker}${this.linkCode.name}:${tempNum(
              html.value
            )}(${dw})<br/>`;
            return html;
          }
        },

        series: [
          {
            type: "map",
            map: "china",
            roam: true,
            data: list,
            layoutCenter: ["50%", "42%"],
            // 如果宽高比大于 1 则宽度为 100,如果小于 1 则高度为 100,保证了不超过 100x100 的区域
            layoutSize: "95%",
            itemStyle: {
              areaColor: "#fdfdfd",
              borderColor: "#1b5eeb",
              shadowColor: "#092f8f", //外发光
              shadowBlur: 0
            },
            emphasis: {
              itemStyle: {
                areaColor: "rgba(255, 217, 3, 1)"
              }
            },
            select: {
              itemStyle: {
                // areaColor: "rgba(255, 217, 3, 1)",
                // color: "rgba(255, 217, 3, 1)",
                // color: "#0F5EEC",
                borderColor: "#f18355",
                borderWidth: "2",
                areaColor: "yellow"
              }
            }
          }
        ]
      };
      if (list.length > 0) {
        let num1 = 0,
          num2 = 0,
          num3 = 0,
          num4 = 0;
        let len = list.length - 1;
        for (let index = 0; index < list.length; index++) {
          const element = list[index];
          // console.log(element);
          if (index == Math.ceil((len / 100) * 10)) {
            num1 = Math.round(element.value / 10) * 10;
            // console.log()
          }
          if (index == Math.ceil((len / 100) * 20)) {
            num2 = Math.round(element.value / 10) * 10;
            // console.log(len, index, num2);
          }
          if (index == Math.ceil((len / 100) * 30)) {
            num3 = Math.round(element.value / 10) * 10;
            // console.log(len, index, num3);
          }
          if (index == Math.floor((len / 100) * 65)) {
            num4 = Math.round(element.value / 10) * 10;
            // console.log(len, index, num4);
          }
        }
        // console.log(piecess);
        option["visualMap"] = {
          type: "piecewise",
          min: Math.floor(list[list.length - 1].value * 1),
          max: Math.ceil(list[0].value * 1),
          pieces: [
            { gt: num1, color: "#f4000b" }, // (1000, Infinity]
            { gt: num2, lte: num1, color: "#f75d0d" }, // (310, 1000]
            { gt: num3, lte: num2, color: "#fc8889" }, // (200, 300]
            { gt: num4, lte: num3, color: "#7affcf" }, // (10, 200]
            { lt: num4, color: "#0556ff" } // (-Infinity, 5)
          ],
          // min: this.minValue || 0,
          // max: this.maxValue || 0,
          // splitNumber: 5,
          // pieces: piecess,
          moveHandle: {
            show: true
          },

          show: true,
          inverse: false,
          align: "left",
          right: 30,
          bottom: 60,
          itemHeight: 8,
          itemWidth: 10,
          textStyle: {
            color: "#fff",
            fontSize: 10
          },
          inRange: {
            color: [
              "rgba(244, 0, 11,1)",
              "#76D5FF",
              "#00B1FF",
              "#0F5EEC",
              "#0D16D2"
            ]
          },
          outOfRange: {
            color: ["#064267"]
          }
        };
      }

      this.chart.setOption(option, true);
      this.chart.on("click", function(params) {
        $this.areaCodeFlag = false;
        if (params.data) {
          if (params) {
            if ($this.QGorSF) {
              $this.$bus.$emit("areaChangsFlag", false);
              $this.parentParams.areaValue = params.data.code;
            }
          }
        }
        $this.QGorSF = false;
      });

      this.chartResize();
    }
  },
  destroyed() {
    if (this.chart) {
      this.chart.dispose();
    }
  }
};
</script>

<style lang="less" scoped>
.map {
  width: 100%;
  height: 100%;
}
::v-deep .tooltipClass {
  padding-right: 20px !important;
  display: none;
  // width: 200px;
  height: 77px;
  background-size: 100% 100%;
  border: 0px solid rgba(22, 40, 77, 0) !important;
  background-color: inherit !important;
  background-size: 100% 100%;
  // opacity: 0.8;
  .blocks {
    .blocksContent {
      margin-left: 13px;
      margin-top: 7px;
      height: 33px;
      font-size: 10px;
      font-family: Source Han Sans CN;
      font-weight: 400;
      color: rgba(255, 255, 255, 1);
      line-height: 18px;
      .blocksvalue {
        display: inline-block;
      }
    }
  }
}
.topButton {
  z-index: 100;
  width: 30px;
  position: absolute;
  margin-left: 20px;
  font-size: 14px;
  color: #fff;
  cursor: pointer;
}
</style>


 7254
7254


 被折叠的 条评论
为什么被折叠?
被折叠的 条评论
为什么被折叠?
 到【灌水乐园】发言


