


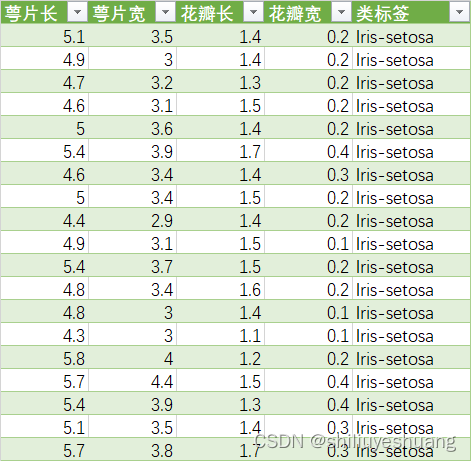
Iris 数据含有两类数据,其中萼片长、萼片宽、花瓣长、花瓣宽为连续性数据。鸢尾花的种类为分类型数据。
下面是简单的计算并分析(花瓣长与萼片长)。
数据量较小,无缺失值、异常值等,因此未作相关的预处理。
import numpy as np
from sklearn import linear_model
vir_x = vir.iloc[:,0:1] #萼片长
vir_y = vir["花瓣长"]

#线性回归
reg = linear_model.LinearRegression()
#拟合数据
reg.fit(vir_x,vir_y)
#R²
reg.score(vir_x,vir_y)
计算得出R² = 0.746,说明花瓣长于萼片长相关性较高。
做一个简单绘图
import matplotlib.pyplot as plt

plt.subplots(1,2,figsize =(12,8))

plt.subplot(121)
r2 = reg.score(vir_x,vir_y);
plt.plot(vir_y,reg.predict(vir_x),"o",label = r2)
plt.legend()

plt.subplot(122)
#计算残差
resid = vir_y -reg.predict(vir_x)
#将残差进行标准化处理
z_resid = (resid - np.mean(resid))/np.std(resid)
plt.plot(reg.predict(vir_x),z_resid,"o",label = "残差图")
plt.legend()
绘图如下:

鸢尾花的数据来源于:鸢尾花


 4万+
4万+

 被折叠的 条评论
为什么被折叠?
被折叠的 条评论
为什么被折叠?
 到【灌水乐园】发言


