


 文章介绍了在MATLAB中如何处理绘图时正负部分需要分开赋色的情况,特别是当中心点不是数值0时。通过提供的工具函数`setPivot`,可以调整颜色图的中心点,使得颜色分布更加符合需求。文章提供了多个示例,包括自定义colormap和插值方法,展示了如何应用这个功能。
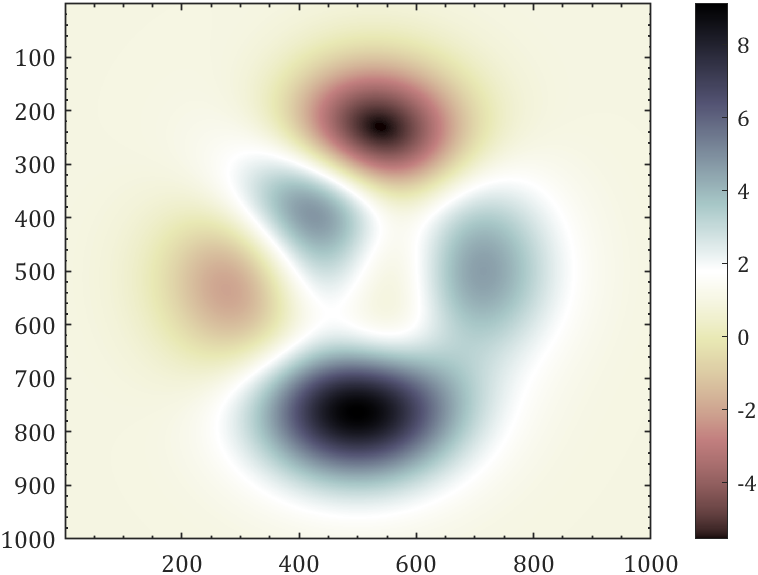
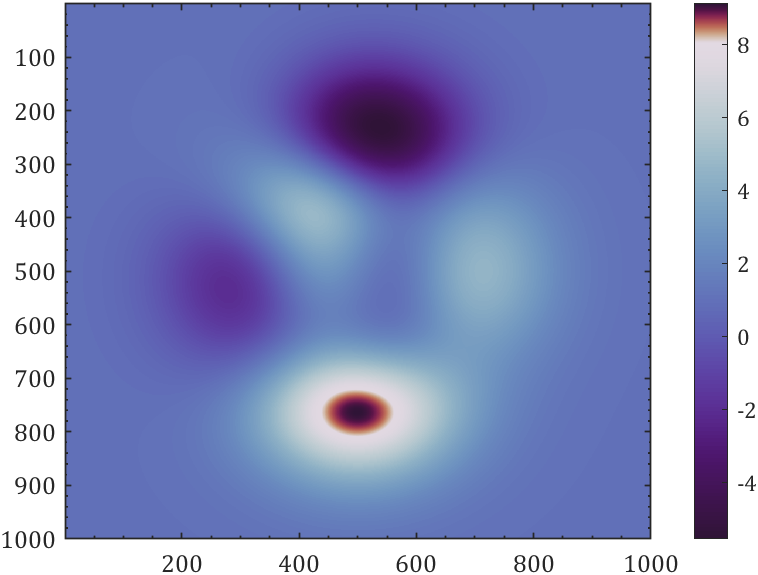
本期讲有一些绘图时正负部分需要分开赋予颜色,这时候双向colormap的中心对应的可能并不是数值0,该咋办,就比如下面的情况:

事先说明,为了绘图好看,本文中全部示例都在代码最后用了以下这个简单函数进行修饰:
function defualtAxes
ax=gca;hold on;box on
% ax.XGrid='on';
% ax.YGrid='on';
ax.XMinorTick='on';
ax.YMinorTick='on';
ax.LineWidth=.8;
ax.GridLineStyle='-.';
ax.FontName='Cambria';
ax.FontSize=12;
end
工具函数
由于代码比较短,这次工具函数就放在最前面了:
可以通过:
- setPivot(n)
- setPivot(ax,n)
等形式使用:
function setPivot(varargin)
% @author:slandarer
if nargin==0
    ax=gca;pivot=0;
else
    if isa(varargin{1},'matlab.graphics.axis.Axes')
        ax=varargin{1};
        if nargin>1
            pivot=varargin{2};
        else
            pivot=0;
        end
    else
        ax=gca;pivot=varargin{1};
    end
end
try
    CLimit=get(ax,'CLim');
catch
end
try
    CLimit=get(ax,'ColorLimits');
catch
end
% CMap=get(ax,'Colormap');
CMap=colormap(ax);

CLen=[pivot-CLimit(1),CLimit(2)-pivot];
if all(CLen>0)
    [CV,CInd]=sort(CLen);
    CRatio=round(CV(1)/CV(2).*300)./300;
    CRatioCell=split(rats(CRatio),'/');
    if length(CRatioCell)>1
        Ratio=[str2double(CRatioCell{1}),str2double(CRatioCell{2})];
        Ratio=Ratio(CInd);
        N=size(CMap,1);
        CList1=CMap(1:floor(N/2),:);
        CList2=CMap((floor(N/2)+1):end,:);
        if mod(N,2)~=0
            CList3=CList2(1,:);CList2(1,:)=[];
            CInd1=kron((1:size(CList1,1))',ones(Ratio(1)*2,1));
            CInd2=kron((1:size(CList2,1))',ones(Ratio(2)*2,1));
            CMap=[CList1(CInd1,:);repmat(CList3,[Ratio(1)+Ratio(2),1]);CList2(CInd2,:)];
        else
            CInd1=kron((1:size(CList1,1))',ones(Ratio(1),1));
            CInd2=kron((1:size(CList2,1))',ones(Ratio(2),1));
            CMap=[CList1(CInd1,:);CList2(CInd2,:)];
        end
        % set(ax,'Colormap',CMap)
        colormap(ax,CMap);
    end
end
end
示例一
第一个示例就是一开始出现的示例,假如编写了如下代码:
imagesc(peaks(1000)+1)

colormap([pink;flipud(bone)])
colorbar
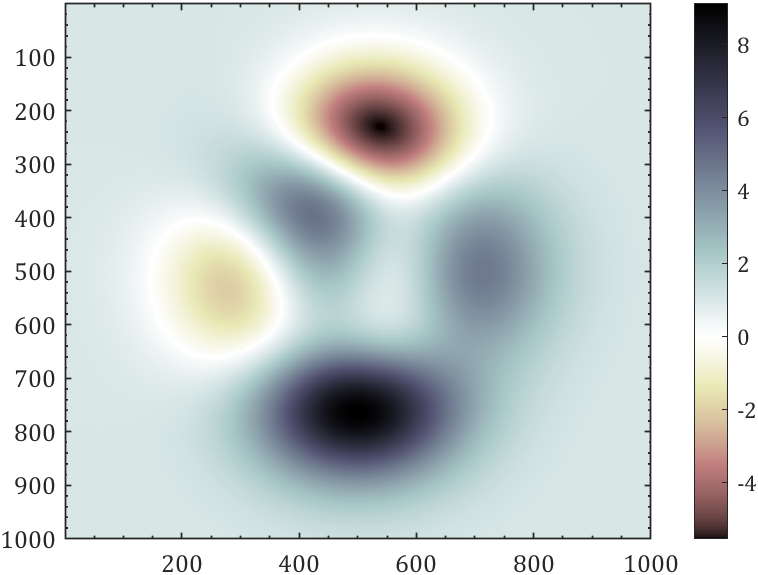
将代码改为:
imagesc(peaks(1000)+1)

colormap([pink;flipud(bone)])
colorbar

% 调整颜色图中点位置
setPivot(0)
当然不只能改为0:
setPivot(7)
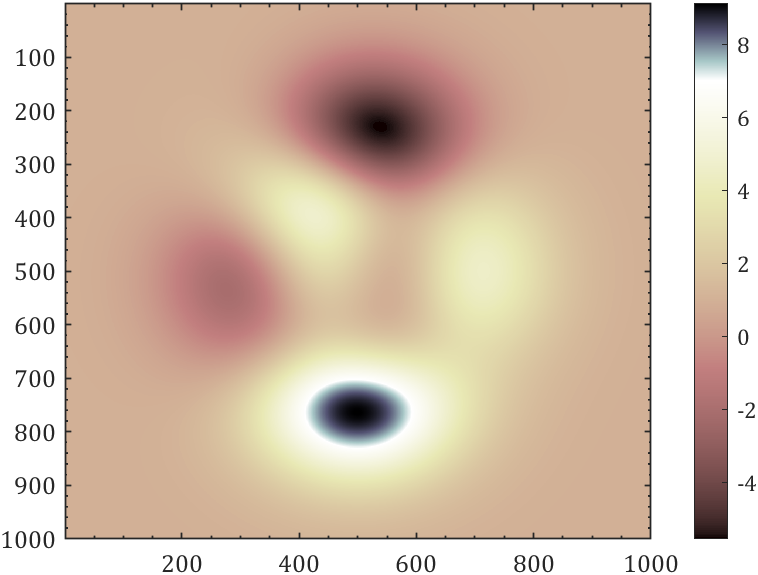
setPivot(-3)

示例二
随便自己弄几个比较离散的颜色:
imagesc(peaks(1000)+1)
% 随便构造一个colormap
CM=[0.1874    0.0771    0.2162
    0.2881    0.0832    0.3962
    0.3604    0.2090    0.6047
    0.3734    0.3827    0.7065
    0.4129    0.5397    0.7472
    0.5390    0.6785    0.7712
    0.7421    0.7976    0.8227
    0.8856    0.8499    0.8857
    0.8391    0.7587    0.7108
    0.7905    0.5986    0.4866
    0.7382    0.4192    0.3485
    0.6433    0.2587    0.3124
    0.4974    0.1354    0.3141
    0.3126    0.0789    0.2669
    0.1849    0.0794    0.2131];
colormap(CM)
colorbar
中心点调到0:
setPivot(0)

当然自己构造的colormap插一下值:
imagesc(peaks(1000)+1)
% 随便构造一个colormap
% 多行颜色插值
CM=[0.1874    0.0771    0.2162
    0.2881    0.0832    0.3962
    0.3604    0.2090    0.6047
    0.3734    0.3827    0.7065
    0.4129    0.5397    0.7472
    0.5390    0.6785    0.7712
    0.7421    0.7976    0.8227
    0.8856    0.8499    0.8857
    0.8391    0.7587    0.7108
    0.7905    0.5986    0.4866
    0.7382    0.4192    0.3485
    0.6433    0.2587    0.3124
    0.4974    0.1354    0.3141
    0.3126    0.0789    0.2669
    0.1849    0.0794    0.2131];
CMX=linspace(0,1,size(CM,1));
CMXX=linspace(0,1,256)';
CM=[interp1(CMX,CM(:,1),CMXX,'pchip'), ...
    interp1(CMX,CM(:,2),CMXX,'pchip'), ...
    interp1(CMX,CM(:,3),CMXX,'pchip')];
colormap(CM)
colorbar

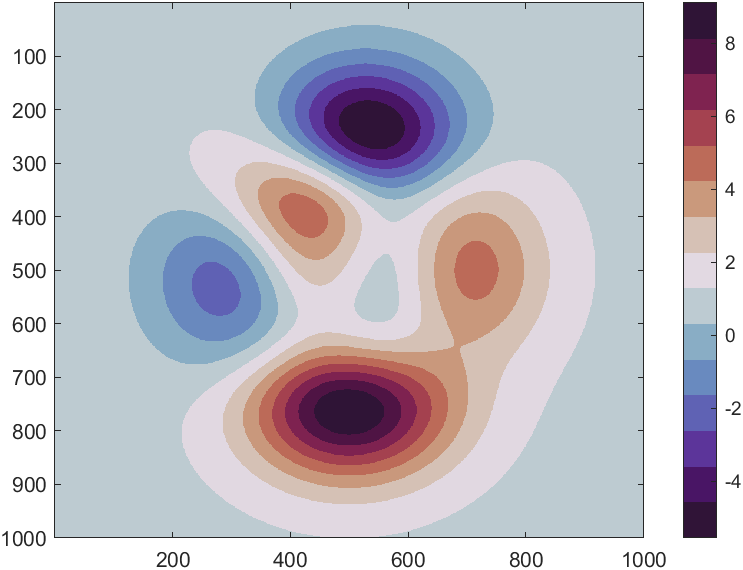
把中点置为8:
setPivot(8)
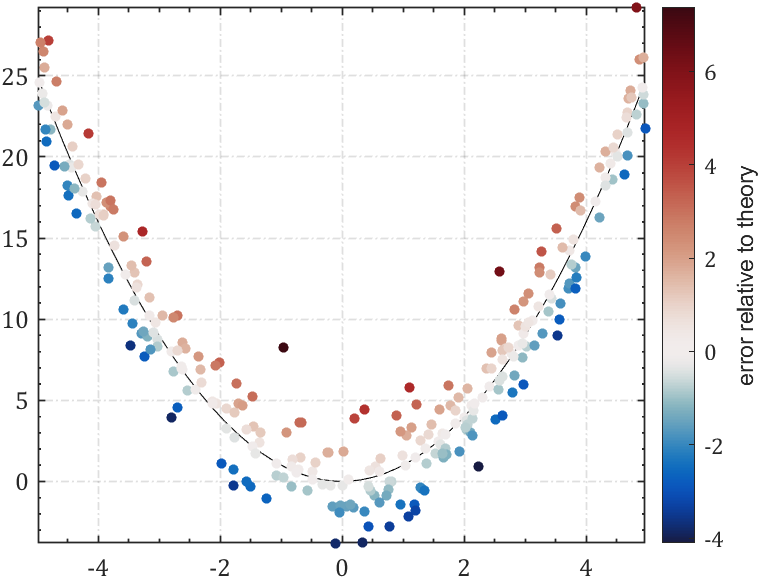
示例三
官网的一个例子:
% Some sample data with noise:
x = 10*rand(300,1)-5;
noise = 2*randn(size(x));
y = x.^2+noise;

% A theoretical perfect x^2 line:
x_theoretical = linspace(min(x),max(x),50);
y_theoretical = x_theoretical.^2;

% Plot the data:
figure
plot(x_theoretical,y_theoretical,'k-')
hold on
scatter(x,y,25,noise,'filled')

CM=[0.0941    0.1098    0.2627
    0.0431    0.3725    0.7451
    0.4588    0.6667    0.7451
    0.9451    0.9255    0.9235
    0.8157    0.5451    0.4510
    0.6510    0.1353    0.1431
    0.2353    0.0353    0.0706];
CMX=linspace(0,1,size(CM,1));
CMXX=linspace(0,1,256)';
CM=[interp1(CMX,CM(:,1),CMXX,'pchip'), ...
    interp1(CMX,CM(:,2),CMXX,'pchip'), ...
    interp1(CMX,CM(:,3),CMXX,'pchip')];
colormap(CM)
cb=colorbar;
ylabel(cb,'error relative to theory')
box off
axis tight
grid on

% 调整颜色图中点位置
setPivot(0)
完
以上已经是完整代码及其介绍,建议配合我之前开发的两款colormap补充包使用:
https://slandarer.blog.csdn.net/article/details/127719784
https://slandarer.blog.csdn.net/article/details/127935365


 171
171

 被折叠的 条评论
为什么被折叠?
被折叠的 条评论
为什么被折叠?
 到【灌水乐园】发言


