


 本文提供了一份小美赛D题的完整成品论文解析,针对赛题进行了详细解答,包括数据处理、图表绘制及结果分析等步骤。文章分为六大部分,涵盖交易群体分析、贸易目的统计等多个方面。
目录
大家好呀,从昨天早上8点发布赛题到现在,我已经更新完成了小美赛D题的完整成品论文,全文29页,一些修改说明提醒6页,正文22页,附录1页。本文章是对于赛题详细的手把手教你如何做的一个保姆级别教程,需要完整成品的可以直接看本文最下面的我的卡片。
总得来说,本题目难度比较低,因此做得很快,篇幅也是近期比赛里最少的,模型没什么可说的,主要是绘图以及理解题意,赛题难度比较低的时候,就一定要注意理解题目到底要让我们干什么,以及必须要注意一些小点,尽量做到全面考虑没有遗漏即可,在这方面而言,本题目还是有一些需要注意的点的。
我的论文总览:

摘要:

OK废话不多说,直接开始正文部分:
第一问:

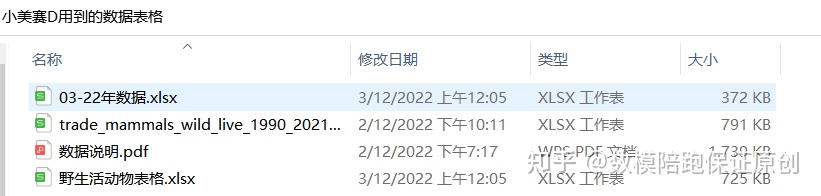
题目要求我们寻找交易最多的群体和物种。做之前我们先看一下题目给的数据吧:
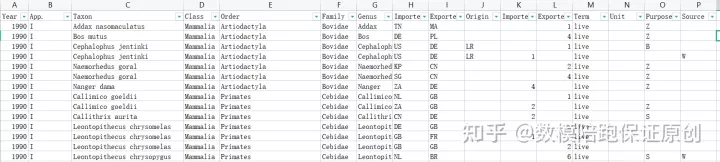
很明显我们是不知道各种表头的含义的,因此我们需要参考数据的说明表格:
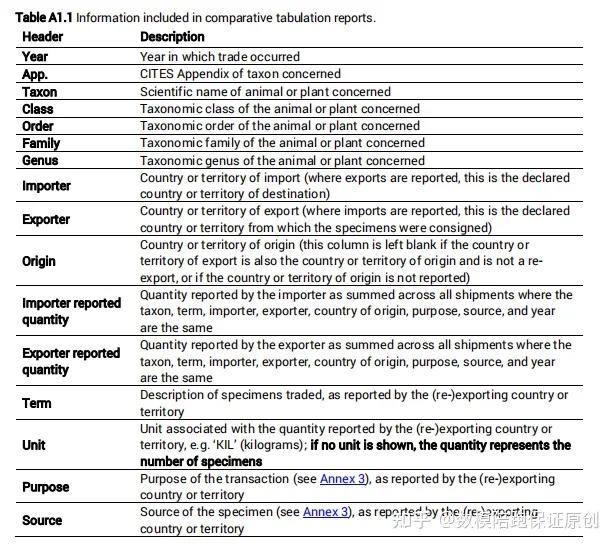
我把上面的每一个都翻译了一下,然后直接写在了表格上,这里大家要注意的是,不要直接采用机翻的,有的需要人工翻译:
之后我们看一下题目问的原文:
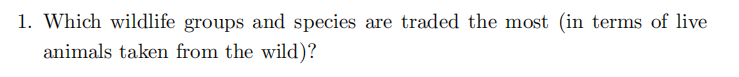
大家注意,groups和species这两个词在原数据表格里是没有直接相匹配的表头的,因此上面的四个表头都需要进行统计:

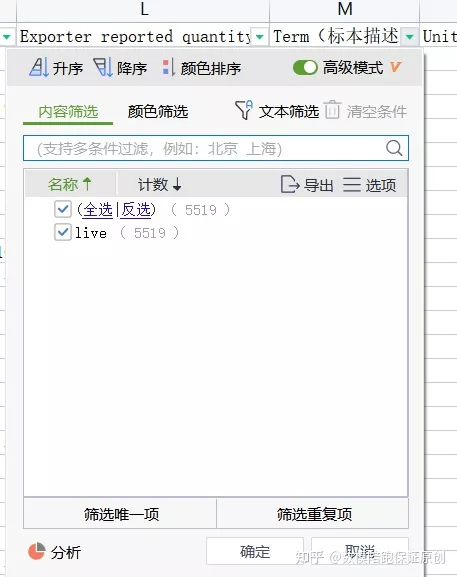
另外,题目要求我们统计的是live wild,也就是活且野生,
很明显,原题目全是活的:
但并不全是野生的:
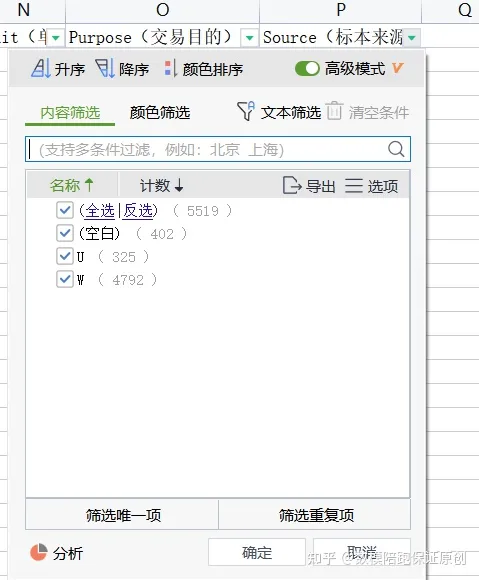
数据说明里有说到,这里的w表示的是wild......
因此既需要剔除其他两个,也就是不知道的和没有的。
剔除之后我就直接绘图统计分析了:
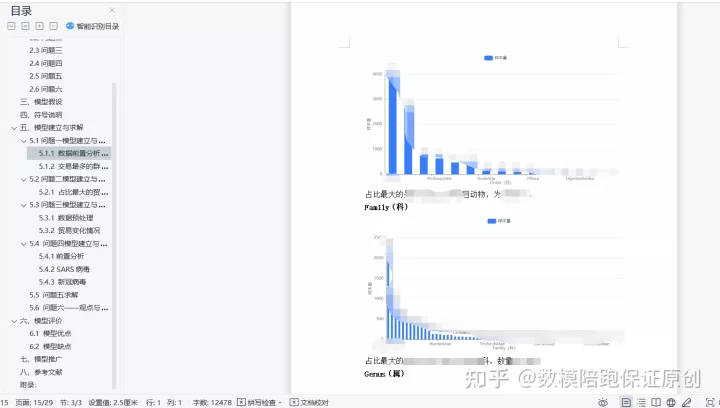
这里绘制条形图是方便大家既能看到数量也能看到占比,大家也可以绘制饼图。
OK第一问到这里结束。
第二问:
主要目的嘛,这次有表头对应了,purpose:
直接统计分析完事:
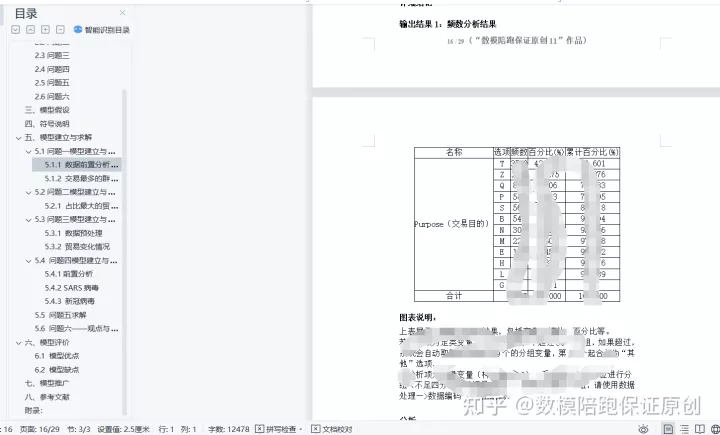
绘图,条形和饼图我都绘制了:
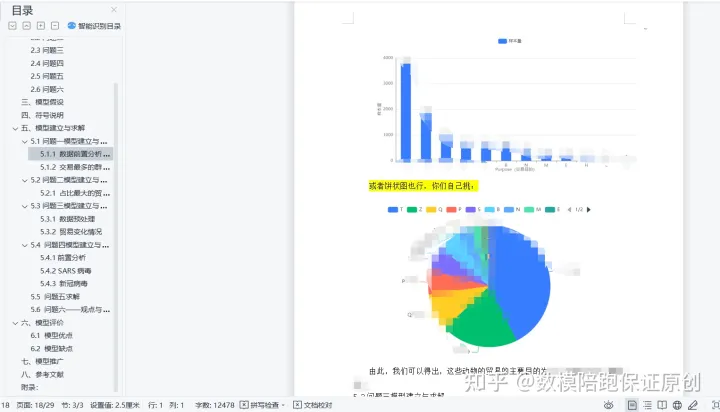
占比最大的描述一下就行了,第二问结束。
第三问:


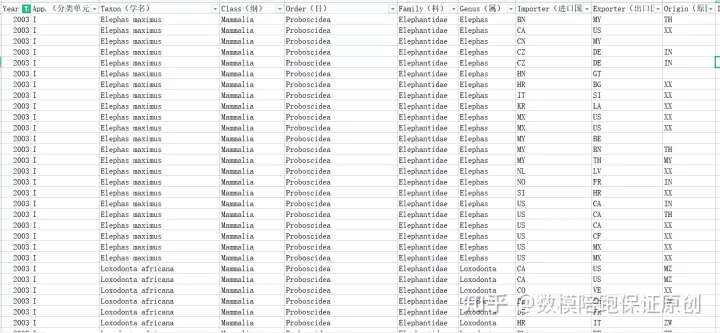
看一下原题目的数据:
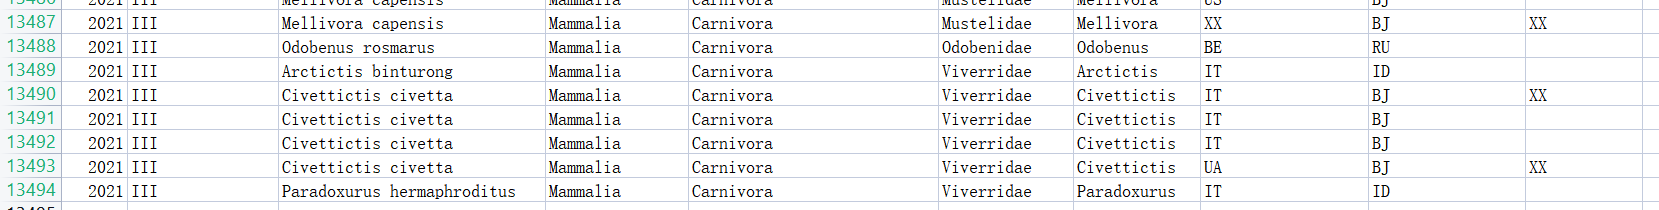
最多到2021,没有2022的,考虑下载原题目给的那个网站的数据:
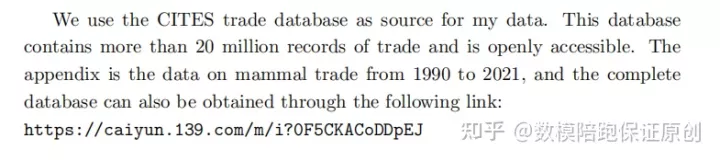
下载之后看了看,还是没有2022的:
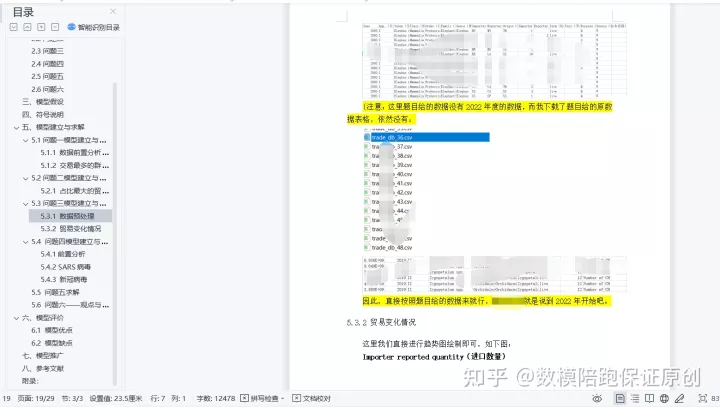
那就理解成到2022年开始吧,还是按照原题目的数据来源就行:
问你的是贸易情况,那就绘制进出口数量:
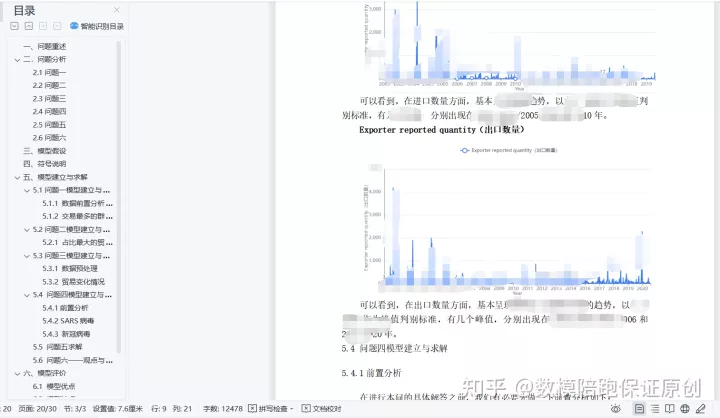
然后描述一下就行了。结束。
第四问:


大家要注意,到了这一问,问的是是否有关,有的人可能直接就去搜索相关文献或者说明了,然后直接引用到论文里,这样是不对的!
因为题目是给了我们贸易的相关数据的,因此必须要基于题目给的数据进行量化分析。
重大传染病就两个:SARS和新冠
分别分析一下这两个的起源时间、起源地、起源物种,然后找题目当年对应的贸易数据,然后绘图统计分析就行:

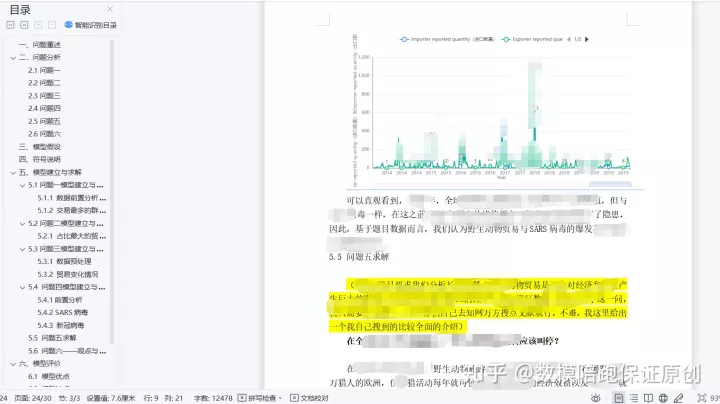
当然了具体分析的时候还是有一些坑的,这个相关性究竟怎么样,究竟怎么联系数据和病毒爆发之间的关系,还需要加上一些病毒本身的内部机理分析,没有那么简单,具体怎么回事为了保证限量,只给拿到我的完整成品论文的人去看哈。
这一问结束。
第五问:

到了这一问,问的是对于经济和社会的影响,题目是没有给这方面数据的,因此这一问直接查文献就行,我最终查到了对于禁止野生动物贸易的利弊以及措施比较权威和全面的说明:

第六问:


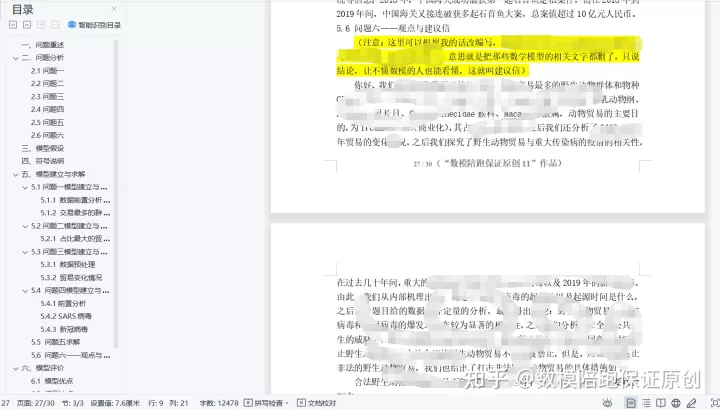
写信嘛,主要就是把自己全文的观点阐述一下再加上上一问的措施,这里要注意的是,不要直接搬摘要过来,信最大的不同是:
你需要把摘要里那些关于数学模型的字眼删掉,只保留核心的结论,意思也就是说,你要确保看到你信的人,即便完全不懂数学模型,也能充分理解你在说什么:
Ok彻底结束,大致的思路就是这些,我上述29页的完整成品原创论文以及我中间用到的所有数据表格都在:

OK就说到这里,完整成品获取点下面卡片就行。


 2037
2037

 被折叠的 条评论
为什么被折叠?
被折叠的 条评论
为什么被折叠?
 到【灌水乐园】发言


