


一、项目环境
nuxt 2.X + vue2.X + vuex + webpack
二、安装
yarn add echarts
三、使用
3.1、plugins目录下创建echarts.js
import Vue from 'vue'
import * as echarts from 'echarts' // 引入echarts
Vue.prototype.$echarts = echarts // 引入组件(将echarts注册为全局)
3.2、nuxt.config.js中plugins引入echarts.js
plugins: [
    { src: '../m-front-common/pc/plugins/echarts' },
],
3.3、创建图表容器
<div ref="chart" style="width:60%; height:200px;"></div>3.4、 定义option
参考第五项,option写在data里边即可
3.5、initChat
initChart() {
   this.chart = this.$echarts.init(this.$refs.chart)
   this.chart.setOption(this.option)
},
3.6、经过测试图表展示成功
四、过程记录
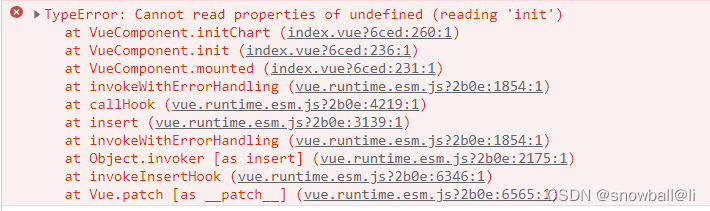
import Vue from 'vue'
// import echarts from 'echarts' // 引入echarts,这样可以会报错如上图
import * as echarts from 'echarts' // 引入echarts
Vue.prototype.$echarts = echarts // 引入组件(将echarts注册为全局)
五、echarts图表集-调试
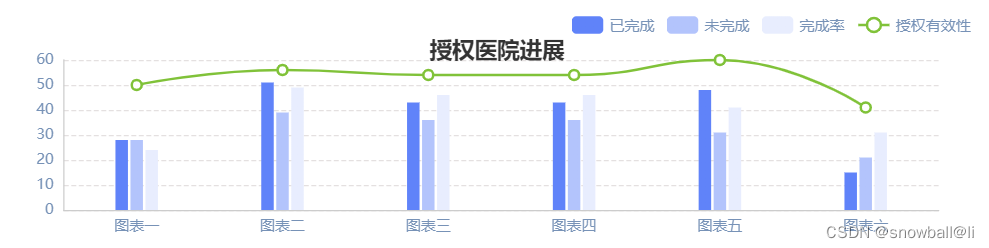
let chartData = {
xAxisData: ['图表一', '图表二', '图表三', '图表四', '图表五', '图表六'], // x轴 数据对应字段名
finishNum: [28, 51, 43, 43, 48, 15],
unFinishNum: [28, 39, 36, 36, 31, 21],
unFinishNum2: [24, 49, 46, 46, 41, 31],
finishRate: [50, 56, 54, 54, 60, 41],
}
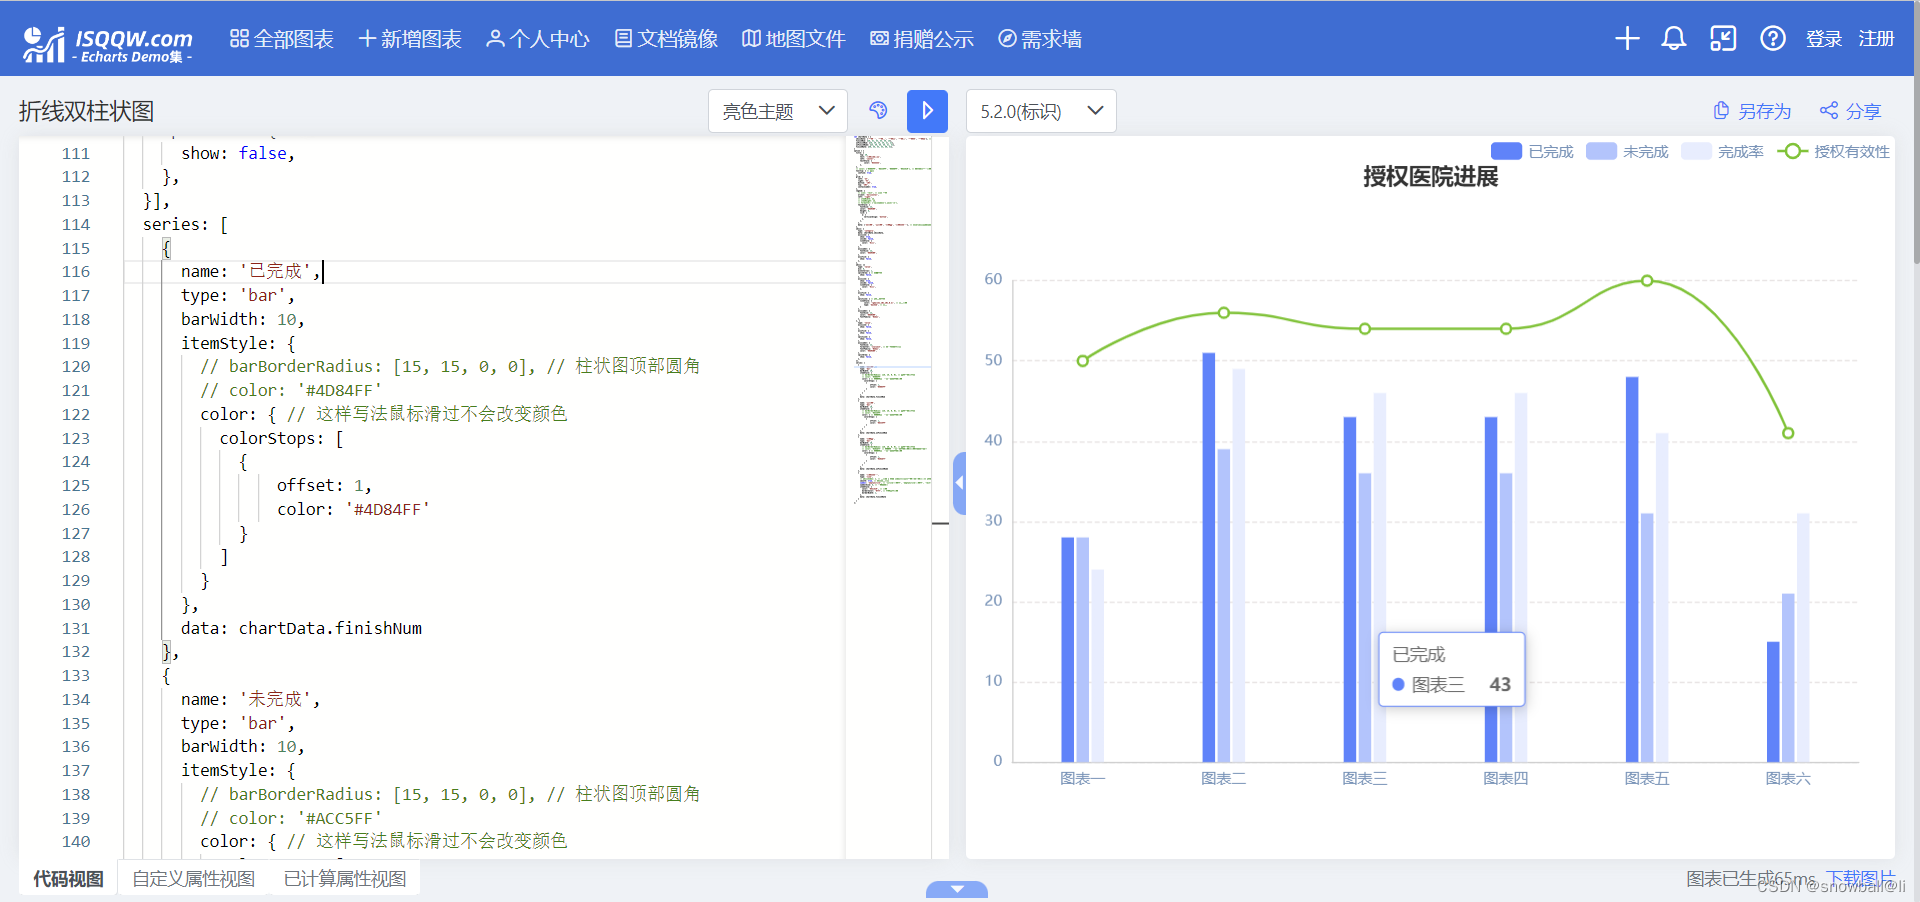
option = {
title: {
top: 20,
text: '授权医院进展',
left: 'center',
textStyle: {
color: '#333333',
},
},
// color: ['#4D84FF', '#ACC5FF', '#E6EDFF', '#52C419'], // 可以控制图标颜色, 也可以在series.itemStyle.color里边配置
tooltip: { // 提示
confine: true,
},
grid: {
left: '2%',
right: '4%',
bottom: '10%',
top: '20%',
containLabel: true,
},
legend: {
// icon: 'rect', // icon 形状
orient: 'horizontal',
left: 'right',
// itemWidth: 12,
// itemHeight: 12,
// formatter: ['{a|{name}}'].join('\n'),
textStyle: {
fontSize: 12,
color: '#6A93B9',
height: 8,
rich: {
a: {
verticalAlign: 'bottom',
},
},
},
data: ['已完成', '未完成', '完成率', '授权有效性'], // 与series里边的name对应
},
xAxis: {
type: 'category',
data: chartData.xAxisData,
axisLine: {
show: true,
inside: false,
lineStyle: {
color: '#ccc',
},
},
axisLabel: {
fontSize: 12,
color: '#6A93B9',
},
axisTick: {
show: false,
},
},
yAxis: [{
type: 'value',
min: 0,
minInterval: 1,
splitArea: { // 区域间隔
show: false,
},
axisLine: {
show: true,
inside: false,
lineStyle: {
color: '#ccc',
},
},
axisTick: {
show: false,
},
splitLine: { // y轴线条间隔
lineStyle: {
color: 'rgba(131,101,101,0.2)', // 虚线颜色
type: 'dashed', // 虚线
}
},
axisLabel: {
fontSize: 12,
color: '#6A93B9',
fontFamily: 'Bebas',
},
}, {
type: 'value',
axisLine: {
show: false,
},
axisTick: {
show: false,
},
splitLine: {
show: false,
},
axisLabel: {
fontSize: 12,
formatter: '{value}%', // 右侧Y轴文字显示
fontFamily: 'Bebas',
color: '#6A93B9',
},
splitArea: {
show: false,
},
}],
series: [
{
name: '已完成',
type: 'bar',
barWidth: 10,
itemStyle: {
// barBorderRadius: [15, 15, 0, 0], // 柱状图顶部圆角
// color: '#4D84FF'
color: { // 这样写法鼠标滑过不会改变颜色
colorStops: [
{
offset: 1,
color: '#4D84FF'
}
]
}
},
data: chartData.finishNum
},
{
name: '未完成',
type: 'bar',
barWidth: 10,
itemStyle: {
// barBorderRadius: [15, 15, 0, 0], // 柱状图顶部圆角
// color: '#ACC5FF'
color: { // 这样写法鼠标滑过不会改变颜色
colorStops: [
{
offset: 1,
color: '#ACC5FF'
}
]
}
},
data: chartData.unFinishNum
},
{
name: '完成率',
type: 'bar',
barWidth: 10,
itemStyle: {
// barBorderRadius: [15, 15, 0, 0], // 柱状图顶部圆角
// color: '#e6edff' // 这样写鼠标滑过会改变颜色,颜色浅的会看不见
color: { // 这样写法鼠标滑过不会改变颜色
colorStops: [
{
offset: 1,
color: '#e6edff'
}
]
}
},
data: chartData.unFinishNum2
},
{
name: '授权有效性',
type: 'line',
// yAxisIndex: 1, // 使用的 y 轴的 index,在单个图表实例中存在多个 y轴的时候有用
smooth: true, // 平滑曲线显示
symbol: 'emptyCircle', // 'circle-实心圆', 'emptyCircle-空心圆', 'rect-方形', 'roundRect-方形', 'triangle-三角', 'diamond-菱形', 'pin-别针', 'arrow-箭头', 'none'
symbolSize: 8, // 标记的大小
itemStyle: {
color: '#52c419', // 颜色
borderColor: '#fff', // 圆点边框颜色
borderWidth: 1,
},
data: chartData.finishRate
}
]
};
六、欢迎交流指正,关注我,一起学习
参考链接:
NUXT 中使用 Echarts_张兴华(MarsXH.Chang)的博客-CSDN博客_nuxt echart
vue中使用echarts_又年~的博客-CSDN博客_vue echarts
echartst图表hover改变文字或者柱子颜色. - 知乎
echarts 关于柱状图鼠标滑过背景时柱子消失问题 - 简书


 498
498


 被折叠的 条评论
为什么被折叠?
被折叠的 条评论
为什么被折叠?
 到【灌水乐园】发言


