


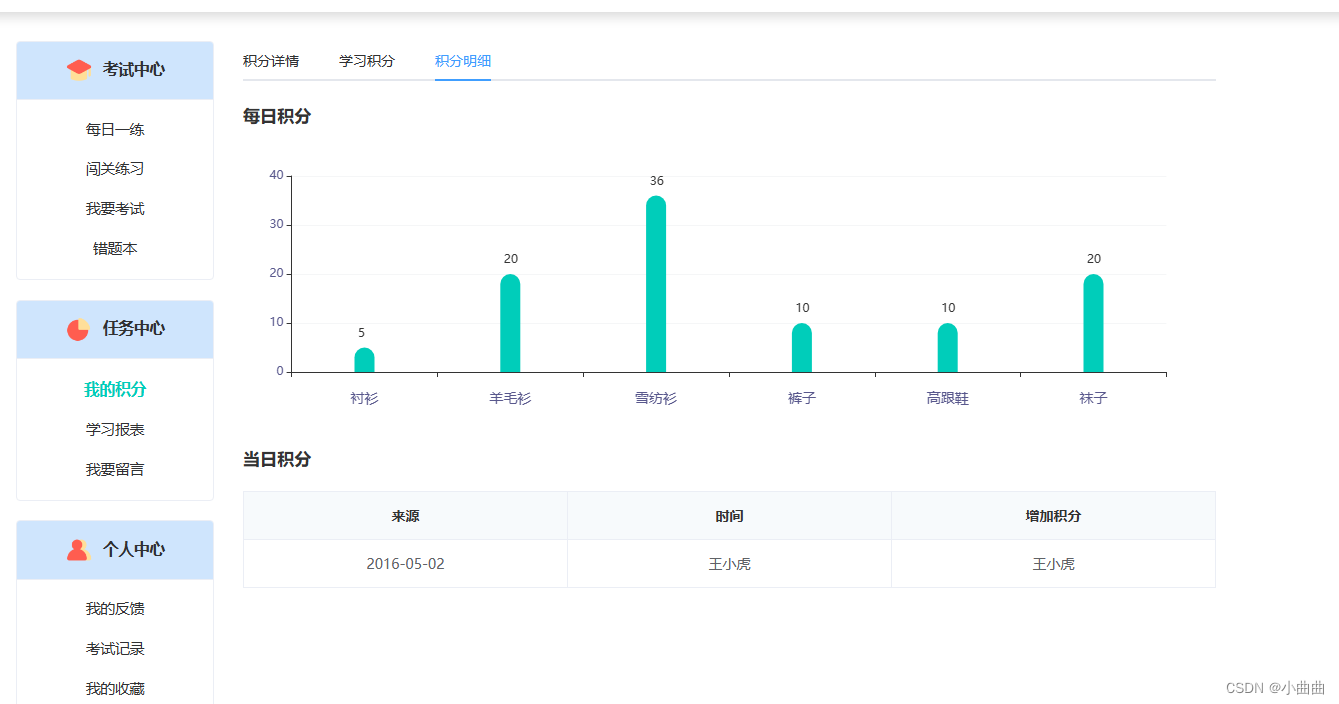
直接在页面写,不带滚动条
bug1:安装包报错,就更换版本
bug2:图表出不来:需要定义宽高
bug3:需要resize大小
安装
npm install echarts@4.9.0
plugins文件夹下新建echarts.js
import Vue from 'vue'
import echarts from 'echarts' // 引入echarts
Vue.prototype.$echarts = echarts // 引入组件(将echarts注册为全局)
nuxt.config.js中配置
 plugins: [
    '@/plugins/element-ui',
    { src: '@/plugins/utils', ssr: false },// axios.js文件关闭服务端渲染
    { src: '@/plugins/axios', ssr: false }, // axios.js文件关闭服务端渲染
    { src: "~/plugins/swiper.js", ssr: false },
    { src: '~/plugins/store-cache', ssr: false },
    { src: '~/plugins/flexiable.js', ssr: false },
    { src: '@/plugins/bus', ssr: false },
    { src: '~plugins/echarts', ssr: false },
  ],
页面
<div class="mtb-20" style="height: 3.6rem;">
    <div id="myChart" style="width: 12.5rem;height: 3.6rem;"></div>
</div>
export default {
  data() {
    return {
      barChart: null,
    };
  },
  mounted() {
    this.init()
    // 监听屏幕大小变化
    window.addEventListener("resize", this.screenResize);
  },
  beforeDestroy() {
    window.removeEventListener("resize", this.screenResize);
  },
  methods: {
    init() {
      // 找到容器
      this.barChart = this.$echarts.init(document.getElementById('myChart'))
      // 开始渲染
      this.barChart.setOption({
        grid: {
          top: "10%",
          right: "5%",
          left: "5%",
          bottom: "20%",
        },
        xAxis: [
          {
            type: "category",
            data: [],
            axisPointer: {
              type: "line",
            },
            axisLabel: {
              margin: 20,
              color: "#59588D",
              textStyle: {
                fontSize: 14,
              },
            },
          },
        ],
        yAxis: [
          {
            min: 0,
            axisLabel: {
              formatter: "{value}",
              color: "#59588D",
            },
            splitLine: {
              lineStyle: {
                color: "#f5f6f7",
              },
            },
          },
        ],
        series: [
          {
            type: "bar",
            data: [],
            barWidth: "20px",
            itemStyle: {
              normal: {
                color: '#00cdba',
                barBorderRadius: [30, 30, 0, 0],
              },
            },
            label: {
              normal: {
                show: true,
                borderRadius: 200,
                position: ["0", "-20"],
                formatter: [" {a|{c}}"].join(""),
                rich: {
                  a: {
                    color: "#333",
                    align: "center",
                  },
                },
              },
            },
          },
        ],
      })
      this.getData()
    },
    // 掉接口
    getData() {
      // 排序
      // 当前X、Y轴数据
      // let barDataX = list.map((item) => item.name);
      // let barDataY = list.map((item) => item.value);

      let dataOption = {
        xAxis: {
          data: ['衬衫', '羊毛衫', '雪纺衫', '裤子', '高跟鞋', '袜子'],
        },
        series: [
          {
            data: [5, 20, 36, 10, 10, 20], // 数据
          },
        ],
      };
      // 生成图表
      this.barChart.setOption(dataOption);
    },
    // 监听屏幕变化
    screenResize() {
      this.$nextTick(() => {
        // 更新图表
        this.barChart.resize();
      });
    },
  },
};
</script>
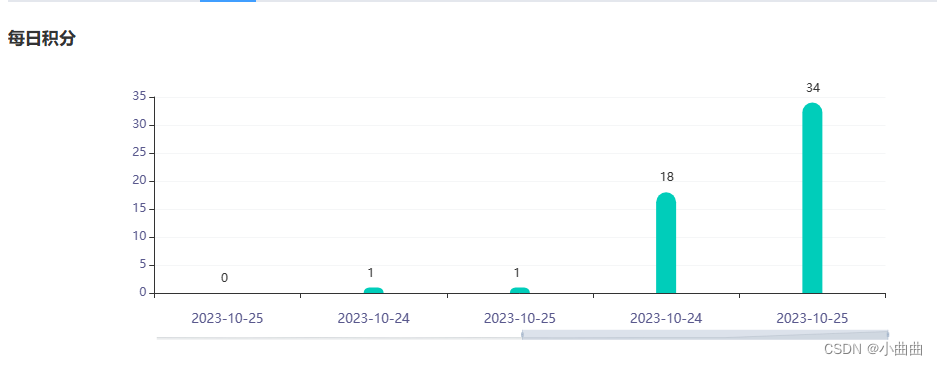
封装组件:有滚动条
根据数据的条数动态改变展示的个数
components/BarChart.vue 组件
<template>
  <div id="index">
    <div id="chart" :style="`width:${width};height: ${height};`"></div>
  </div>
</template>
<script>

export default {
  data() {
    return {
      chart: null,
    };
  },
  props: ["list", "width", "height"],
  watch: {
    list: {
      handler(val) {
        // 深度监听没有旧值
        this.date = val.map((item) => {
          return item.date;
        });
        this.number = val.map((item) => {
          return item.number;
        });

        let option = {
          xAxis: [
            {
              data: this.date,
            },
          ],
          series: [
            {
              data: this.number, // 订单量
            },
          ],
           // ***** 柱状图横坐标大于8条启用横向滚动条
          dataZoom: [//滚动条
            {
              show: val.length > 8 ? true : false,
              type: 'slider',
              realtime: true,
              start: 0,
              end: val.length > 20 ? 30 : val.length > 8 ? 50 : 100, //滚动条初始显示百分比
              xAxisIndex: [0],
              bottom: '10',
              height: 10,
              borderColor: 'rgba(0,0,0,0)',
              textStyle: {
                color: '#05D5FF',
              },
            },
          ],
        };
        this.chart.setOption(option);
      },
      // 这里是关键,代表递归监听的变化
      deep: true,
    },
  },
  mounted() {
    this.init()
    // 监听屏幕大小变化
    window.addEventListener("resize", this.screenResize);
  },
  beforeDestroy() {
    window.removeEventListener("resize", this.screenResize);
  },
  methods: {
    init() {
      // 找到容器
      this.chart = this.$echarts.init(document.getElementById('chart'))
      // 开始渲染
      this.chart.setOption({
        grid: {
          top: "10%",
          right: "5%",
          left: "5%",
          bottom: "20%",
        },
        xAxis: [
          {
            type: "category",
            data: [],
            axisPointer: {
              type: "line",
            },
            axisLabel: {
              margin: 20,
              color: "#59588D",
              textStyle: {
                fontSize: 13,
              },
            },
          },
        ],
        yAxis: [
          {
            min: 0,
            axisLabel: {
              formatter: "{value}",
              color: "#59588D",
            },
            splitLine: {
              lineStyle: {
                color: "#f5f6f7",
              },
            },
          },
        ],
        series: [
          {
            type: "bar",
            data: [],
            barWidth: "20px",
            itemStyle: {
              normal: {
                color: '#00cdba',
                barBorderRadius: [30, 30, 0, 0],
              },
            },
            label: {
              normal: {
                show: true,
                borderRadius: 200,
                position: ["0", "-20"],
                formatter: [" {a|{c}}"].join(""),
                rich: {
                  a: {
                    color: "#333",
                    align: "center",
                  },
                },
              },
            },
          },
        ],
      })
    },
    // 监听屏幕变化
    screenResize() {
      this.$nextTick(() => {
        // 更新图表
        this.chart.resize();
      });
    },
  },
};
</script>
<style scoped></style>
使用
 <div class="mtb-20" style="height: 3.6rem;">
    <BarChart :list="list" width="12.5rem" height="3.6rem"></BarChart>
 </div>
list: [] //柱状图
//模拟接口
 mounted() {
    setTimeout(() => {
      this.list = [{
        date: 1.1,
        number: 10
      }, {
        date: 2.1,
        number: 12
      }, {
        date: 3.1,
        number: 21
      }, {
        date: 4.1,
        number: 11
      }, {
        date: 5.1,
        number: 31
      },]
    }, 1000)
  },


 8468
8468


 被折叠的 条评论
为什么被折叠?
被折叠的 条评论
为什么被折叠?
 到【灌水乐园】发言


