


口袋妖怪数据集探索
数据读取
import pandas as pd
import seaborn as sns
import matplotlib.pyplot as plt
df = pd.read_csv("pokemon.csv")
df.head()
| abilities | against_bug | against_dark | against_dragon | against_electric | against_fairy | against_fight | against_fire | against_flying | against_ghost | ... | percentage_male | pokedex_number | sp_attack | sp_defense | speed | type1 | type2 | weight_kg | generation | is_legendary | |
|---|---|---|---|---|---|---|---|---|---|---|---|---|---|---|---|---|---|---|---|---|---|
| 0 | ['Overgrow', 'Chlorophyll'] | 1.0 | 1.0 | 1.0 | 0.5 | 0.5 | 0.5 | 2.0 | 2.0 | 1.0 | ... | 88.1 | 1 | 65 | 65 | 45 | grass | poison | 6.9 | 1 | 0 |
| 1 | ['Overgrow', 'Chlorophyll'] | 1.0 | 1.0 | 1.0 | 0.5 | 0.5 | 0.5 | 2.0 | 2.0 | 1.0 | ... | 88.1 | 2 | 80 | 80 | 60 | grass | poison | 13.0 | 1 | 0 |
| 2 | ['Overgrow', 'Chlorophyll'] | 1.0 | 1.0 | 1.0 | 0.5 | 0.5 | 0.5 | 2.0 | 2.0 | 1.0 | ... | 88.1 | 3 | 122 | 120 | 80 | grass | poison | 100.0 | 1 | 0 |
| 3 | ['Blaze', 'Solar Power'] | 0.5 | 1.0 | 1.0 | 1.0 | 0.5 | 1.0 | 0.5 | 1.0 | 1.0 | ... | 88.1 | 4 | 60 | 50 | 65 | fire | NaN | 8.5 | 1 | 0 |
| 4 | ['Blaze', 'Solar Power'] | 0.5 | 1.0 | 1.0 | 1.0 | 0.5 | 1.0 | 0.5 | 1.0 | 1.0 | ... | 88.1 | 5 | 80 | 65 | 80 | fire | NaN | 19.0 | 1 | 0 |
5 rows × 41 columns
df.info()
<class 'pandas.core.frame.DataFrame'>
RangeIndex: 801 entries, 0 to 800
Data columns (total 41 columns):
 #   Column             Non-Null Count  Dtype
---  ------             --------------  -----
 0   abilities          801 non-null    object
 1   against_bug        801 non-null    float64
 2   against_dark       801 non-null    float64
 3   against_dragon     801 non-null    float64
 4   against_electric   801 non-null    float64
 5   against_fairy      801 non-null    float64
 6   against_fight      801 non-null    float64
 7   against_fire       801 non-null    float64
 8   against_flying     801 non-null    float64
 9   against_ghost      801 non-null    float64
 10  against_grass      801 non-null    float64
 11  against_ground     801 non-null    float64
 12  against_ice        801 non-null    float64
 13  against_normal     801 non-null    float64
 14  against_poison     801 non-null    float64
 15  against_psychic    801 non-null    float64
 16  against_rock       801 non-null    float64
 17  against_steel      801 non-null    float64
 18  against_water      801 non-null    float64
 19  attack             801 non-null    int64
 20  base_egg_steps     801 non-null    int64
 21  base_happiness     801 non-null    int64
 22  base_total         801 non-null    int64
 23  capture_rate       801 non-null    object
 24  classfication      801 non-null    object
 25  defense            801 non-null    int64
 26  experience_growth  801 non-null    int64
 27  height_m           781 non-null    float64
 28  hp                 801 non-null    int64
 29  japanese_name      801 non-null    object
 30  name               801 non-null    object
 31  percentage_male    703 non-null    float64
 32  pokedex_number     801 non-null    int64
 33  sp_attack          801 non-null    int64
 34  sp_defense         801 non-null    int64
 35  speed              801 non-null    int64
 36  type1              801 non-null    object
 37  type2              417 non-null    object
 38  weight_kg          781 non-null    float64
 39  generation         801 non-null    int64
 40  is_legendary       801 non-null    int64
dtypes: float64(21), int64(13), object(7)
memory usage: 256.7+ KB
# 计算出每个特征有多少百分比是缺失的
percent_missing = df.isnull().sum() * 100 / len(df)
missing_value_df = pd.DataFrame({
    'column_name': df.columns,
    'percent_missing': percent_missing
})
missing_value_df.sort_values(by='percent_missing', ascending=False).head(10)
| column_name | percent_missing | |
|---|---|---|
| type2 | type2 | 47.940075 |
| percentage_male | percentage_male | 12.234707 |
| weight_kg | weight_kg | 2.496879 |
| height_m | height_m | 2.496879 |
| name | name | 0.000000 |
| capture_rate | capture_rate | 0.000000 |
| classfication | classfication | 0.000000 |
| defense | defense | 0.000000 |
| experience_growth | experience_growth | 0.000000 |
| hp | hp | 0.000000 |
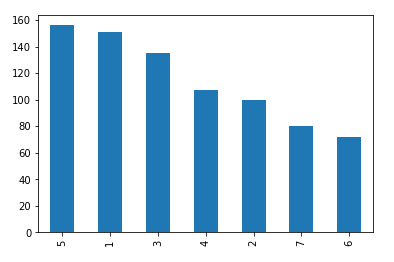
# 查看各代口袋妖怪的数量
df['generation'].value_counts().sort_values(ascending=False).plot.bar()
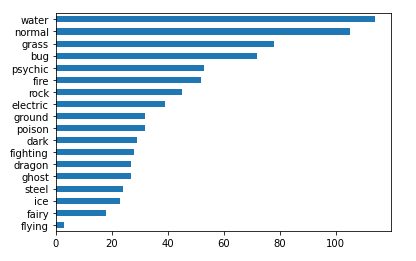
# 查看每个系口袋妖怪的数量
df['type1'].value_counts().sort_values(ascending=True).plot.barh()
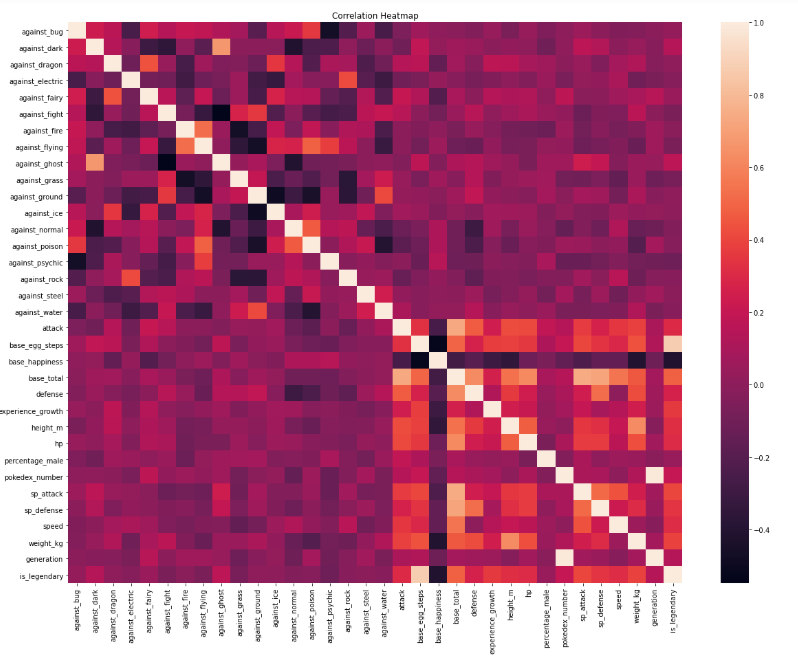
# 相关性热力图分析
plt.subplots(figsize=(20,15))
ax = plt.axes()
ax.set_title("Correlation Heatmap")
corr = df.corr()
sns.heatmap(corr,
            xticklabels=corr.columns.values,
            yticklabels=corr.columns.values)
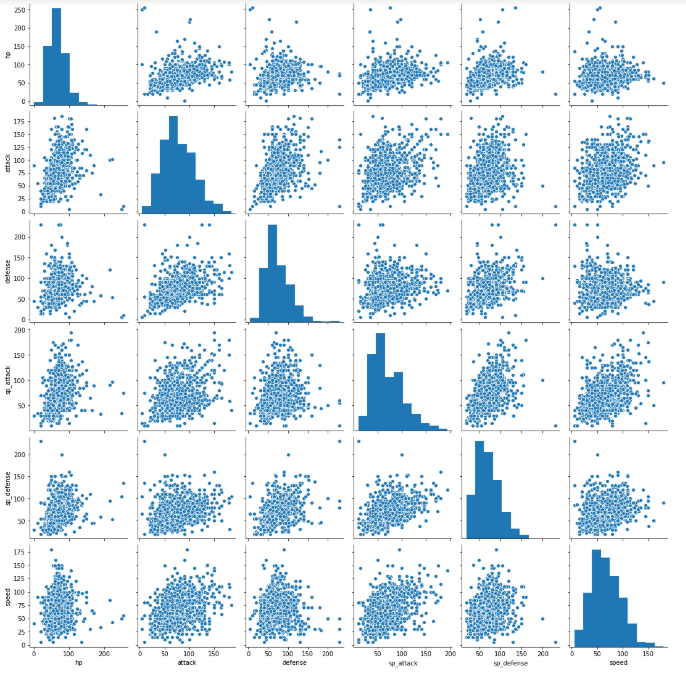
# 画出 'hp','attack','defense','sp_attack','sp_defense','speed' 之间的相关矩阵
interested = ['hp','attack','defense','sp_attack','sp_defense','speed']
sns.pairplot(df[interested])
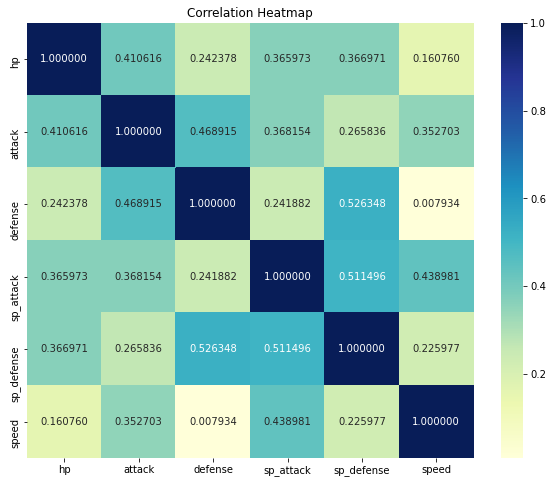
# 通过相关性分析heatmap分析五个基础属性
plt.subplots(figsize=(10,8))
ax = plt.axes()
ax.set_title("Correlation Heatmap")
corr = df[interested].corr()
sns.heatmap(corr,
            xticklabels=corr.columns.values,
            yticklabels=corr.columns.values,
            annot=True, fmt="f",cmap="YlGnBu")
# 统计种族值大于等于525的数量
for c in interested:
    df[c] = df[c].astype(float)

df = df.assign(total_stats = df[interested].sum(axis=1))
df[df.total_stats >= 525].shape
(167, 42)
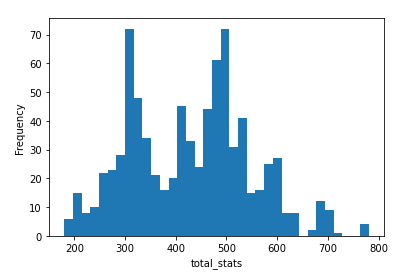
# 种族值分布
total_stats = df.total_stats
plt.hist(total_stats,bins=35)
plt.xlabel('total_stats')
plt.ylabel('Frequency')
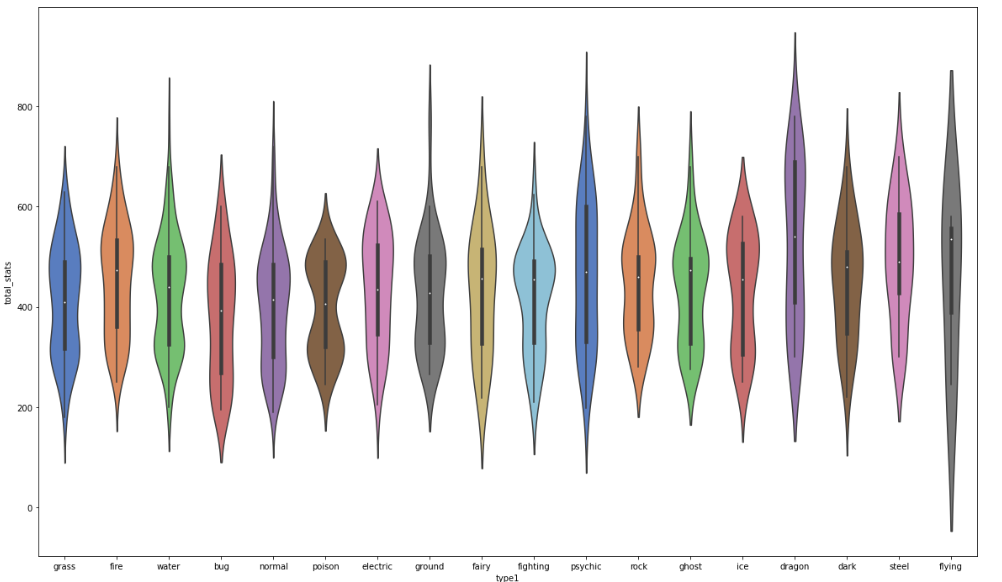
plt.subplots(figsize=(20,12))
ax = sns.violinplot(x="type1", y="total_stats",
                    data=df, palette="muted")
# 种族值大于570的,但是不是神兽的
df[(df.total_stats >= 570) & (df.is_legendary == 0)]['name'].head(10)
2        Venusaur
5       Charizard
8       Blastoise
17        Pidgeot
64       Alakazam
79        Slowbro
93         Gengar
114    Kangaskhan
126        Pinsir
129      Gyarados
Name: name, dtype: object
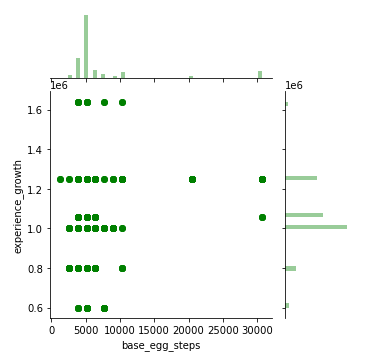
其他分析
sns.jointplot("base_egg_steps", "experience_growth", data=df, size=5, ratio=3, color="g")
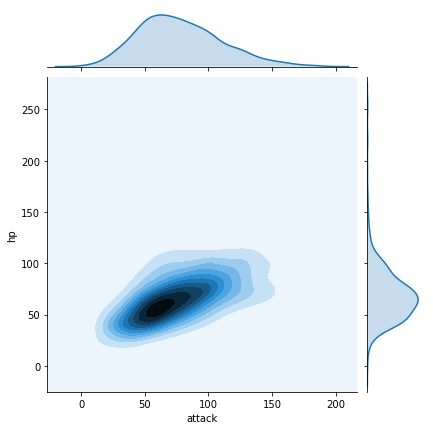
# hp 和 attack 之间的关系
sns.jointplot("attack", "hp", data=df, kind="kde")
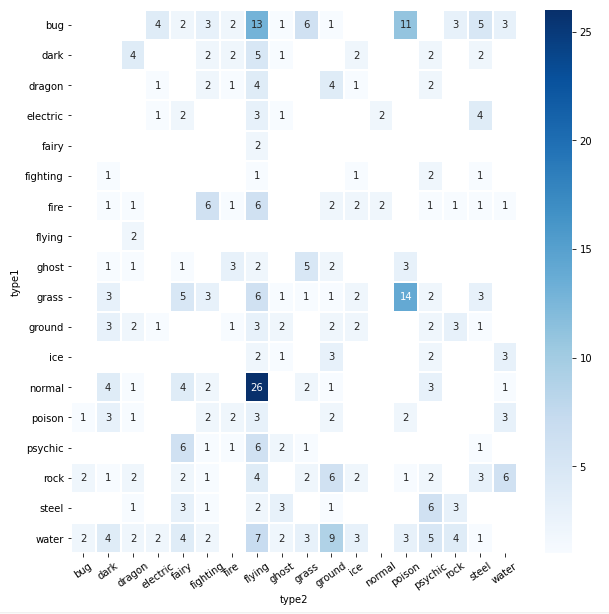
# 双系宝可梦数量统计
plt.subplots(figsize=(10, 10))

sns.heatmap(
    df[df['type2']!='None'].groupby(['type1', 'type2']).size().unstack(),
    linewidths=1,
    annot=True,
    cmap="Blues"
)

plt.xticks(rotation=35)
plt.show()


 2204
2204

 被折叠的 条评论
为什么被折叠?
被折叠的 条评论
为什么被折叠?
 到【灌水乐园】发言


